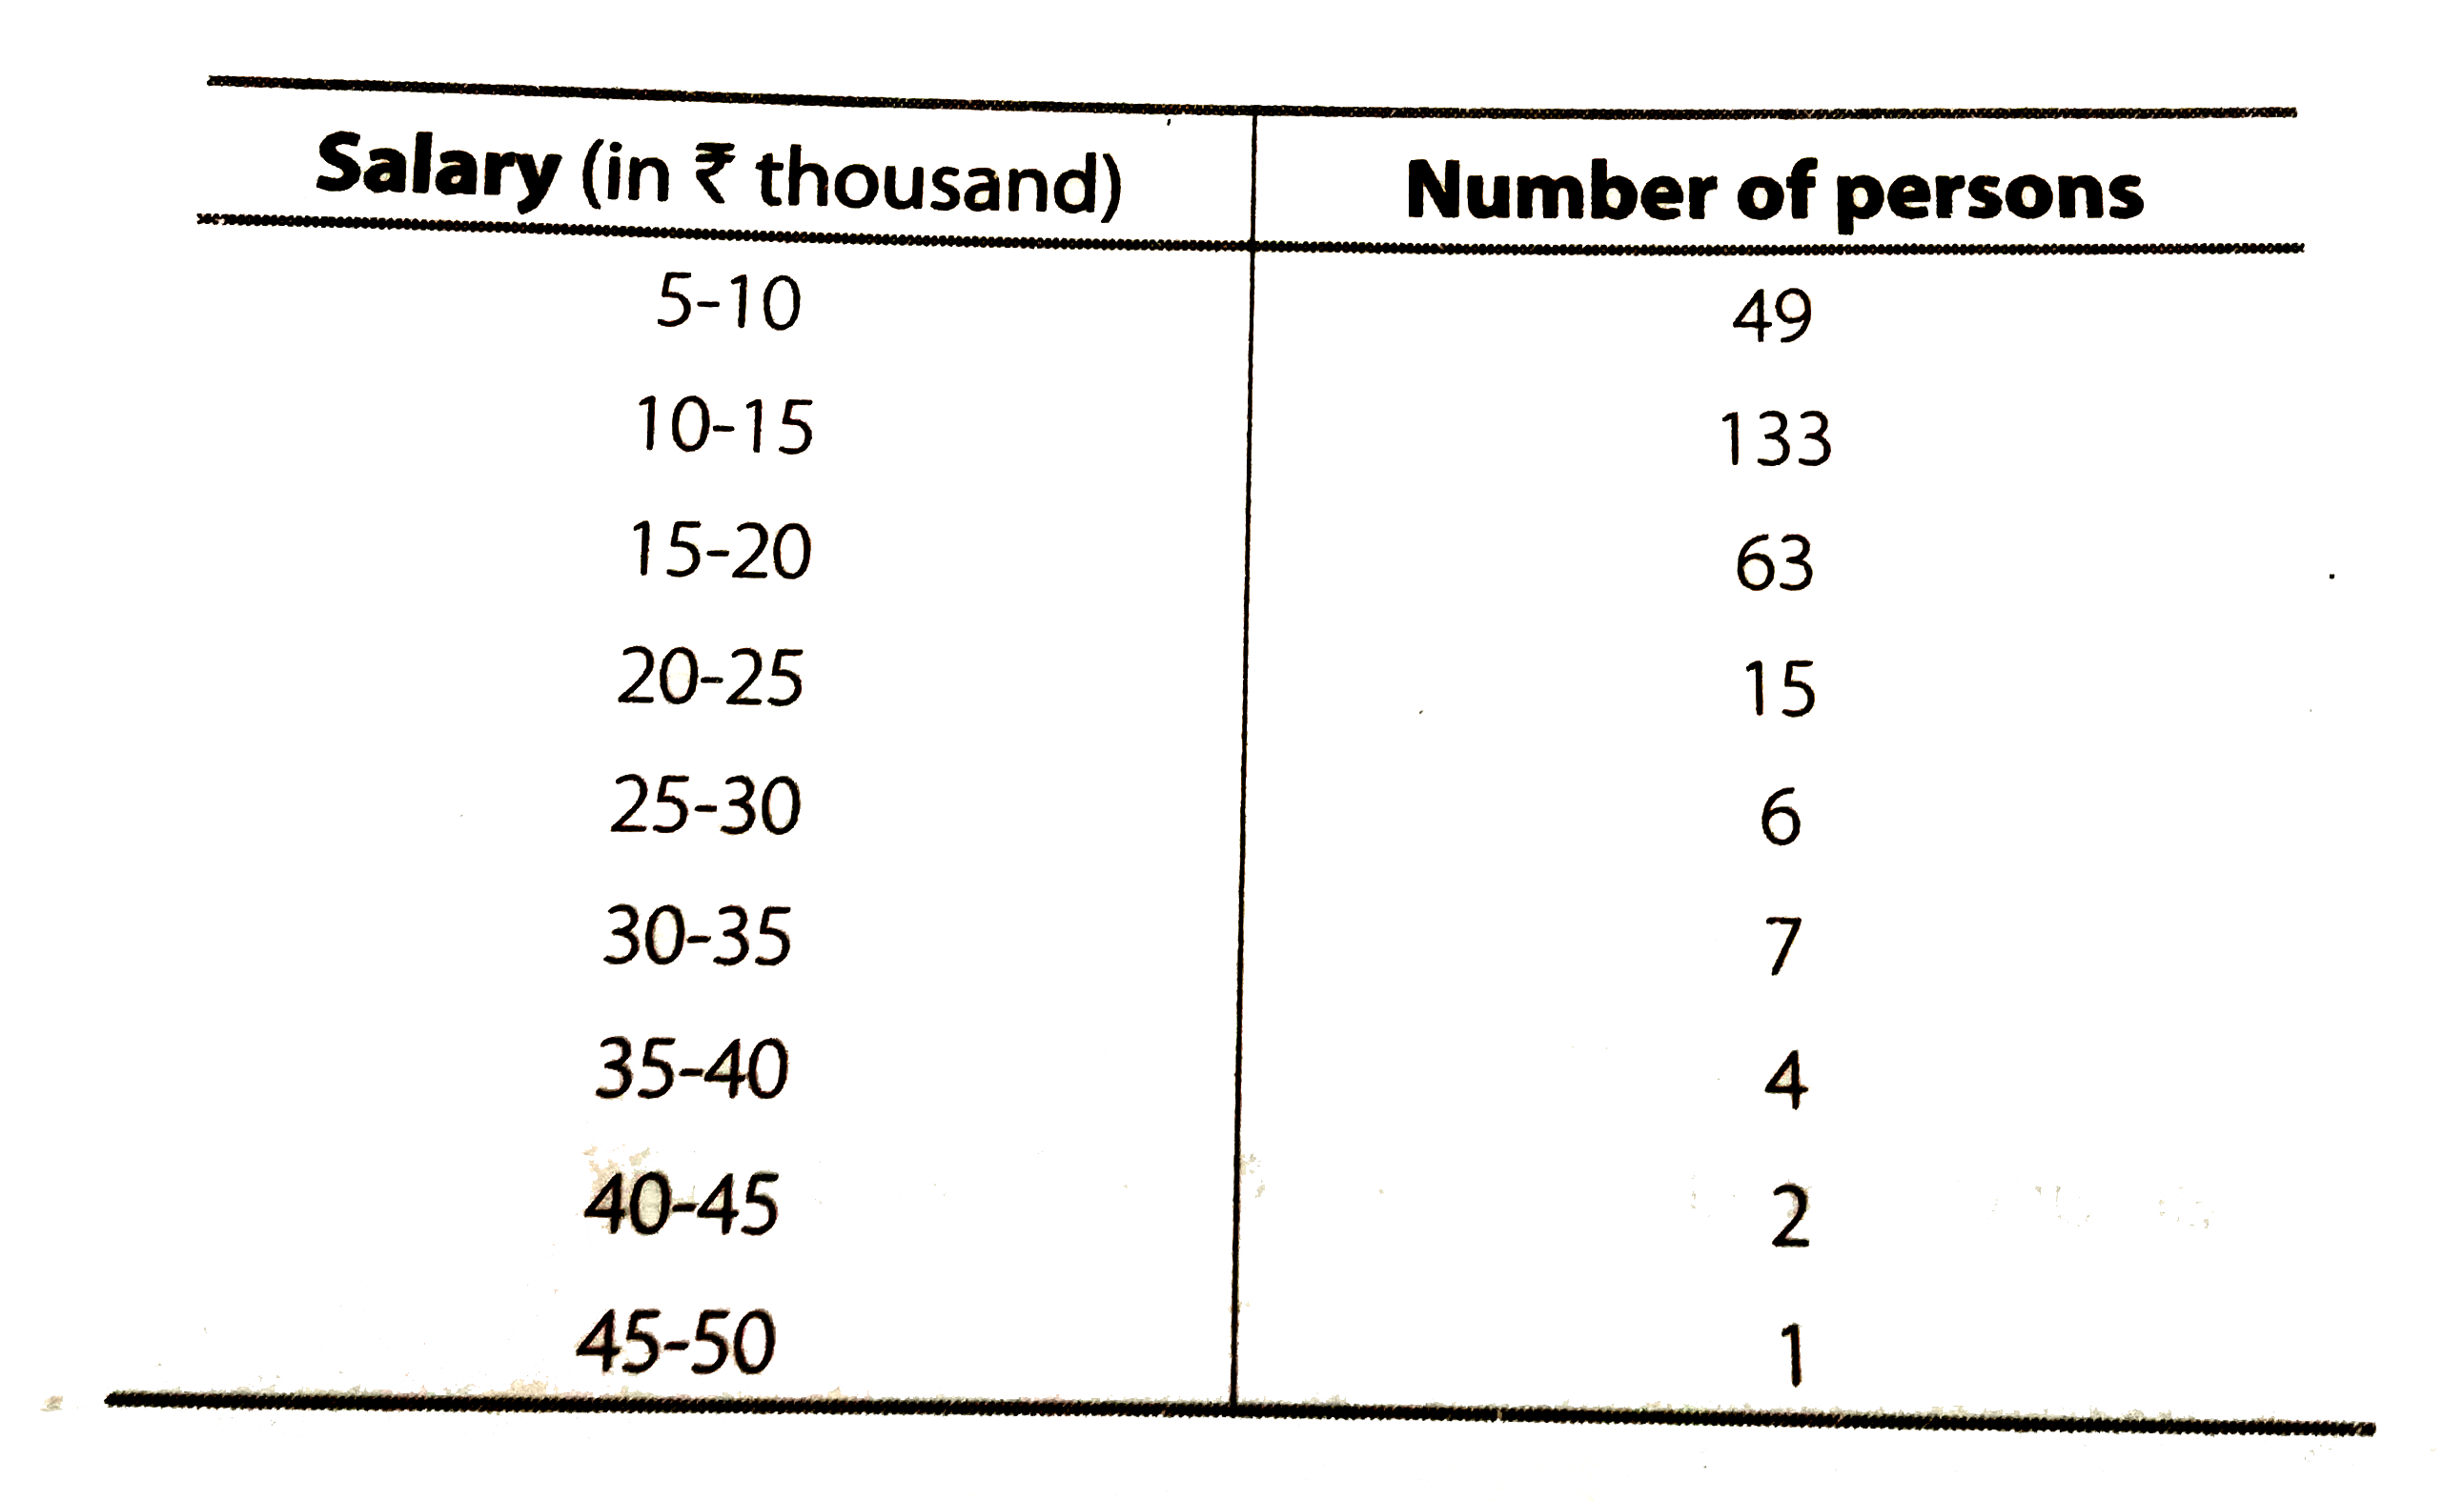
The table below shows Salary of 280 persons. Calculate the median salary of the data.
To calculate the median salary from the given frequency distribution, we will follow these steps:
Step 1: Create a Cumulative Frequency Table
We need to calculate the cumulative frequency for each salary range. The cumulative frequency is found by adding the frequency of the current class to the cumulative frequency of the previous class.
Example Table:
| Salary Range (in thousands) | Frequency | Cumulative Frequency |
|-----------------------------|-----------|----------------------|
| 5 - 10 | 49 | 49 |
| 10 - 15 | 133 | 49 + 133 = 182 |
| 15 - 20 | 63 | 182 + 63 = 245 |
| 20 - 25 | 15 | 245 + 15 = 260 |
| 25 - 30 | 6 | 260 + 6 = 266 |
| 30 - 35 | 7 | 266 + 7 = 273 |
| 35 - 40 | 4 | 273 + 4 = 277 |
| 40 - 45 | 2 | 277 + 2 = 279 |
| 45 - 50 | 1 | 279 + 1 = 280 |
Step 2: Determine the Median Class
To find the median class, we first calculate n/2, where n is the total number of observations. Here, n=280, so:
n/2=280/2=140
Now, we look for the cumulative frequency that is just greater than or equal to 140. From the table, the cumulative frequency of 182 (for the class 10 - 15) is the first cumulative frequency that is greater than 140. Therefore, the median class is 10 - 15.
Step 3: Identify the Values Needed for the Median Formula
- Lower limit (l) of the median class = 10
- Cumulative frequency (cf) of the class preceding the median class = 49 (for the class 5 - 10)
- Frequency (f) of the median class = 133
- Class size (h) = 5 (the difference between the upper and lower limits of the class)
Step 4: Apply the Median Formula
The formula for the median is given by:
Median=l+(n/2−cff)×h
Substituting the values we have:
Median=10+(140−49133)×5
Step 5: Calculate the Median
Now, we will perform the calculations step-by-step:
1. Calculate n/2−cf:
140−49=91
2. Divide by frequency f:
91133≈0.684
3. Multiply by class size h:
0.684×5≈3.42
4. Finally, add to the lower limit l:
Median=10+3.42≈13.42
Final Result
The median salary is approximately 13.42 thousand.
---
We need to calculate the cumulative frequency for each salary range. The cumulative frequency is found by adding the frequency of the current class to the cumulative frequency of the previous class.
|-----------------------------|-----------|----------------------|
| 5 - 10 | 49 | 49 |
| 10 - 15 | 133 | 49 + 133 = 182 |
| 15 - 20 | 63 | 182 + 63 = 245 |
| 20 - 25 | 15 | 245 + 15 = 260 |
| 25 - 30 | 6 | 260 + 6 = 266 |
| 30 - 35 | 7 | 266 + 7 = 273 |
| 35 - 40 | 4 | 273 + 4 = 277 |
| 40 - 45 | 2 | 277 + 2 = 279 |
| 45 - 50 | 1 | 279 + 1 = 280 |
To find the median class, we first calculate n/2, where n is the total number of observations. Here, n=280, so:
- Lower limit (l) of the median class = 10
- Cumulative frequency (cf) of the class preceding the median class = 49 (for the class 5 - 10)
- Frequency (f) of the median class = 133
- Class size (h) = 5 (the difference between the upper and lower limits of the class)
The formula for the median is given by:
Now, we will perform the calculations step-by-step:
140−49=91
91133≈0.684
0.684×5≈3.42
Median=10+3.42≈13.42
The median salary is approximately 13.42 thousand.
Topper's Solved these Questions
Similar Questions
Knowledge Check
The table below shows the results of a survey of 250 people who were asked whether they like to read and whether they play a musical instrument.
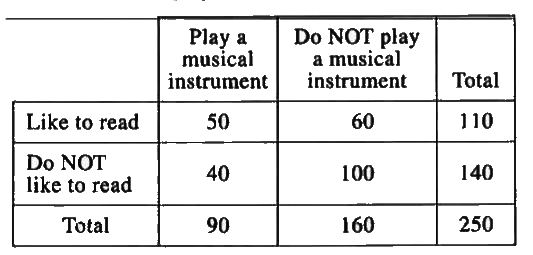
According the the results, what is the probability that a randomly selected person who was surveyed likes to read, given that the person plays a musical instrument?A15B59C511D925The table below shows the numbers of rows and columns in each of 5 matrices.
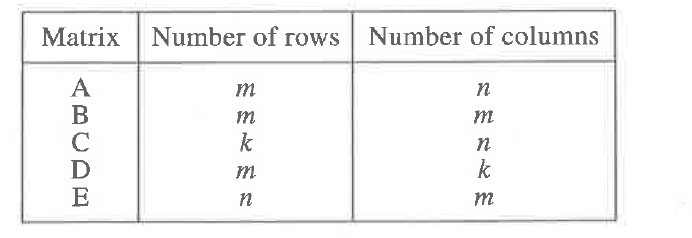
For distinct values of k, m, and n, which of the following matrix products is NOT possible?AEDBDCCCEDACGiven below is the climatic data of a station. Study the table and answer the questins that follow :

Calculate the annual range of temperature.A19.8∘CB19.8∘CC20.8∘CD18.8∘C
Consider a small unit of a factory where there are 5 employees : a supervisor and four labourers. The labourers draw a salary of Rs 5,000 per month each while the supervisor gets Rs 15,000 per month. Calculate the mean, median and mode of the salaries of this unit of the factory.
View SolutionA life insurance agent found the following data for distribution of ages of 100 policy holders. Calculate the median age, if policies are only given to persons having age 18 years onwards but less than 60 years. Age(inyears) Numberofpolicyholders Below20 2 Below25 6 Below 30 24 Below 35 45 Below 40 78 Below 45 89 Below 50 92 Below 55 98 Below 60 100
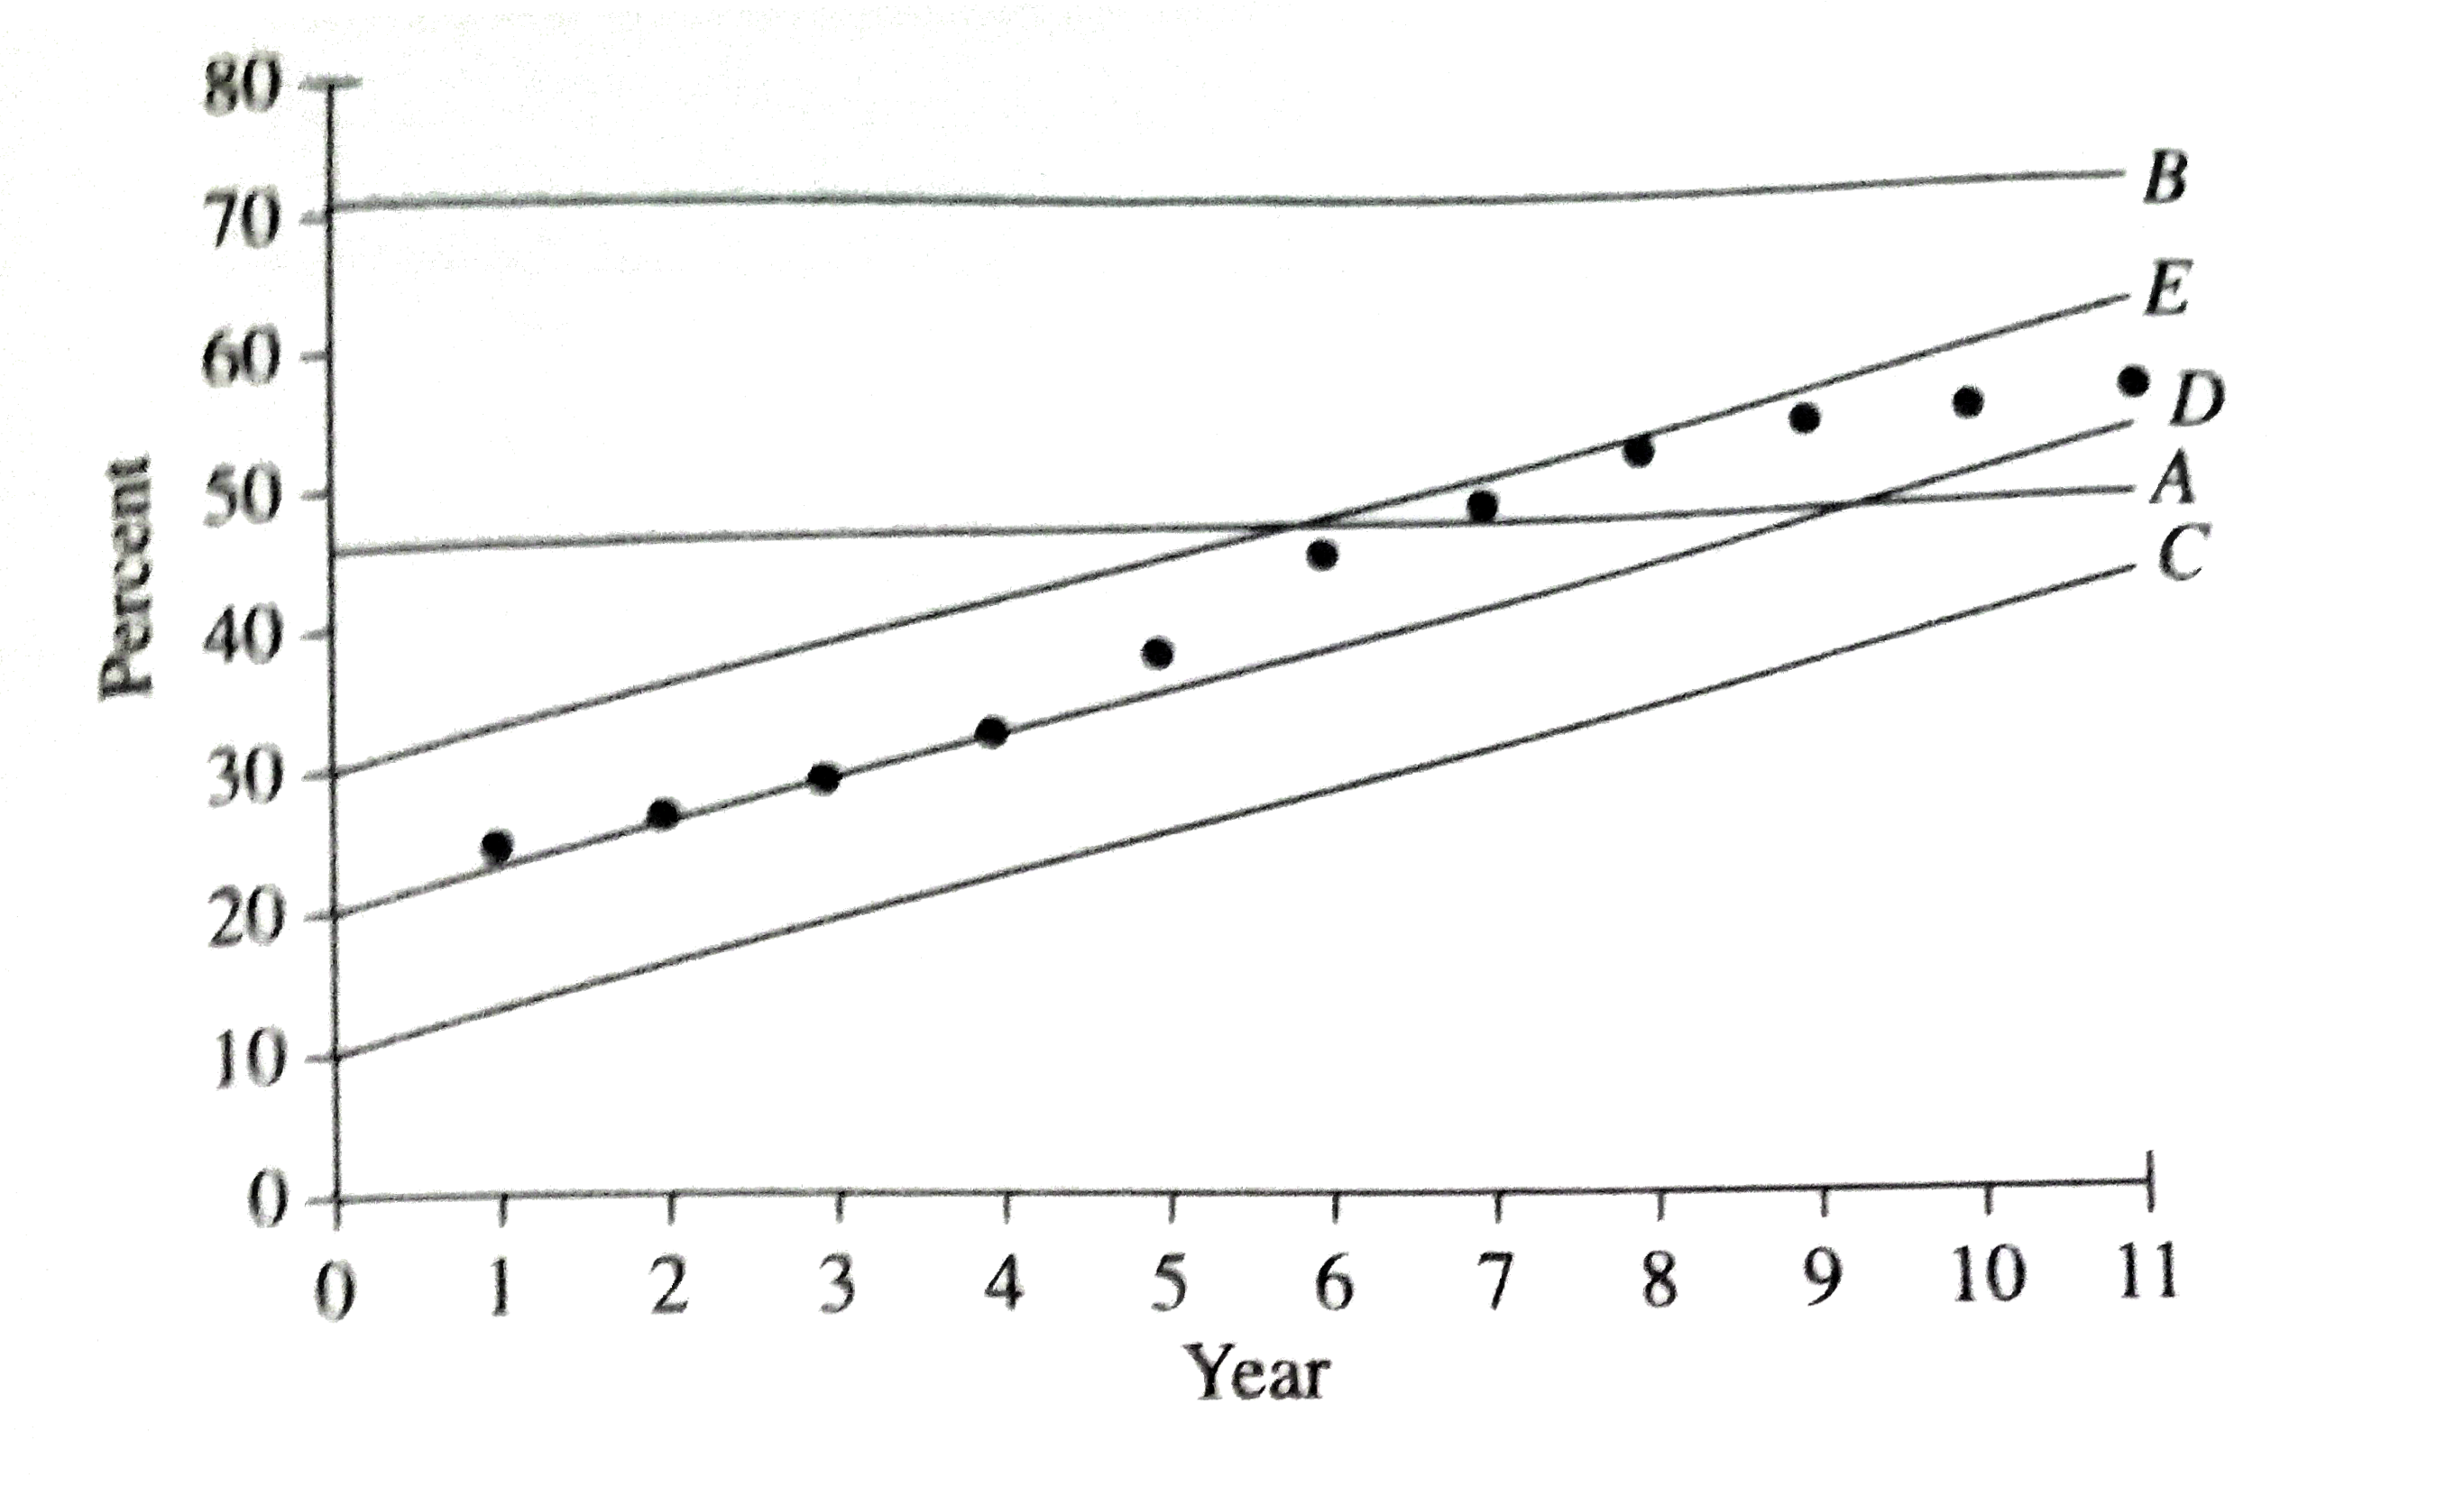
View SolutionThe table below shows the percents of U.S. citizens who had ever consumed Bob's soda , out of all soda consumers , for each year form 1986 through 2006.
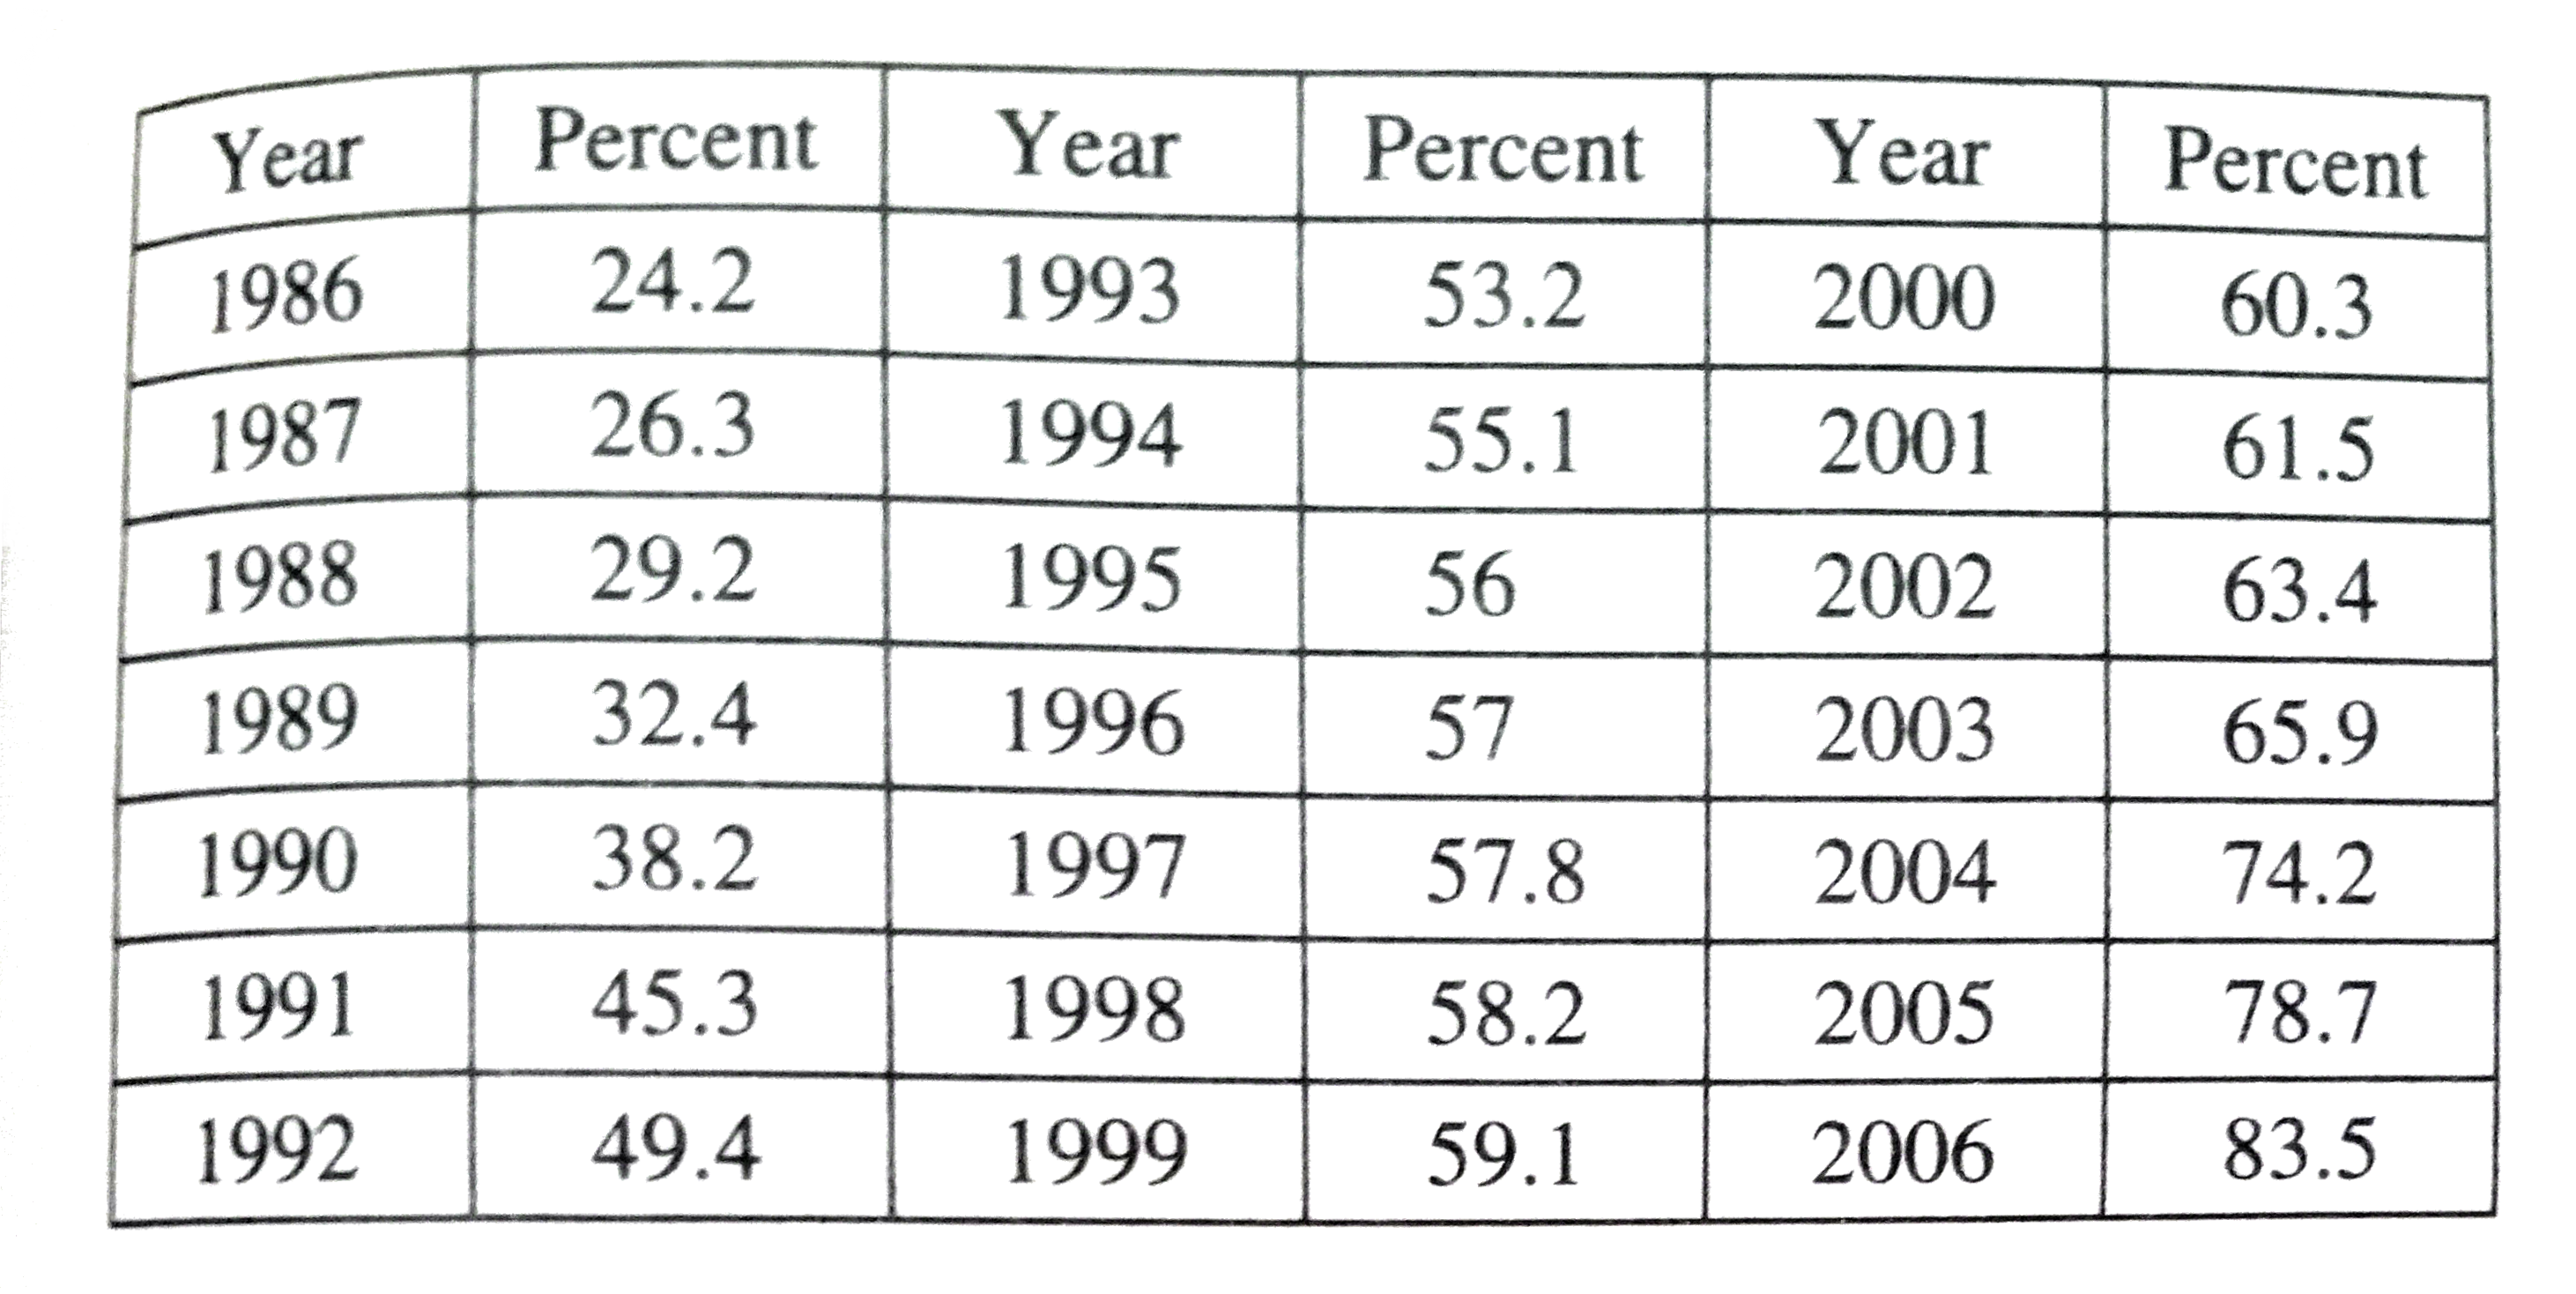
The figure below shows a scatterplot of the data in the table and solid lines that are possible modals for the data. Which of the 5 lines appears to be the best representation of the data ?
View SolutionThe figure below shows a ramp for skateboarders. The base of the ramp is 25 feet long, and it rises at a 10∘ angle.
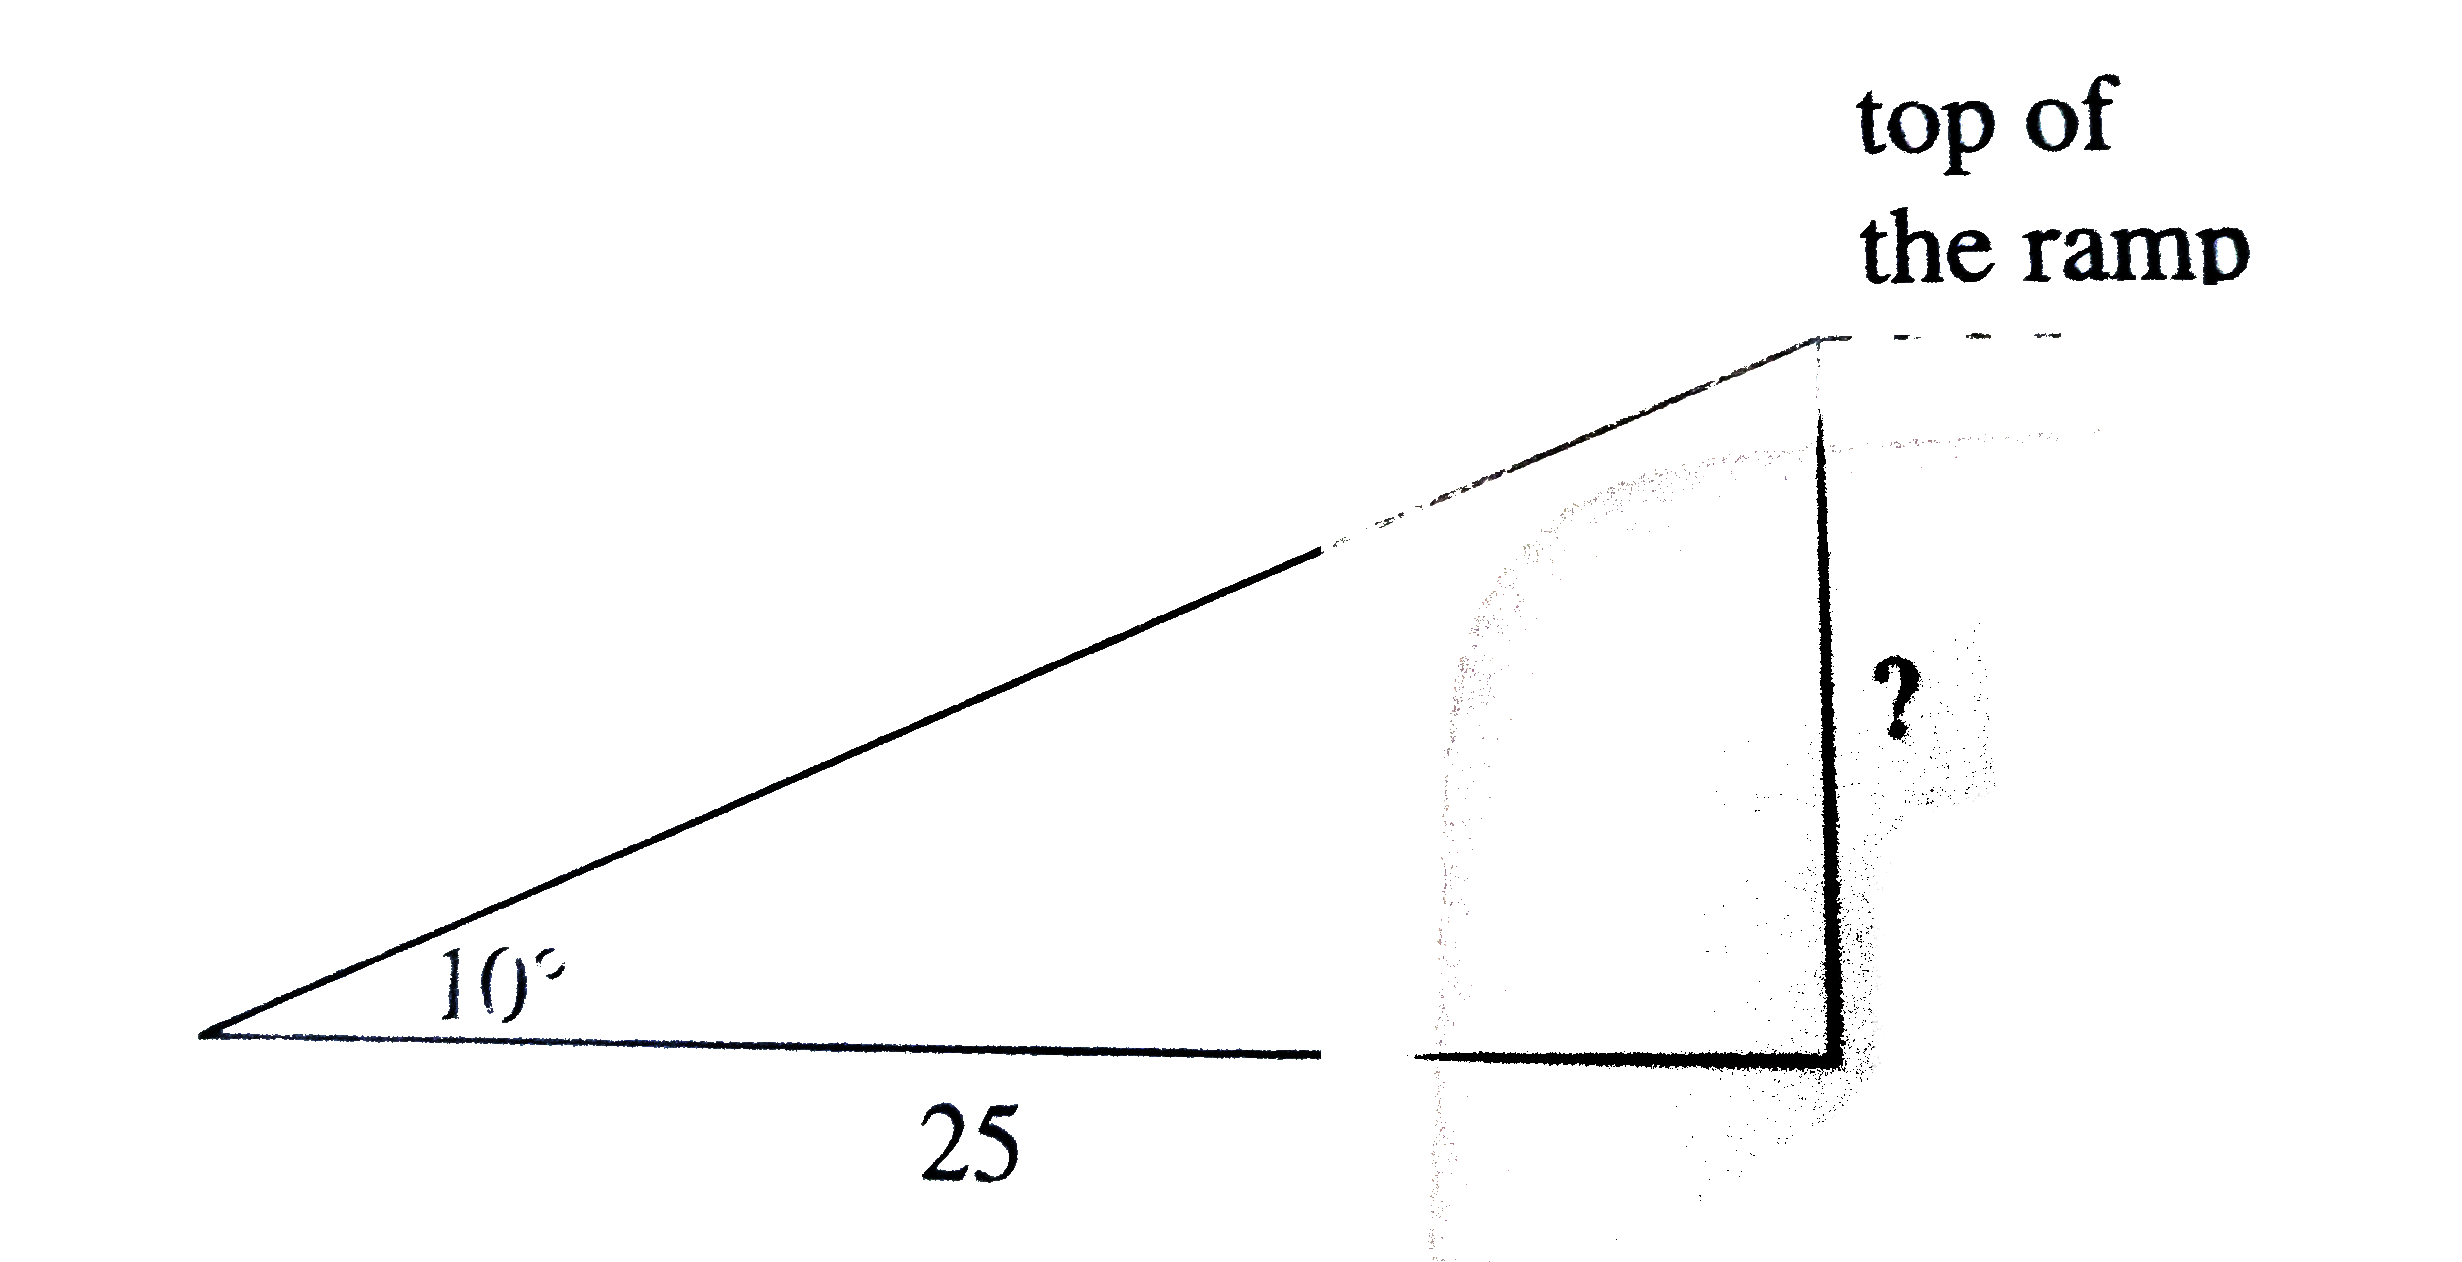
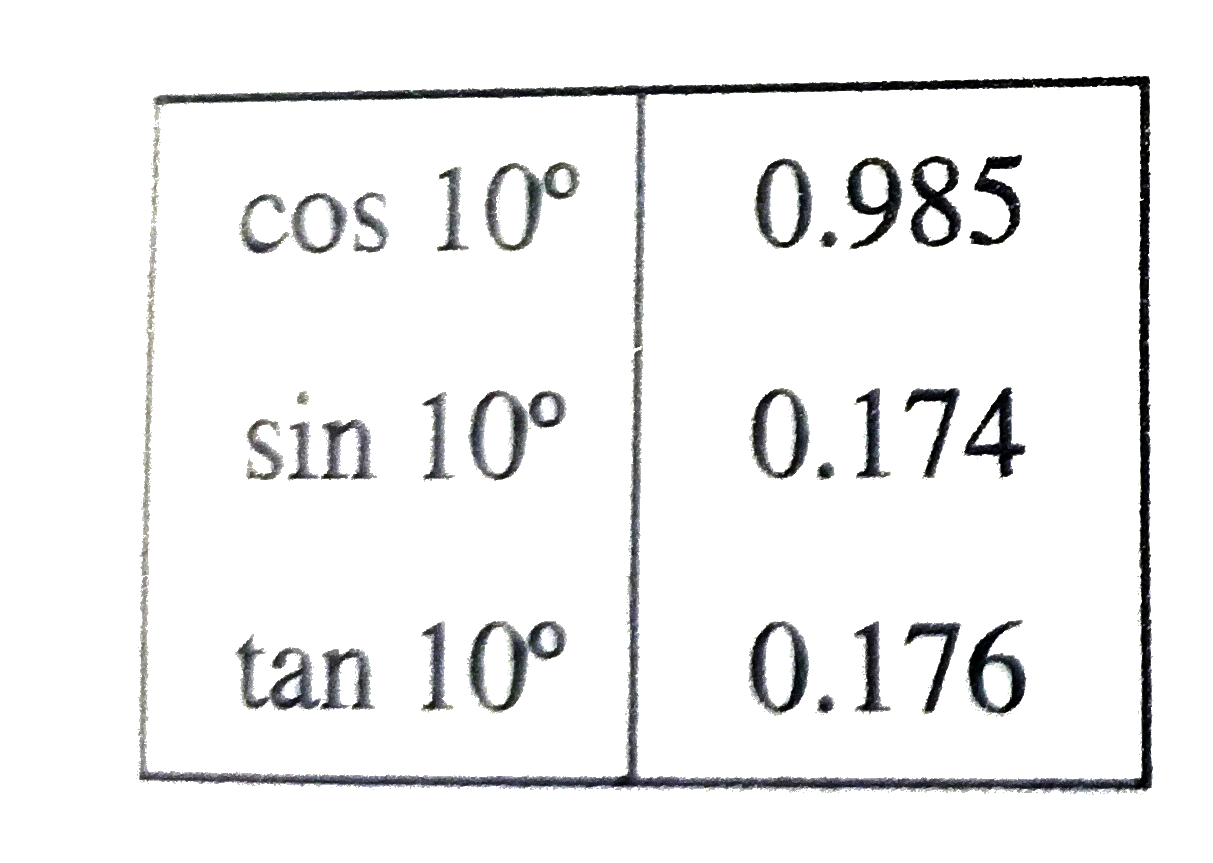
Given the trigonometric calculations in the table below, how high off the ground will a skateboarder be at the top of the ramp , rounded to the nearest 0.1 foot ?
View Solution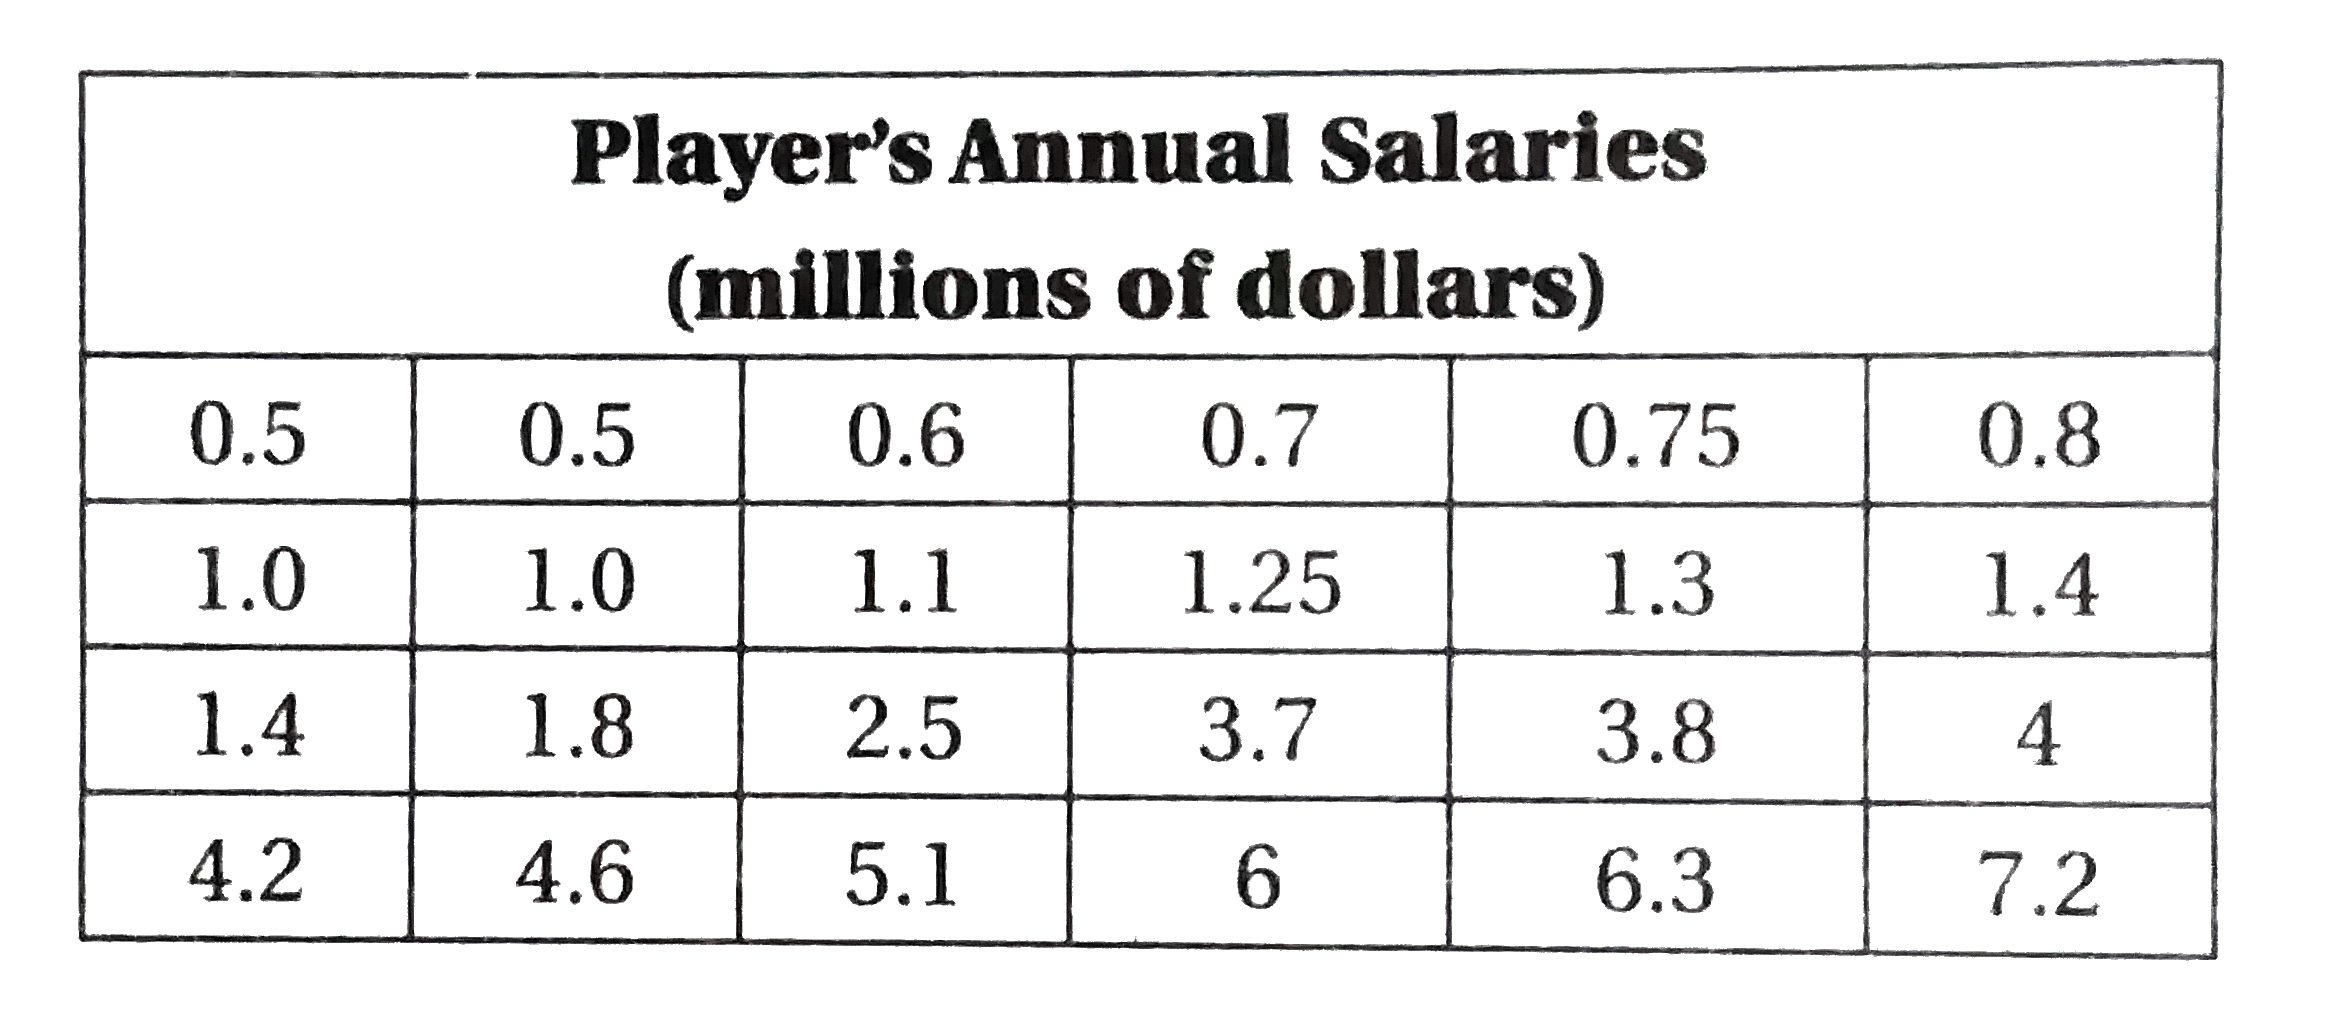
21-22 The table above shows the annual salaries for the 24 members of a professional sports team in terms of millions of dollars.
Q. If each player's salary is increased by10% which of the following statistics does not increase by 10%?
View Solution

 Find the median salary of the given data
