The graph of (y−x)against(y+x) is shown. fig which one of the following shows the graph of y against x? fig (b) fig (c) fig (d) fig
To solve the problem of determining the graph of y against x based on the graph of (y−x) against (y+x), we can follow these steps:
Step 1: Understand the given relationship
We have the graph of (y−x) plotted against (y+x). Let's denote:
- u=y−x
- v=y+x
Step 2: Express y in terms of x
From the equations for u and v, we can express y and x in terms of u and v:
1. From u=y−x, we can express y as:
y=u+x
2. From v=y+x, we can express y as:
y=v−x
Step 3: Set the two expressions for y equal
Since both expressions represent y, we can set them equal to each other:
u+x=v−x
Step 4: Rearrange the equation
Rearranging gives us:
u+x+x=v
u+2x=v
Thus, we can express x in terms of u and v:
2x=v−u
x=v−u2
Step 5: Substitute back to find y
Now substituting x back into the expression for y:
y=u+v−u2
This simplifies to:
y=2u+v−u2=u+v2
Step 6: Identify the graph of y against x
Now we have y expressed in terms of u and v. Since u=y−x and v=y+x, we can analyze how the graph of y against x would look based on the slopes and intercepts derived from the original graph.
Conclusion
The graph of y against x will be a linear function, and based on the slope derived from the original graph, we can select the appropriate figure (b, c, or d) that represents this relationship.
We have the graph of (y−x) plotted against (y+x). Let's denote:
- u=y−x
- v=y+x
From the equations for u and v, we can express y and x in terms of u and v:
1. From u=y−x, we can express y as:
y=u+x
2. From v=y+x, we can express y as:
y=v−x
Since both expressions represent y, we can set them equal to each other:
u+x=v−x
Rearranging gives us:
u+x+x=v
u+2x=v
Thus, we can express x in terms of u and v:
2x=v−u
x=v−u2
Now substituting x back into the expression for y:
y=u+v−u2
This simplifies to:
y=2u+v−u2=u+v2
Now we have y expressed in terms of u and v. Since u=y−x and v=y+x, we can analyze how the graph of y against x would look based on the slopes and intercepts derived from the original graph.
The graph of y against x will be a linear function, and based on the slope derived from the original graph, we can select the appropriate figure (b, c, or d) that represents this relationship.
Similar Questions
The equation of a tangent to the parabola y2=8xisy=x+2 . The point on this line from which the other tangent to the parabola is perpendicular to the given tangent is (1) (−1,1) (2) (0,2) (3) (2,4) (4) (−2,0)
View SolutionThe graph of y=|f(x)| is as shown in the following figure Fig Graph of y=f(x) may be a, b, c d is fig
View Solution
Knowledge Check
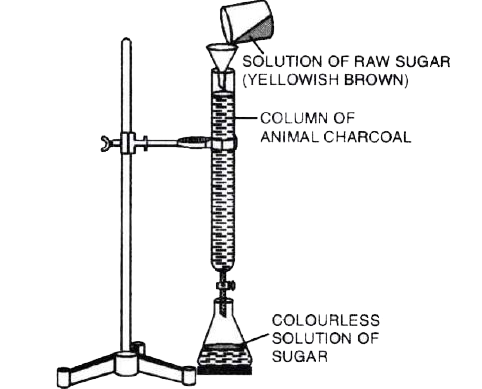
Which of the following phenomenon is applicable to the process shown in the Fig. ?
 AAbsorptionBAdsorptionCCoagulationDEmulsification
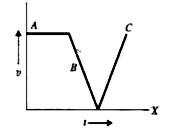
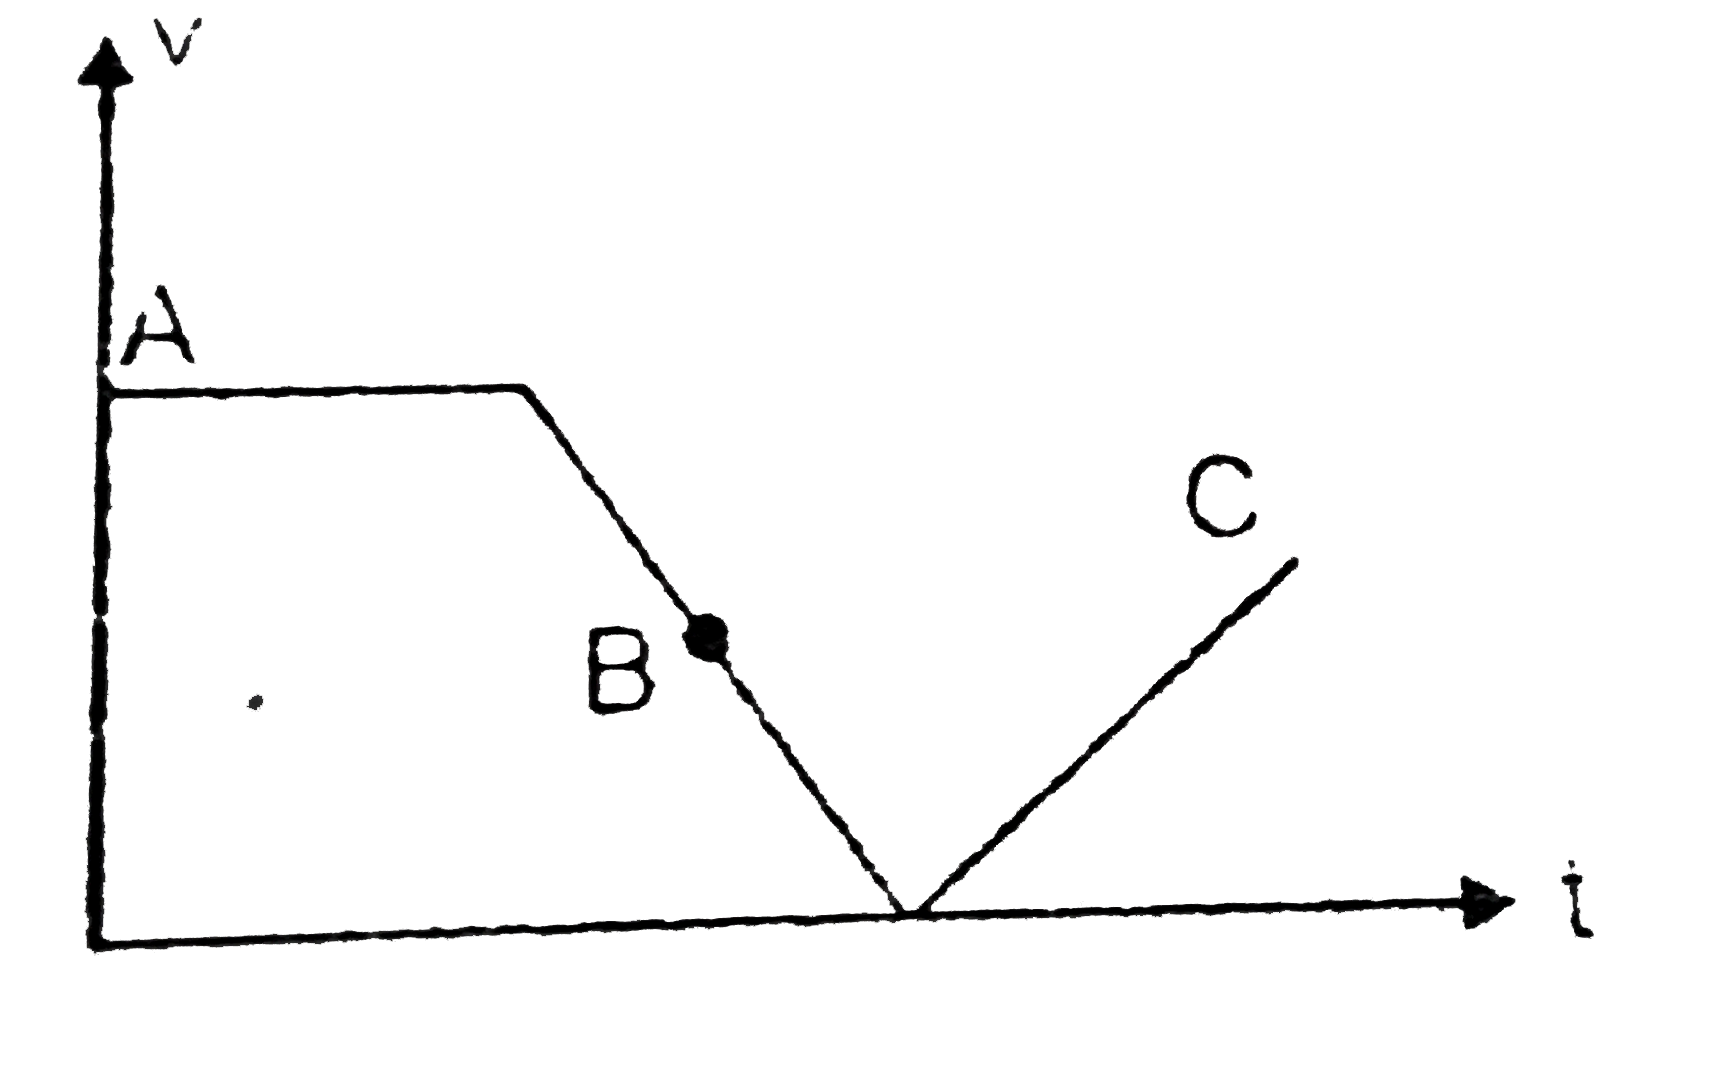
The velocity time graph of a body is shown in fig. 3.3. it implies that at point B
 Athe force is zeroBthere is a force towards motionCthere is force which oppose motionDnone of the above
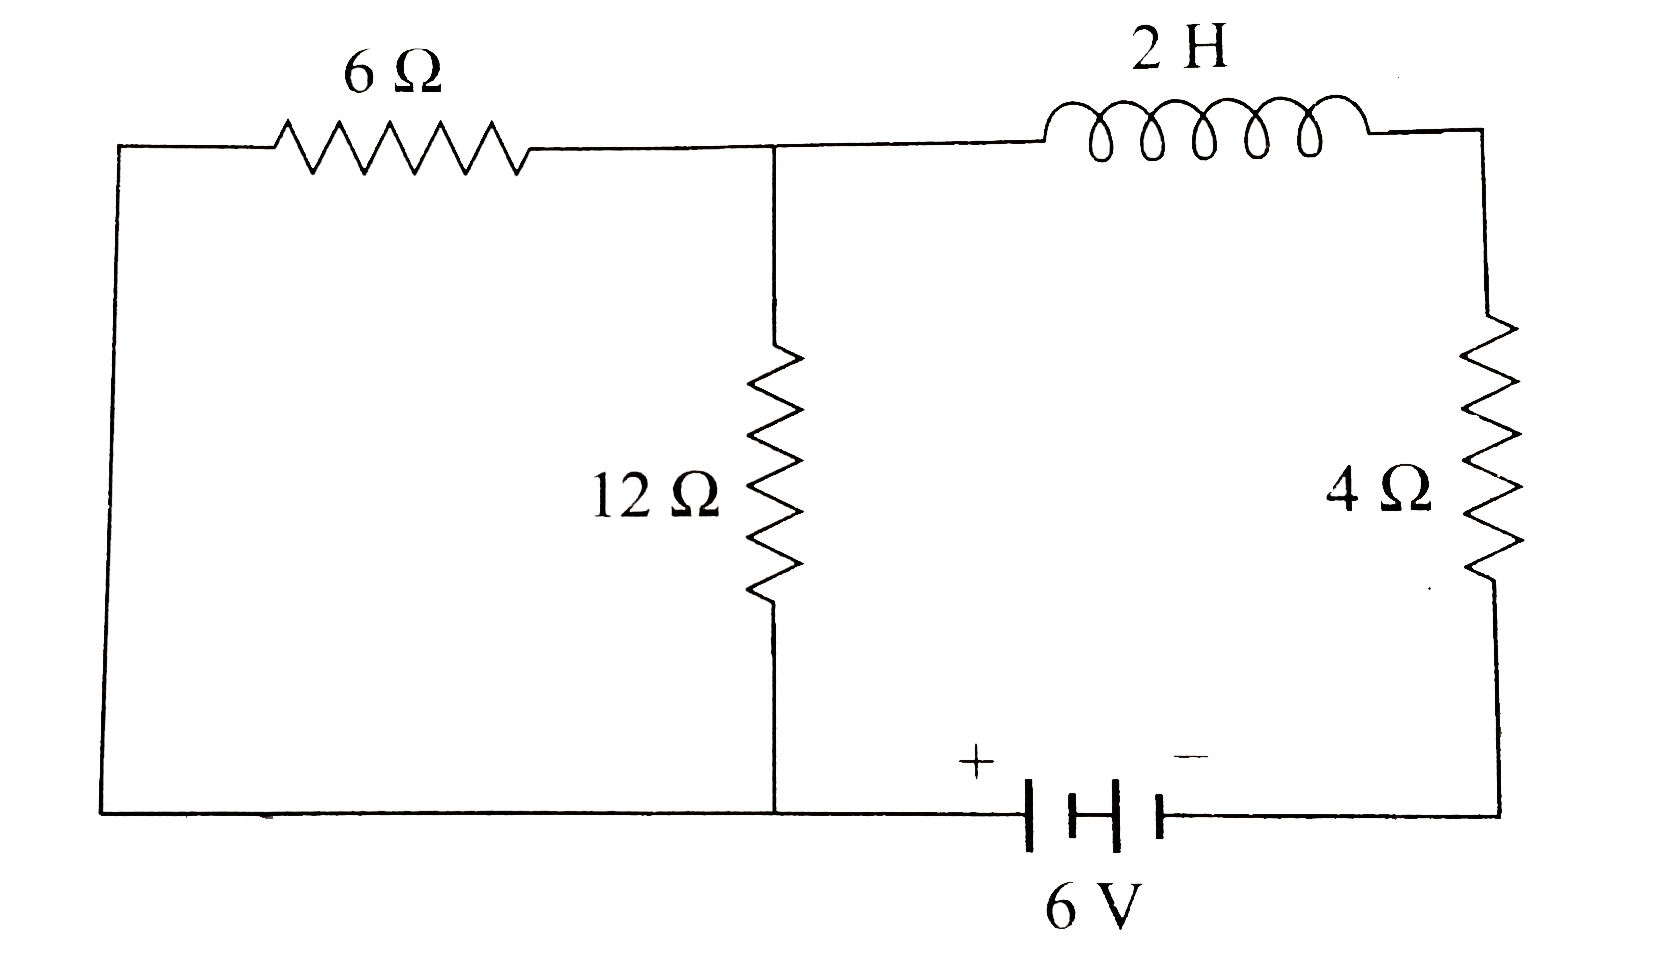
For the circuit shown in Fig. Which of the following statements are correct?

View SolutionThe velocity time graph of a body is shown in fig. it indicates that :

View SolutionThe speed-time graph of a particle moving along a fixed direction is shown in Fig. Then which of the following is wrong?

View SolutionIf fig shows the graph of f(x)=ax2+bx+c,then Fig a. c<0 b. bc>0 c. ab>0 d. abc<0
View SolutionIn Fig.94, if ∠AOC is a straight line, then the value of x is (a) 15 (b) 18 (c) 20 (d) 16
View SolutionThe graph of a polynomial f(x) is as shown in Fig. 2.21. Write the number of real zeros of f(x) . (FIGURE)
View Solution
