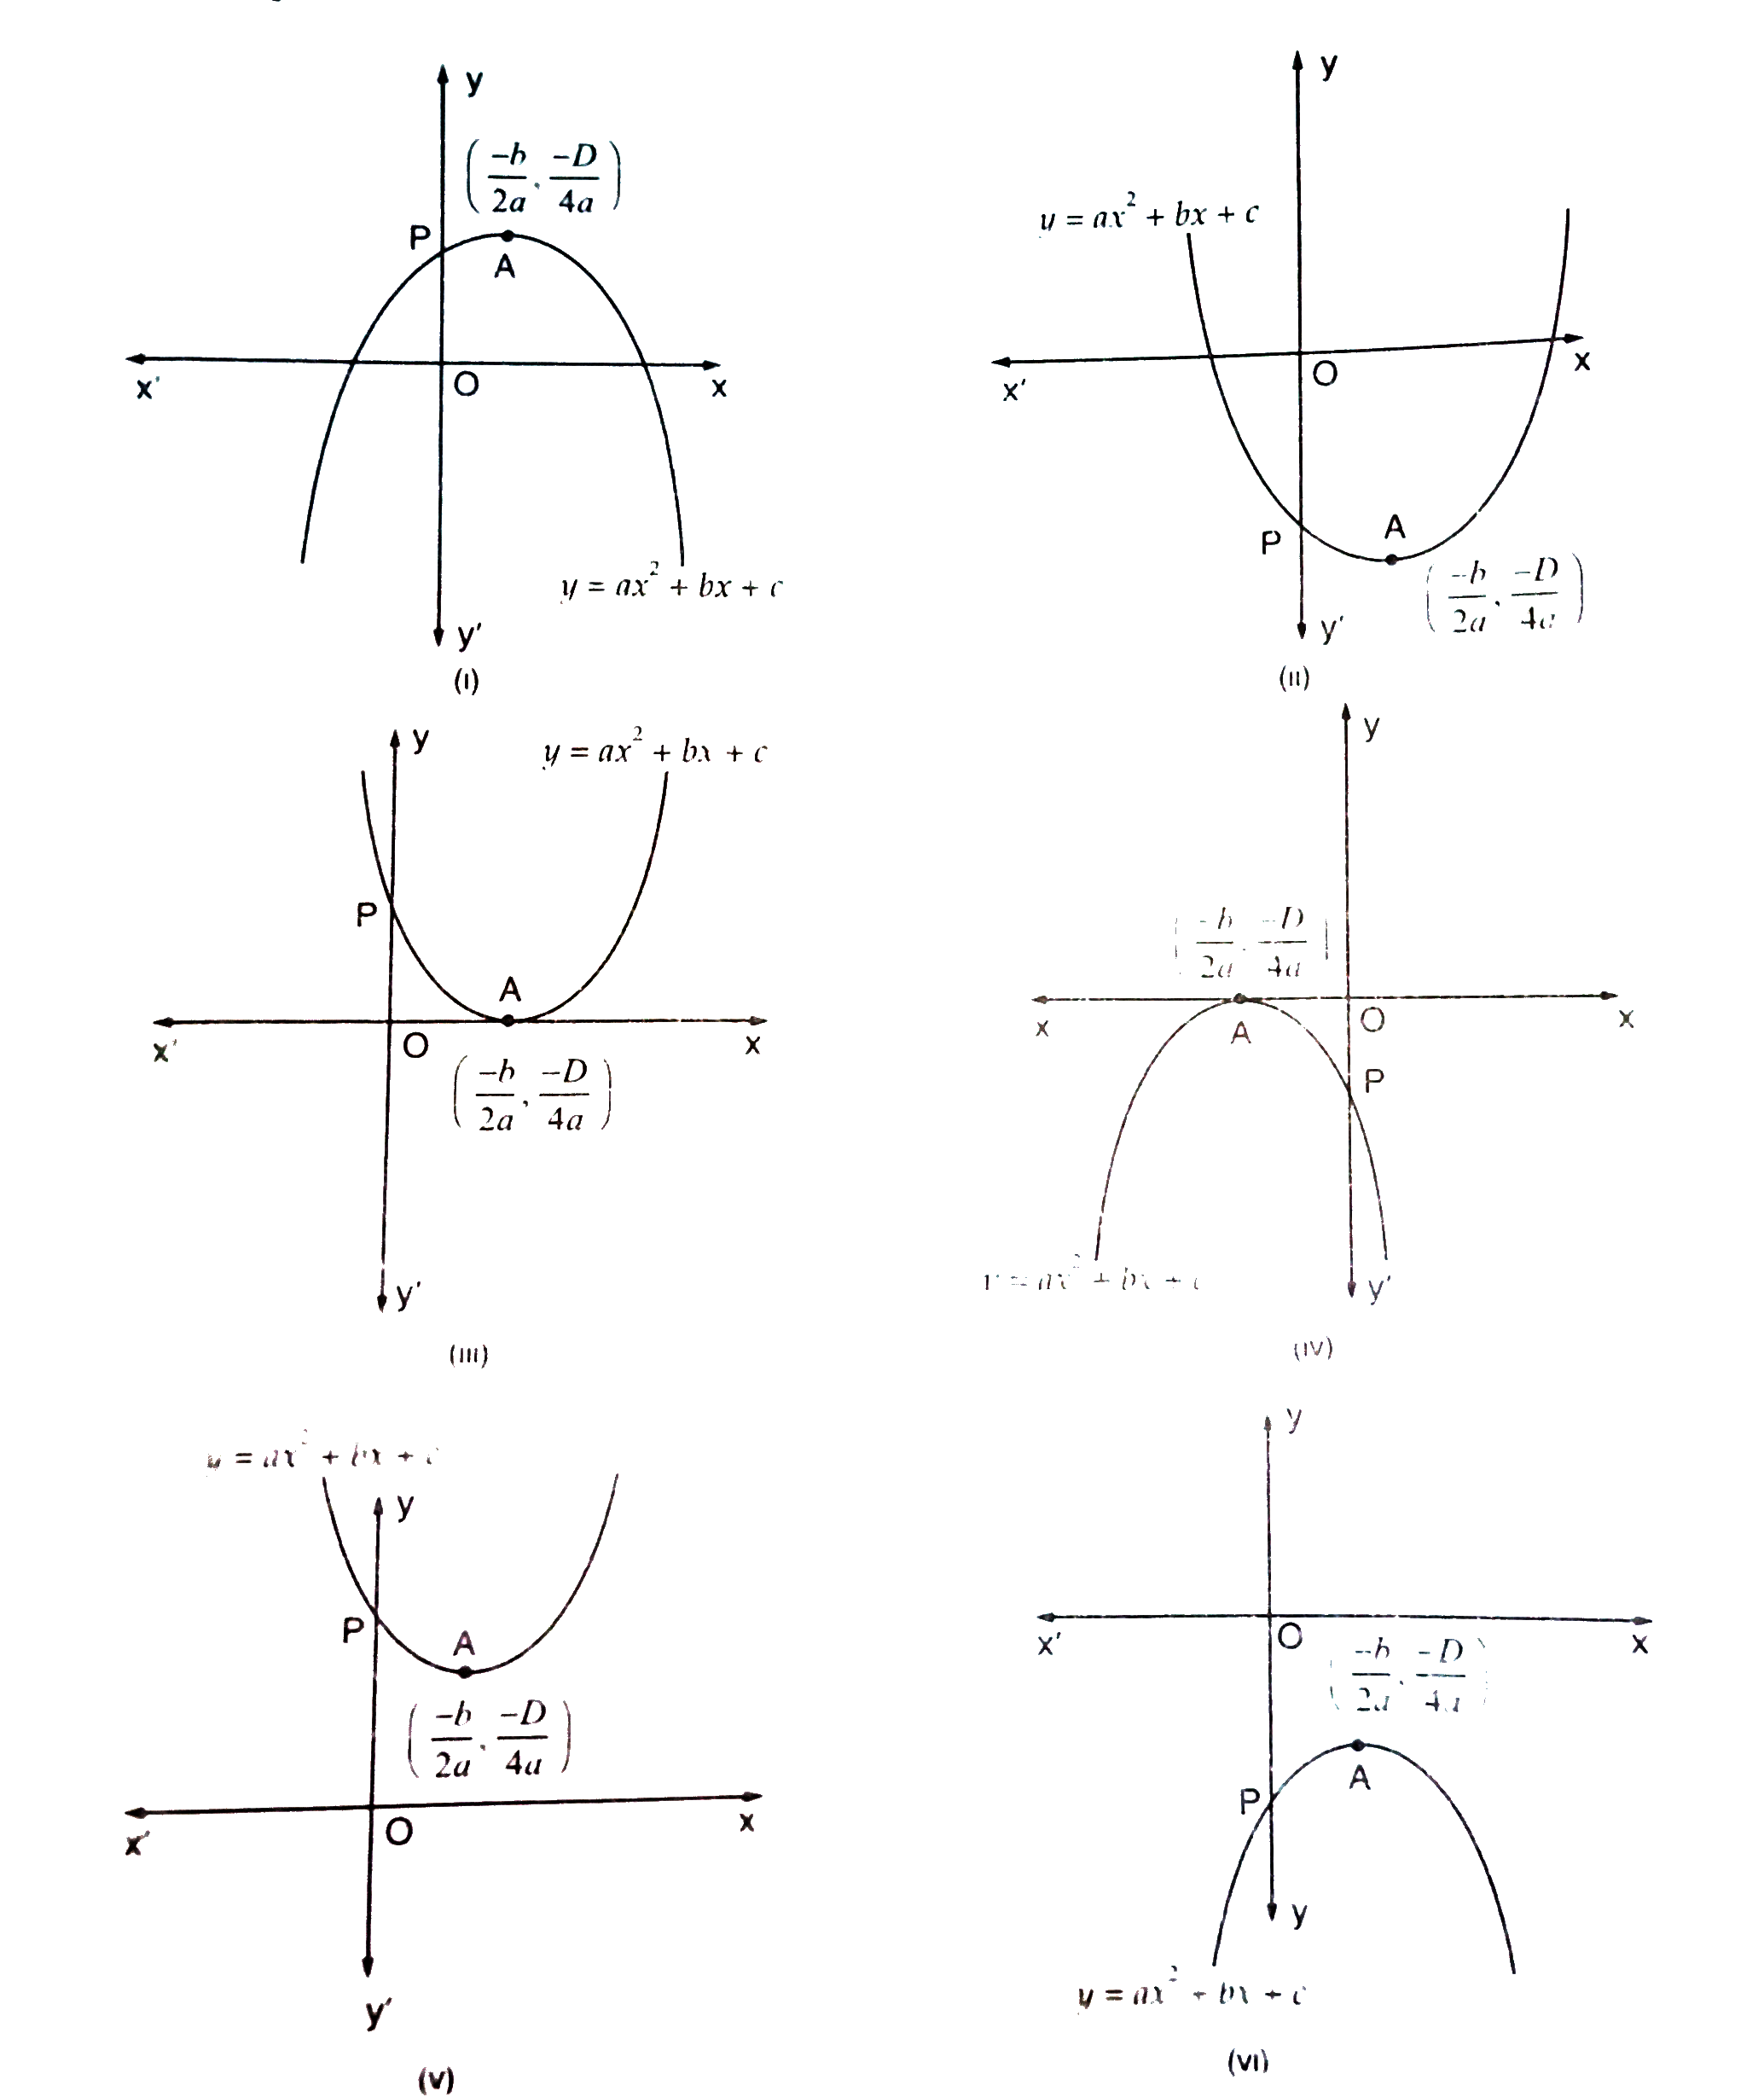
If fig shows the graph of f(x)=ax2+bx+c,then Fig a. c<0 b. bc>0 c. ab>0 d. abc<0
To solve the problem regarding the graph of the quadratic function f(x)=ax2+bx+c, we need to analyze the characteristics of the graph based on the given options.
1. Understanding the Graph:
The graph of the function is a parabola. The orientation (upward or downward) of the parabola is determined by the coefficient a. If a>0, the parabola opens upwards; if a<0, it opens downwards.
2. Identifying the Vertex and Intercepts:
From the graph, we can observe that the vertex of the parabola is above the x-axis, indicating that the function takes positive values at its maximum point. The y-intercept occurs at f(0)=c.
3. Analyzing the y-intercept:
Since the graph shows that the parabola is above the x-axis at the y-intercept, we conclude that c>0.
4. Determining the Sign of a:
The graph is concave downwards, which means that a<0.
5. Analyzing the Product bc:
Since b is the x-coordinate of the vertex and the graph is concave down, the vertex lies to the right of the y-axis, indicating that b<0. Therefore, since b<0 and c>0, we can conclude that bc<0.
6. Analyzing the Product ab:
We have a<0 and b<0. Thus, the product ab>0.
7. Analyzing the Product abc:
We have a<0, b<0, and c>0. Therefore, the product abc<0.
Conclusion:
Based on the analysis, we can summarize the findings:
- c>0
- bc<0
- ab>0
- abc<0
From the options given:
- a. c<0 - False
- b. bc>0 - False
- c. ab>0 - True
- d. abc<0 - True
Thus, the correct options are c and d.
The graph of the function is a parabola. The orientation (upward or downward) of the parabola is determined by the coefficient a. If a>0, the parabola opens upwards; if a<0, it opens downwards.
From the graph, we can observe that the vertex of the parabola is above the x-axis, indicating that the function takes positive values at its maximum point. The y-intercept occurs at f(0)=c.
Since the graph shows that the parabola is above the x-axis at the y-intercept, we conclude that c>0.
The graph is concave downwards, which means that a<0.
Since b is the x-coordinate of the vertex and the graph is concave down, the vertex lies to the right of the y-axis, indicating that b<0. Therefore, since b<0 and c>0, we can conclude that bc<0.
We have a<0 and b<0. Thus, the product ab>0.
We have a<0, b<0, and c>0. Therefore, the product abc<0.
Based on the analysis, we can summarize the findings:
- c>0
- bc<0
- ab>0
- abc<0
- a. c<0 - False
- b. bc>0 - False
- c. ab>0 - True
- d. abc<0 - True
Topper's Solved these Questions
Similar Questions
If fig shows the graph of f(x)=ax2+bx+c,then Fig a. c<0 b. bc>0 c. ab>0 d. abc<0
View SolutionFigure 2.23 show the graph of the polynomial f(x) = ax² + bx + c for which (a) a < 0, b > 0 and c > 0 (b) a < 0, b < 0 and c > 0 (c) a < 0, b < 0 and c < 0 (d) a > 0, b > 0 and c < 0
View SolutionLet f(x)=ax2+bx+⋅ Consider the following diagram. Then Fig c<0 b>0 a+b−c>0 abc<0
View SolutionFigure 2.23 shows the graph of the polynomial f(x)=ax2+bx+c for which (FIGURE) (a) a⟨0, b⟩0 and c>0 (b) a<0,b<0andc>0 (c) a<0, b<0 and c<0 (d) a>0, b>0 and c<0
View SolutionThe graph of the polynomial f(x)=ax2+bx+c is as shown in Fig. 2.20. Write the value of b2−4ac and the number of real zeros of f(x) . (FIGURE)
View SolutionThe graphs of y=ax2+bx+c are given in Fig. Identify the signs of a, b and c in each of the following: (FIGURE)

View SolutionIf (x2+px+1) is a factor of (ax3+bx+c),then a2+c2=−ab b. a2−c2=−ab c. a2−c2=ab d. none of these
View SolutionThe graph of the polynomial f(x)=ax2+bx+c is as shown below (Fig. 2.19). Write the signs of 'a' and b2−4ac . FIGURE
View SolutionThe graph of (y−x)against(y+x) is shown. fig which one of the following shows the graph of y against x? fig (b) fig (c) fig (d) fig
View SolutionThe value of (lim)x→π/2(secx−tanx) is a. 1 b . 0 c. 2 d. -1
View Solution
