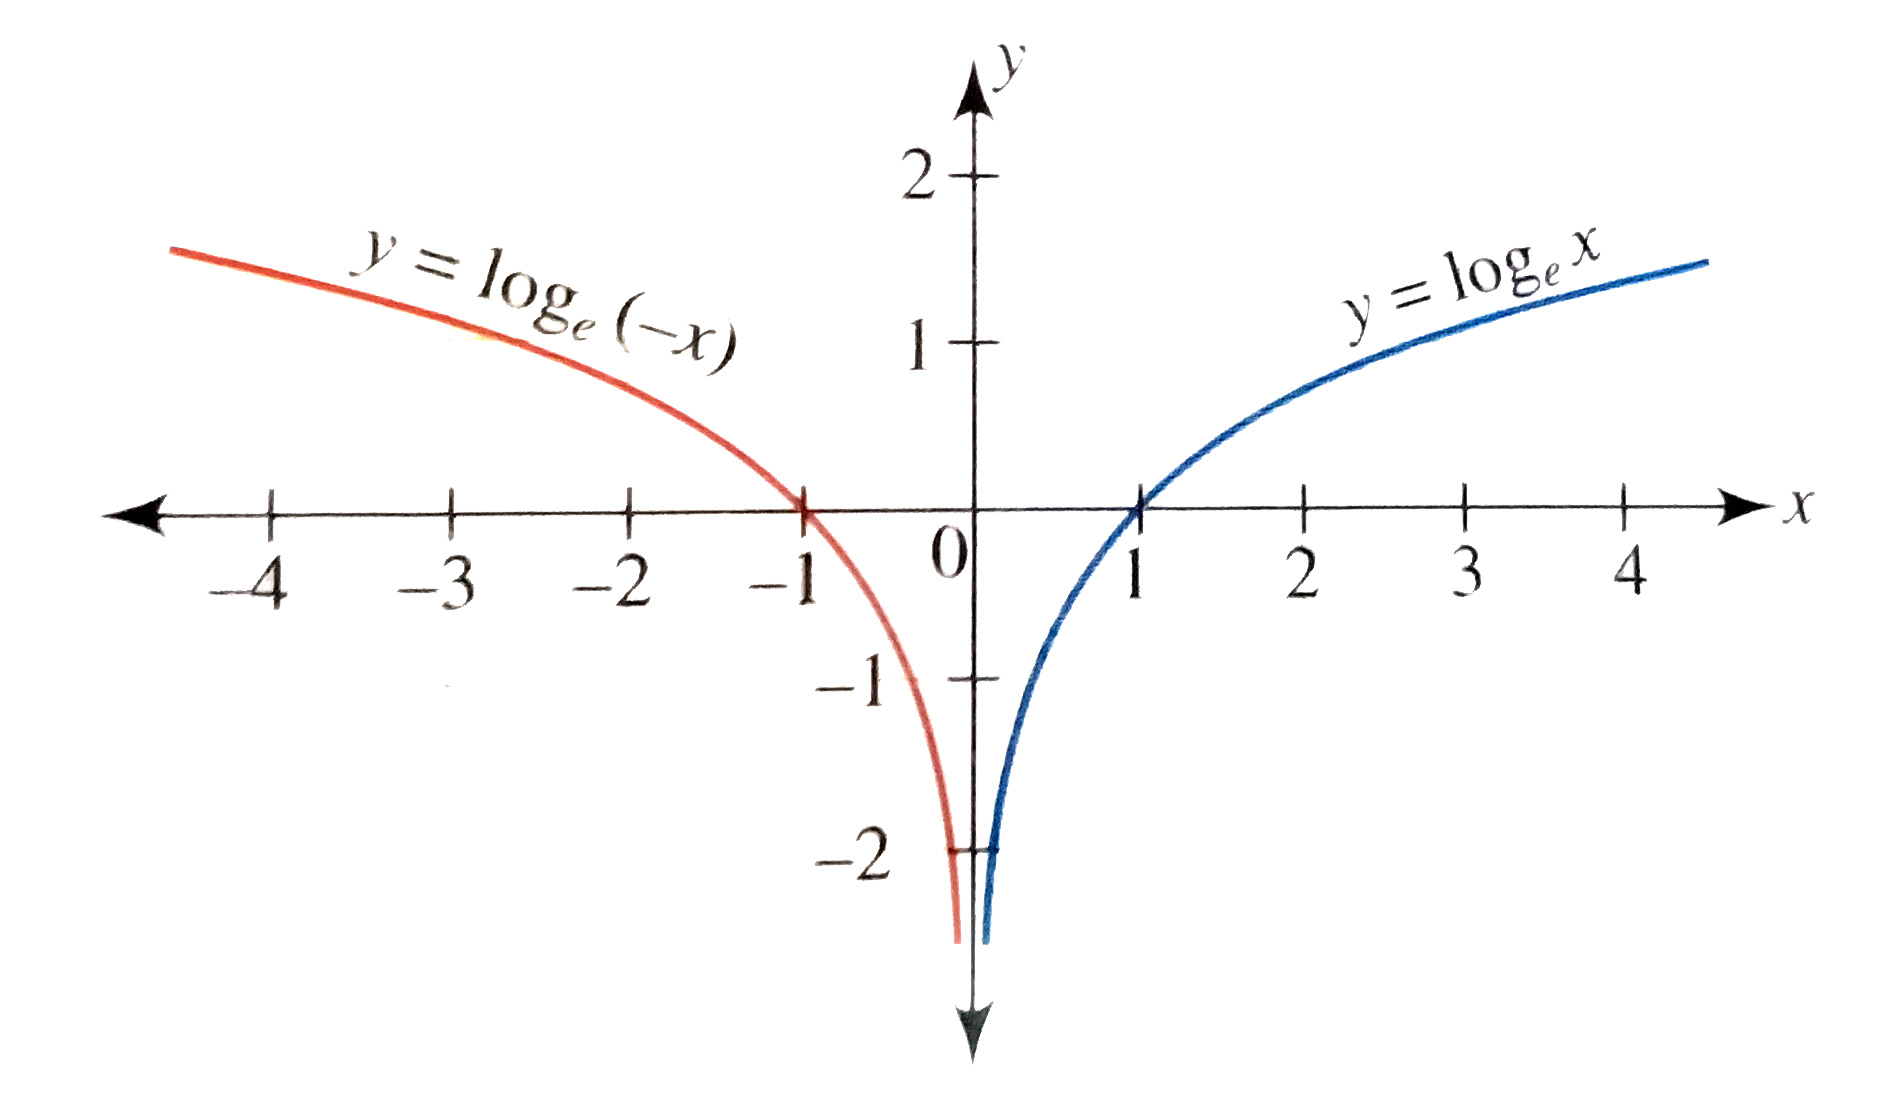
Plot the curve y=(log)e(−x).
Video Solution
Text Solution
To draw the graph of y=loge(−x), flip the graph of y=logex over the y-axis shown in the following figure.

|
Updated on:21/07/2023
Topper's Solved these Questions
Similar Questions
Find the equation of a normal to the curve y=x(logex) which is parallel to the line 2x−2y+3=0 .
View SolutionSketch the curve |y|=(x−1)(x−2).
View SolutionSketch the curve |y|=(x−1)(x−2).
View SolutionSketch the curve |y|=(x−1)(x−2).
View SolutionDraw the curve y=ex
View SolutionThe area bounded by the curves y=(log)exandy=((log)ex)2 is
View SolutionCompute the area of the region bounded by the curves y=ex(log)exandy=logxex
View SolutionSketch the curve y=log|x|
View SolutionSketch the curve y=log|x|
View SolutionThe area enclosed between the curve y=loge(x+e) and the coordinate axes is
View Solution

