From the graph of , draw the graph of .
Video Solution
Text Solution
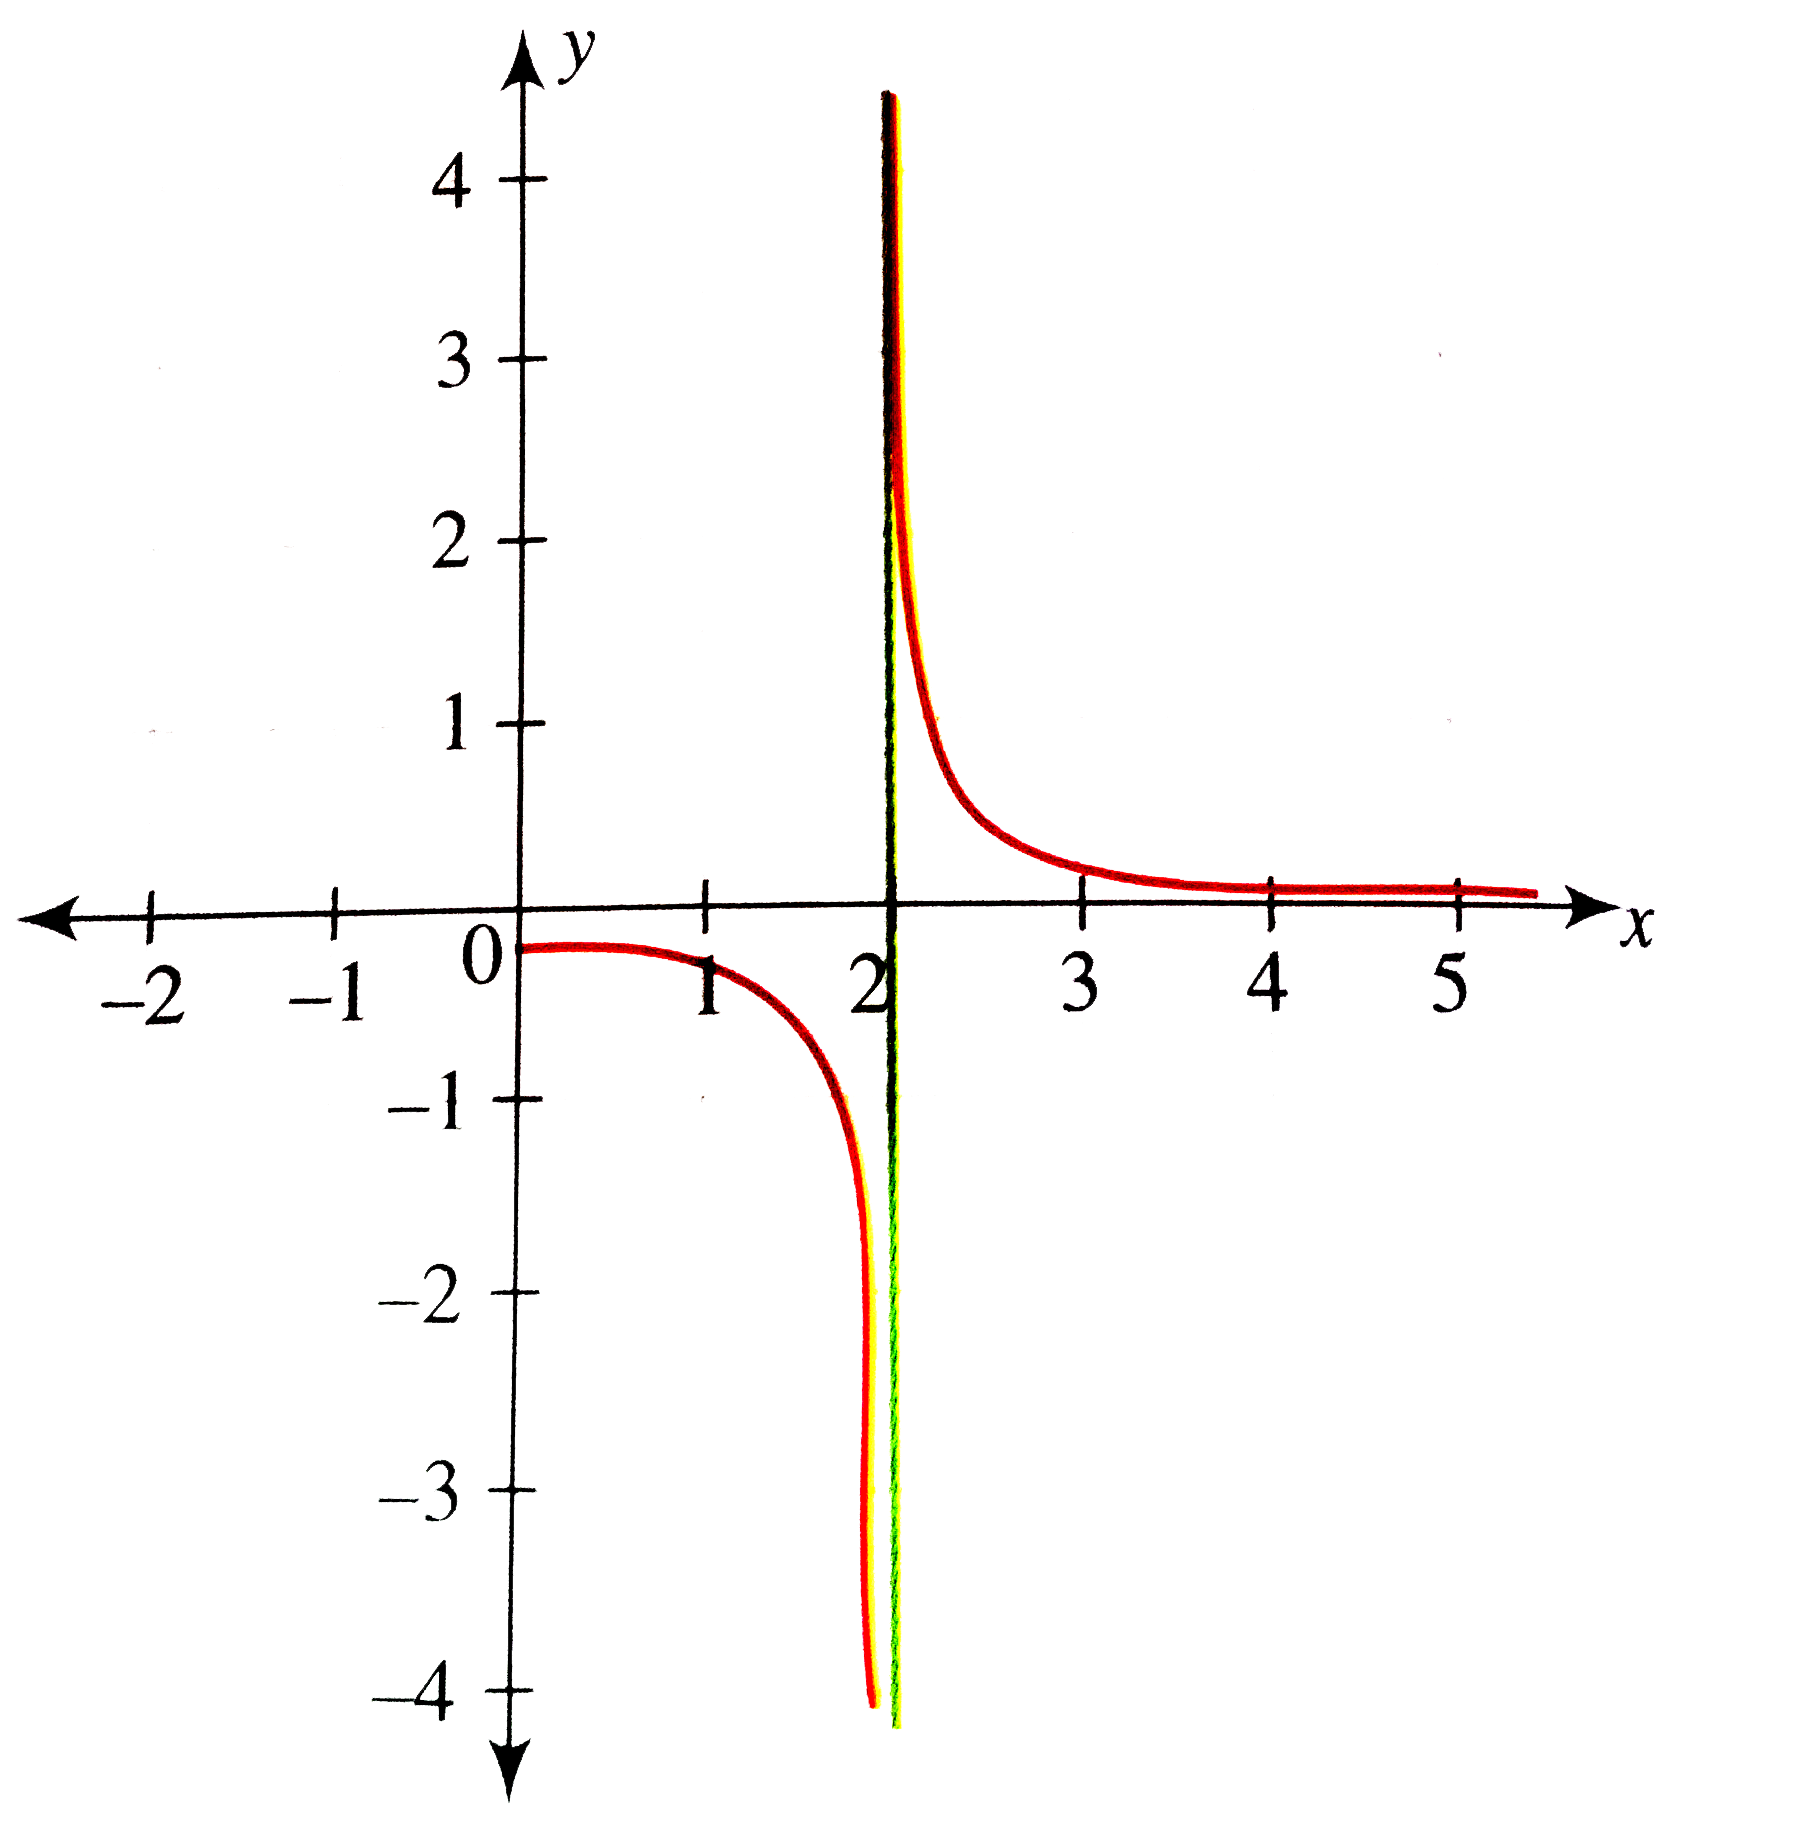
is an upward parabola having vertex at (0, -4).

Since the function is even, let us draw the graph of for .
For increases from -4 to 0.
So decreases from -1/4 to .
For increases from 0 to .
So decreases from to 0.
So the graph of for is as shown in the following figure.

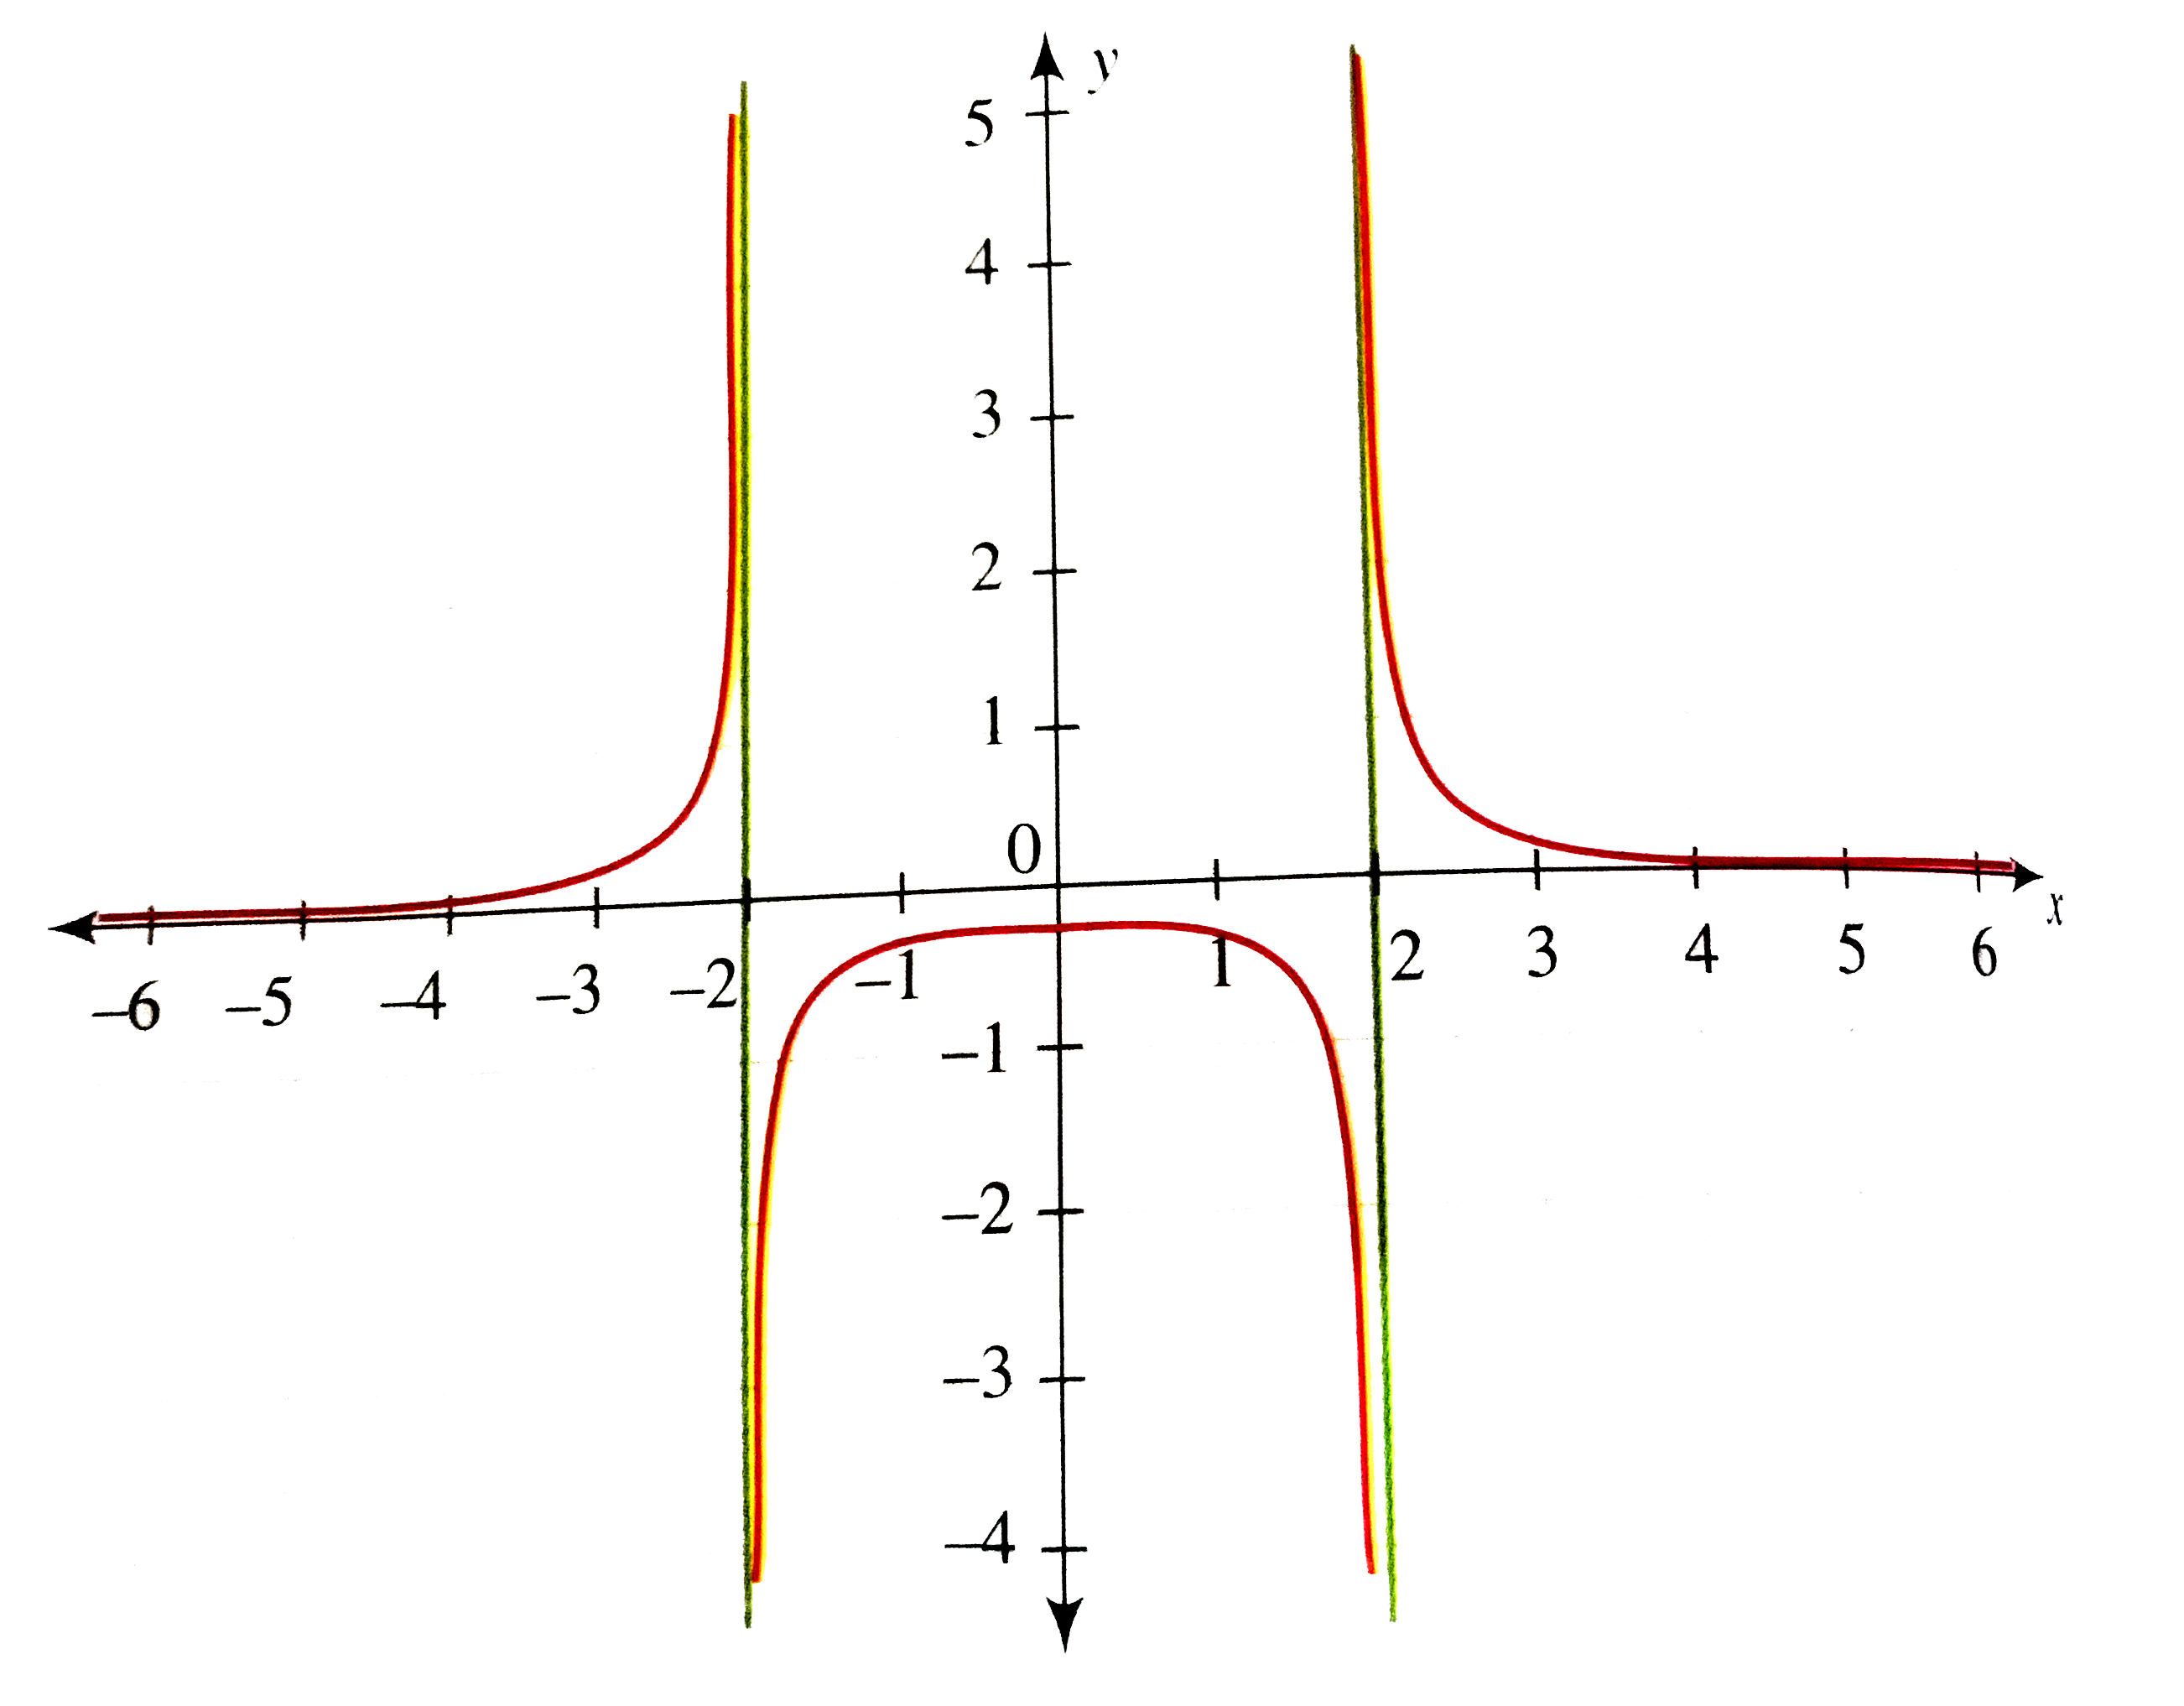
Since is an even function, the graph for R-{-2,2} can be drawn as shown in the following figure.

|
Topper's Solved these Questions
- GRAPHS OF POLYNOMIAL AND RATIONAL FUNCTIONSBOOK - CENGAGE ENGLISHCHAPTER - GRAPHS OF POLYNOMIAL AND RATIONAL FUNCTIONSEXERCISE - Exercises
17 Videos
- GRAPHICAL TRANSFORMATIONSBOOK - CENGAGE ENGLISHCHAPTER - GRAPHICAL TRANSFORMATIONSEXERCISE - ILLUSTRATION
78 Videos
- GRAPHS OF ELEMENTARY FUNCTIONS BOOK - CENGAGE ENGLISHCHAPTER - GRAPHS OF ELEMENTARY FUNCTIONS EXERCISE - EXERCISES
34 Videos
Similar Questions
Draw the graph of y=(x−1)(x2−x+1).
View SolutionDraw the graph of y=x+1x
View SolutionDraw the graph of y=sin−1(x2)
View SolutionDraw the graph of y=2x−1
View SolutionDraw the graph of y=2x.
View SolutionDraw the graph of y=|x|
View SolutionDraw th graph of y=−2x
View SolutionDraw graph of y=1x2−x.
View SolutionDraw the graph of y=∣∣∣1|x|−2∣∣∣.
View SolutionDraw the graph of y=x−1x−2.
View Solution
