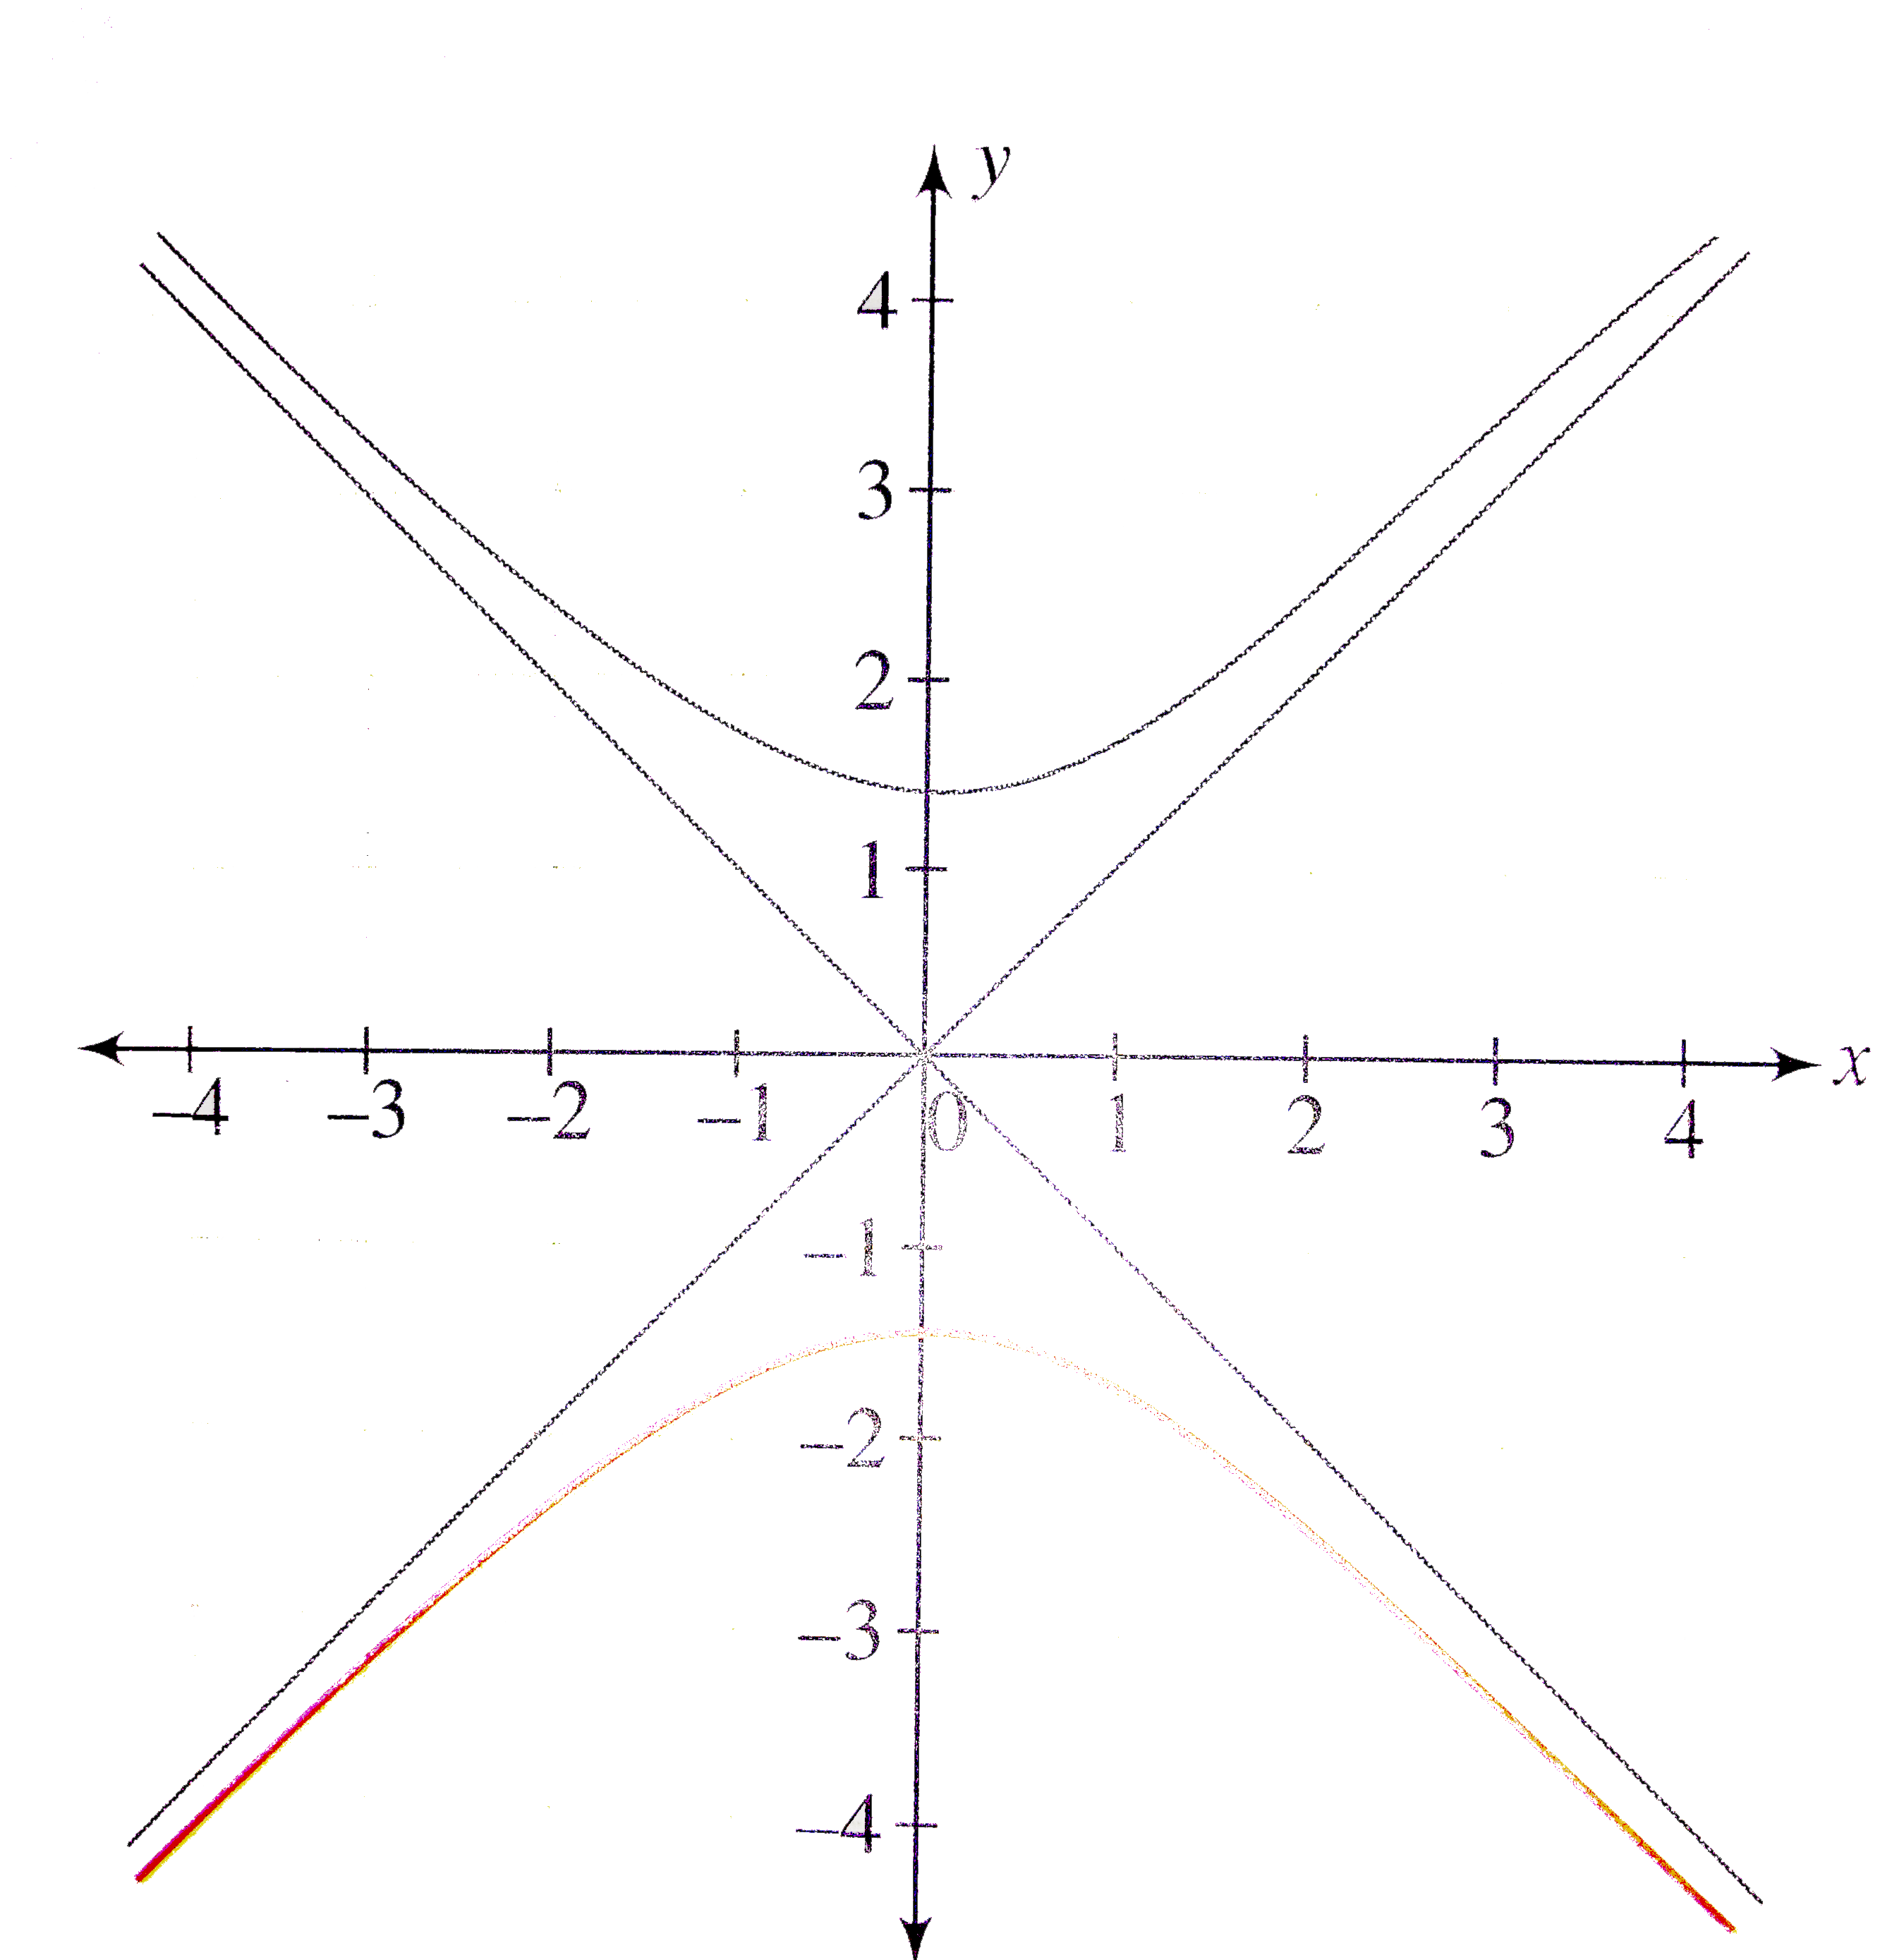
Draw the graph of y=−√x2+2
Video Solution
Text Solution
We have y=−√x2+2
or y2=x2+2
or x2−y2=−2, which is a rectangular hyperbola.
But y=−√x2+2≤0
So the graph of y=f(x) is part of the hyperbola x2−y2=−2, which lies below the x-axis.

|
Updated on:21/07/2023
Topper's Solved these Questions
- BOOK - CENGAGE ENGLISHCHAPTER - GRAPHS OF ELEMENTARY FUNCTIONS EXERCISE - EXERCISES34videos
GRAPHS OF ELEMENTARY FUNCTIONS
- BOOK - CENGAGE ENGLISHCHAPTER - GRAPHS OF POLYNOMIAL AND RATIONAL FUNCTIONSEXERCISE - Exercises17videos
GRAPHS OF POLYNOMIAL AND RATIONAL FUNCTIONS
- BOOK - CENGAGE ENGLISHCHAPTER - GRAPHS OF TRIGONOMETRIC FUNCTIONSEXERCISE - Exercises22videos
GRAPHS OF TRIGONOMETRIC FUNCTIONS
Similar Questions
Draw the graph of y=√x2−1
View SolutionDraw the graph of y=−√6−3x2
View SolutionDraw the graph of y=2x−1
View SolutionDraw the graph of y=2x.
View SolutionDraw the graph of y=|x|
View SolutionDraw the graph of y=√1+x2−x
View SolutionDraw th graph of y=−2x
View SolutionDraw the graph of y=√xx−1
View SolutionDraw the graph of y=(√x2+1−√x2−1)
View SolutionDraw the graph of y=3√x2+1x−1
View Solution

