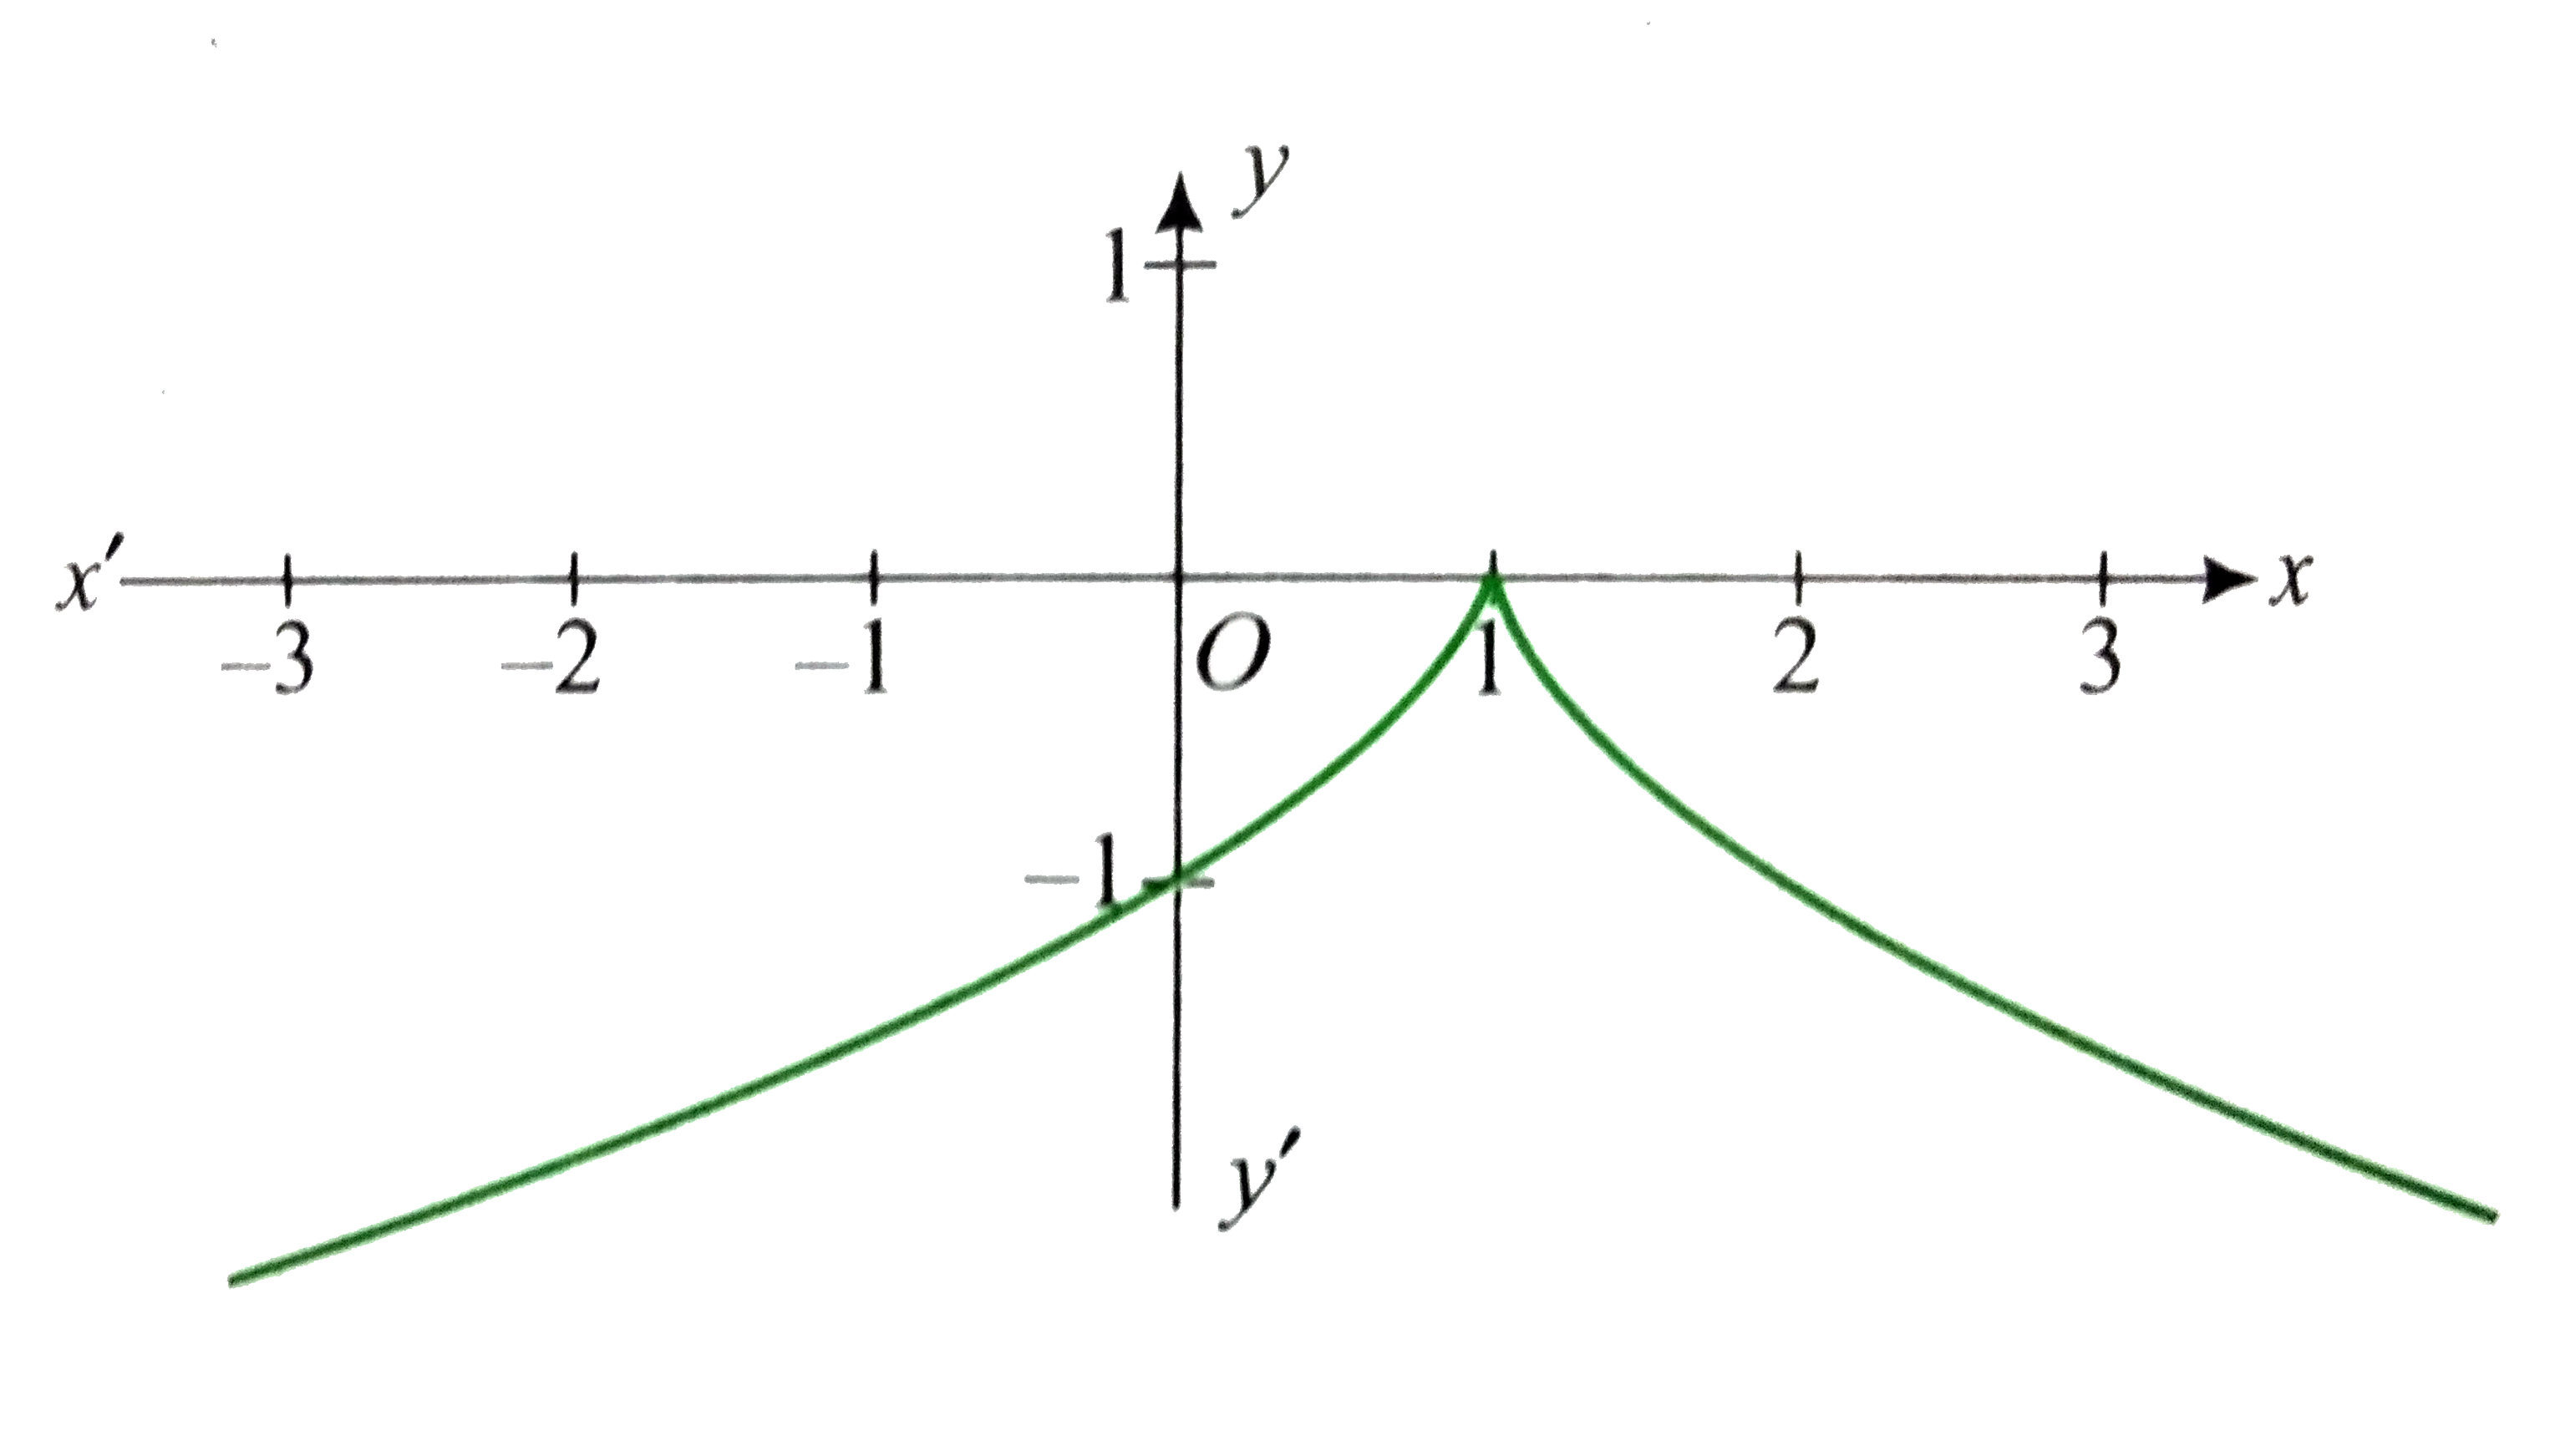
Draw the graph of the function: f(x)=−|x−1|12
Video Solution
Text Solution
|
Updated on:21/07/2023
Topper's Solved these Questions
- BOOK - CENGAGE ENGLISHCHAPTER - RELATIONS AND FUNCTIONSEXERCISE - Single Correct Answer Type125videos
RELATIONS AND FUNCTIONS
- BOOK - CENGAGE ENGLISHCHAPTER - RELATIONS AND FUNCTIONSEXERCISE - Multiple Correct Answer Type27videos
RELATIONS AND FUNCTIONS
- BOOK - CENGAGE ENGLISHCHAPTER - RELATIONS AND FUNCTIONSEXERCISE - CONCEPT APPLICATION EXERCISE 1.1413videos
RELATIONS AND FUNCTIONS
- BOOK - CENGAGE ENGLISHCHAPTER - PROPERTIES AND SOLUTIONS OF TRIANGLEEXERCISE - Archives (Numerical Value Type)3videos
PROPERTIES AND SOLUTIONS OF TRIANGLE
- BOOK - CENGAGE ENGLISHCHAPTER - SCALER TRIPLE PRODUCTS EXERCISE - DPP 2.311videos
SCALER TRIPLE PRODUCTS
Similar Questions
Draw the graph of the function f(x)=xx
View SolutionDraw the graph of the function f(x)=−x|x|.
View SolutionDraw the graph of the function: f(x)=log|x|
View SolutionDraw the graph of the function: f(x)=||x−2|−3|
View SolutionDraw the graph of the function: f(x)=||x−2|−3|
View SolutionDraw the graph of the function: |f(x)|=tanx
View SolutionDraw the graph of the function: |f(x)|=tanx
View SolutionDraw the graph of the function: f(x)=∣∣x2−3∣∣x|+2|
View SolutionDraw the graph of the function f(x)=x−∣∣x−x2∣∣,−1≤x≤1 and find the points of non-differentiability.
View SolutionDraw the graph of the function f(x)=x−∣∣x−x2∣∣,−1≤x≤1 and discuss the continuity or discontinuity of f in the interval −1≤x≤1
View Solution


