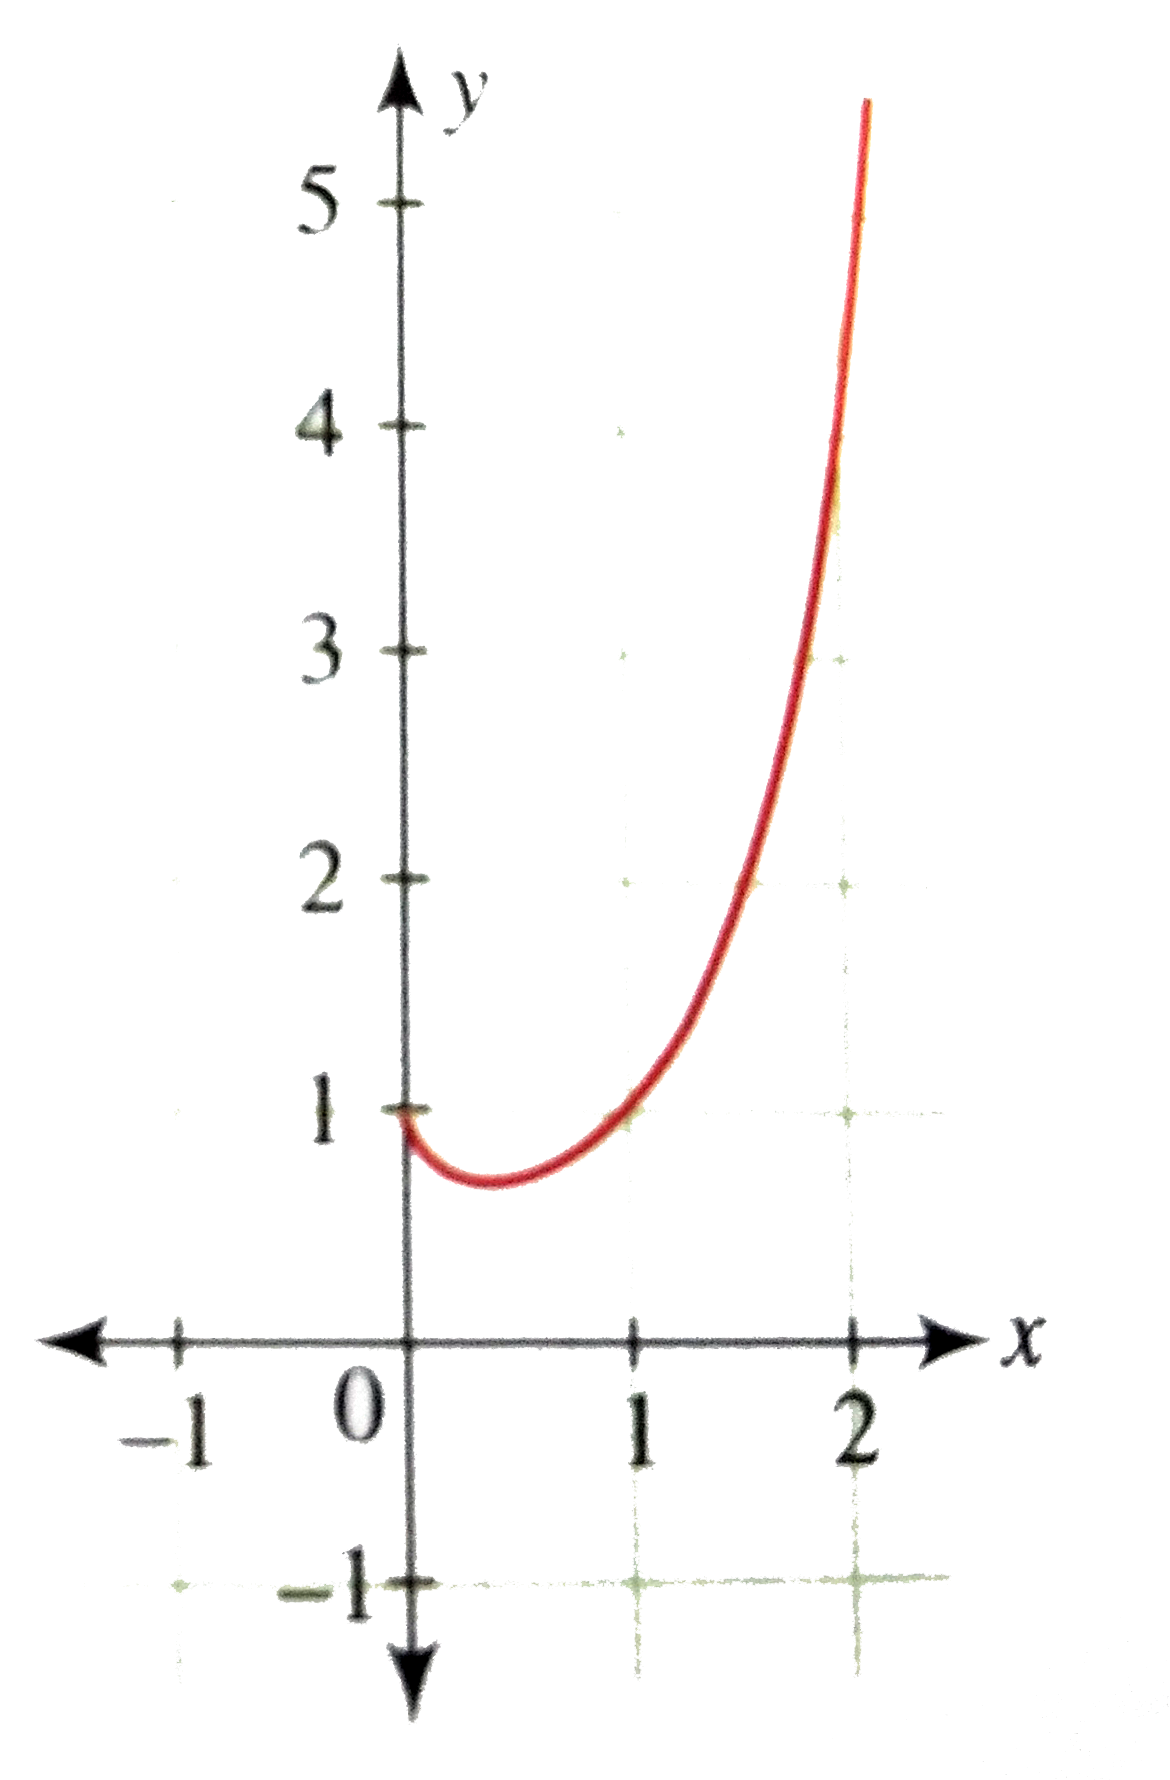
Draw the graph of the function f(x)=xx
Video Solution
Text Solution
We have f(x)=xx
Clearly, the domain of the function is x>0.
Differentiating we get, f′(x)=xx(1+logex)
Also for x<1e,f′(x)<0 and for x>1/e,f′(x)<0.
Thus, x=1/e is the point of minima.
f(1/e)=(1/e)(1/e)
Also, limx→0xx=elimx→0limxlogx=elimx→o1/x−1/x2=elimx→0(−x)=e0=1
and limx→∞xx=∞
From the above discussion, the graph of the function is as shown in the following figure.

|
Topper's Solved these Questions
Similar Questions
Draw the graph of the function f(x)=(1x)x
View SolutionDraw the graph of the function f(x)=2x2−loge|x|
View SolutionDraw the graph of the function f(x)=|x−1|
View SolutionDraw the graph of the function f(x)=−x|x|.
View SolutionDraw the graph of the function f(x)=x−∣∣x−x2∣∣,−1≤x≤1 and find the points of non-differentiability.
View SolutionDraw the graph of the function: f(x)=∣∣x2−3∣∣x|+2|
View SolutionDraw the graph of the function f(x)=x−|x2−x|−1≤x≤1, where [⋅] denotes the greatest integer function. Find the points of discontinuity and non-differentiability.
View SolutionDraw the graph of the function y=f(x)=tan−1(1−x21+x2).
View SolutionDraw the graph of the function f(x)=x−√x.
View SolutionDraw the graph of the function f(x)=x−∣∣x−x2∣∣,−1≤x≤1 and discuss the continuity or discontinuity of f in the interval −1≤x≤1
View Solution