To know the opinion of the students about Mathematics, a survey of 200 students was conducted. The data is recorded in the following table: Opinion: Like Dislike No. of students 135 65 Find the probability that a student chosen at random (i) like Mathematics (ii) does not like it.
To solve the problem, we need to find the probability of two events based on the survey results of 200 students regarding their opinion on Mathematics.
1. Identify the Total Number of Students:
The total number of students surveyed is given as 200.
2. Identify the Number of Students Who Like Mathematics:
According to the data, the number of students who like Mathematics is 135.
3. Calculate the Probability that a Student Likes Mathematics:
The probability (P) that a student chosen at random likes Mathematics can be calculated using the formula:
P(Like)=Number of students who like MathematicsTotal number of students=135200
Simplifying this fraction:
P(Like)=135÷5200÷5=2740
4. Identify the Number of Students Who Dislike Mathematics:
The number of students who dislike Mathematics is given as 65.
5. Calculate the Probability that a Student Does Not Like Mathematics:
The probability (P) that a student chosen at random does not like Mathematics can be calculated using the formula:
P(Dislike)=Number of students who dislike MathematicsTotal number of students=65200
Simplifying this fraction:
P(Dislike)=65÷5200÷5=1340
Final Answers:
- (i) The probability that a student likes Mathematics is 2740.
- (ii) The probability that a student does not like Mathematics is 1340.
The total number of students surveyed is given as 200.
According to the data, the number of students who like Mathematics is 135.
The probability (P) that a student chosen at random likes Mathematics can be calculated using the formula:
P(Like)=Number of students who like MathematicsTotal number of students=135200
Simplifying this fraction:
P(Like)=135÷5200÷5=2740
The number of students who dislike Mathematics is given as 65.
The probability (P) that a student chosen at random does not like Mathematics can be calculated using the formula:
P(Dislike)=Number of students who dislike MathematicsTotal number of students=65200
Simplifying this fraction:
P(Dislike)=65÷5200÷5=1340
- (i) The probability that a student likes Mathematics is 2740.
- (ii) The probability that a student does not like Mathematics is 1340.
Topper's Solved these Questions
Similar Questions
To know the opinion of the students about Mathematics, a survey of 200 students was conducted. The data is recorded in the following table: Find the probability that a student chosen at random (i) likes Mathematics (ii) does not like it.
View SolutionA survey of 300 girls of a school was conducted and it was found that 108 girls like tea and 192 dislike it. Out of these girls one girl is selected at random. What is the probability that the selected girl (i) likes tea (ii) does not like tea.
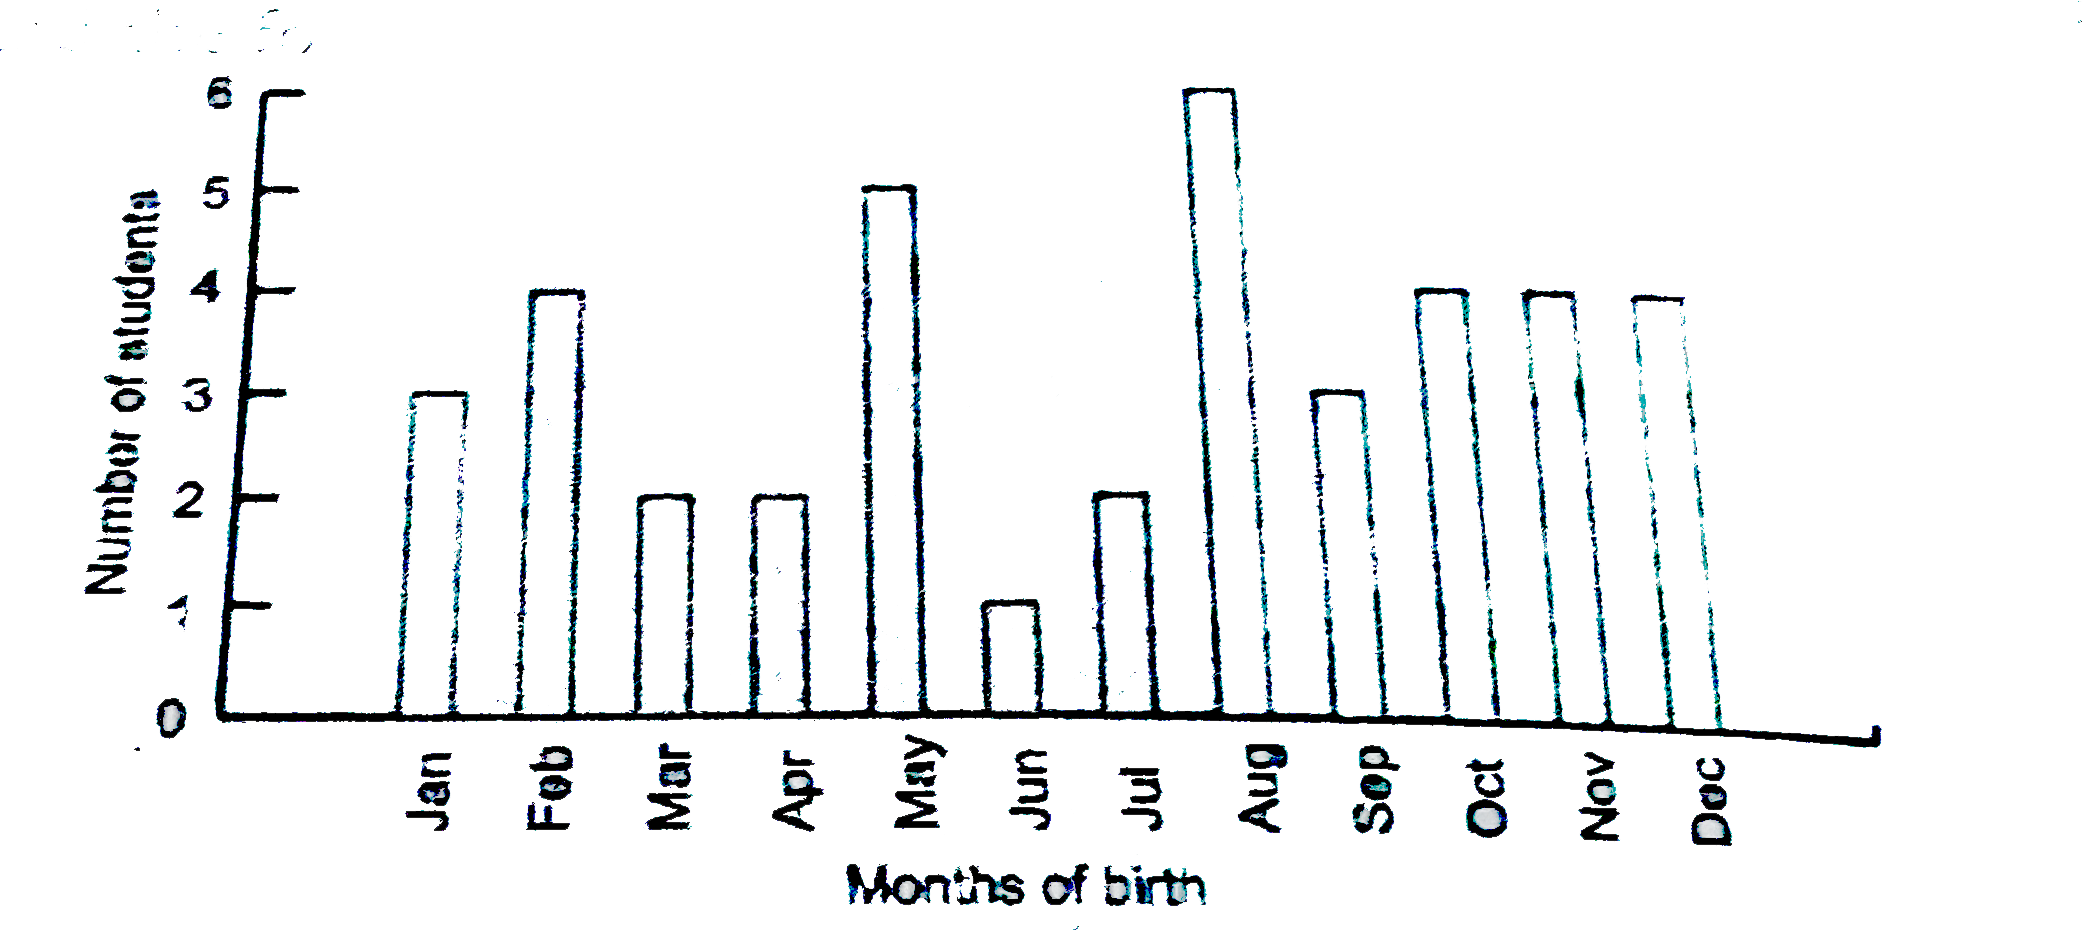
View SolutionIn a particular section of class IX, 40 students were asked about the month of their birth and the following graph was prepared for the data so obtained.

Find the probability that a student of the class was born in August.
View SolutionThe scores in mathematics test (out of 25) of 15 students are as follows: Find the mode and median of this data. Are they same?
View SolutionIn a school, 300 students were surveyed. The survey showed that 186 students liked watching cricket match while the rest disliked it. Out of these students, if one student is chosen at random, what is the probability that the chosen student :
(i) likes watching cricket match?
(ii) dislikes watching cricket match?
View SolutionThe marks distribution of 30 students m a mathematics examination are given in Table of Example 1. Find the mode of this data.
View SolutionA survey shows that 69% students like mathematics, whereas 75% like chemistry. If x% students like both the subjects, then the maximum value of x is
View SolutionIn a school 25% students are failed in Mathematics, 15% in Physics and 5% students fail in both Mathematics and Physics. A student is selected at random.
(i) If he is fail in Physics, find the probability that he is fail in Mathematics.
(ii) If he is fail in Mathematics, find the probability that he in fail in Physics.
(iii) Find the probability that he is fail either in Mathematics or in Physics.
View SolutionA Mathematics aptitude test of 50 students was recorded as follows:

Draw a histogram for the above data using a graph paper and locate the mode:
View SolutionIn a class of 125 students 70 passed in Mathematics, 55 in statistics, and 30 in both. Then find the probability that a student selected at random from the class has passes in only one subject.
View Solution
