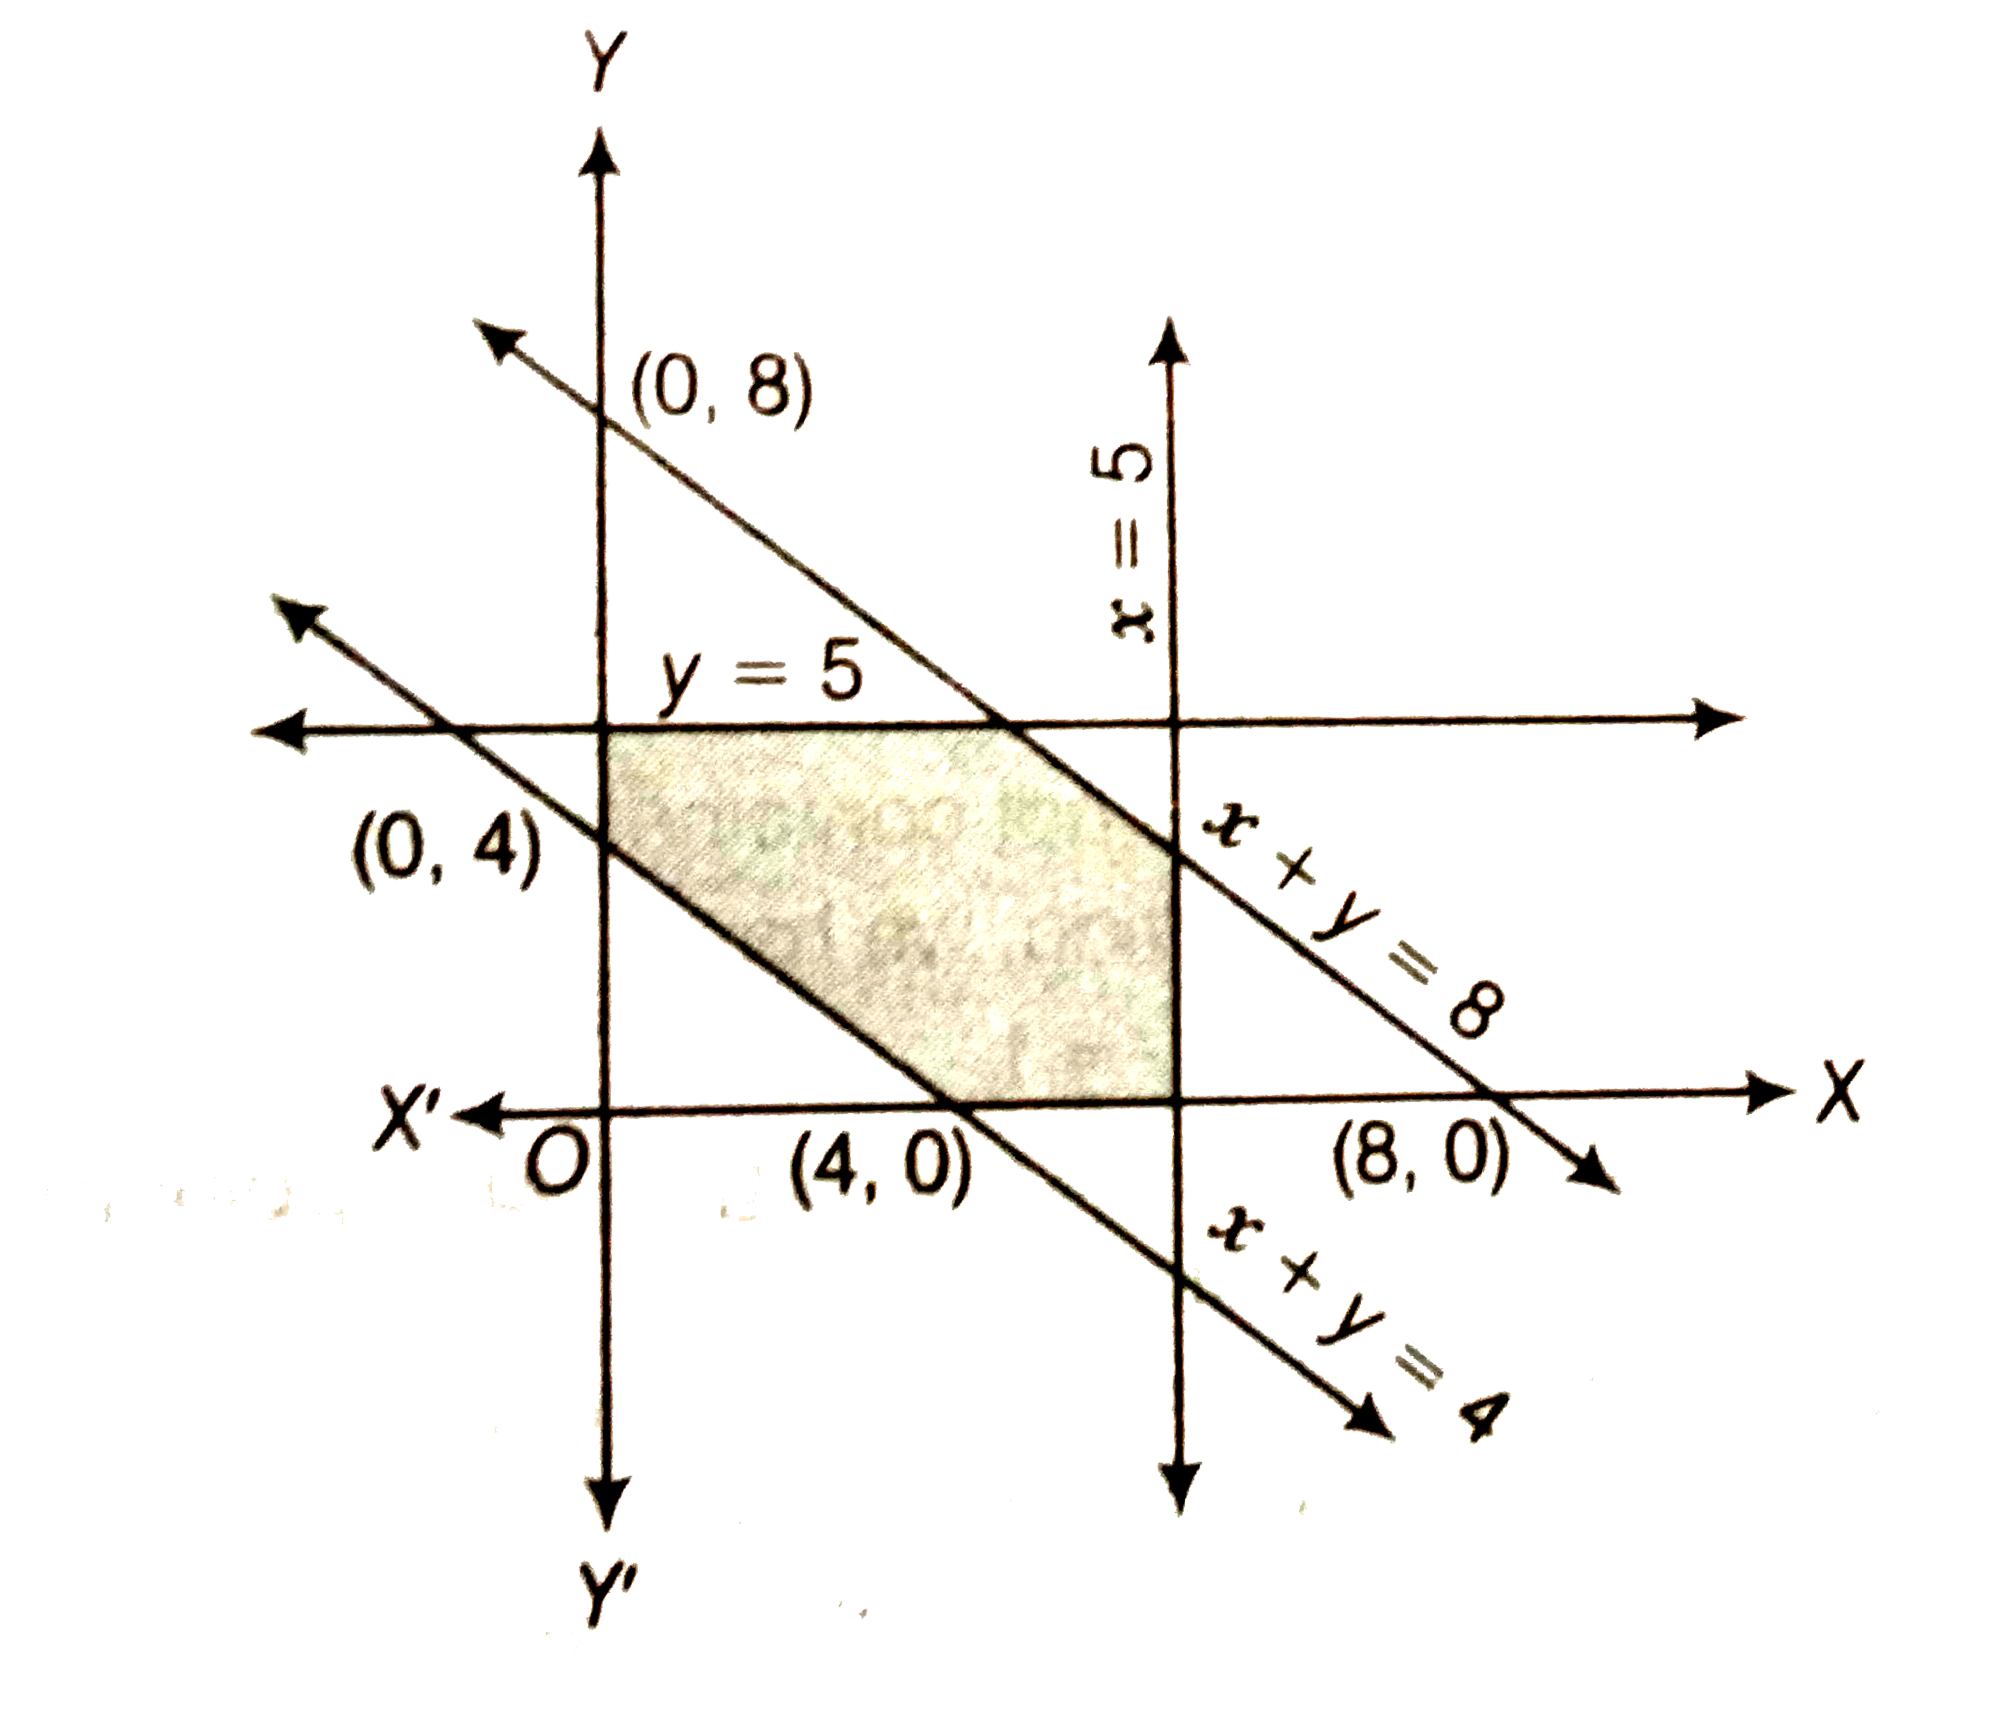
Find the linear inequations for which the solution set is the shaded region given in fig. 15.42.
To find the linear inequalities corresponding to the shaded region in the given figure (15.42), we will analyze the lines present in the figure and determine the inequalities based on their positions relative to the shaded area.
Step 1: Identify the Lines
From the video transcript, we have identified five lines in the figure. Let's denote them as follows:
1. Line 1: y=3
2. Line 2: 6x+2y=18
3. Line 3: x+5y=4
4. Line 4: x=3
5. Line 5: x+y=4
Step 2: Convert Lines to Inequalities
Now, we will convert each line equation into an inequality based on the shaded region.
1. Line 1: y=3
- Since the shaded region is below this line, the inequality is:
y<3
2. Line 2: 6x+2y=18
- Rearranging gives 2y=−6x+18 or y=−3x+9.
- The shaded region is below this line, so the inequality is:
6x+2y<18
3. Line 3: x+5y=4
- Rearranging gives 5y=−x+4 or y=−15x+45.
- The shaded region is below this line, so the inequality is:
x+5y<4
4. Line 4: x=3
- The shaded region is to the left of this line, so the inequality is:
x<3
5. Line 5: x+y=4
- Rearranging gives y=−x+4.
- The shaded region is below this line, so the inequality is:
x+y<4
Final Inequalities
Combining all the inequalities, we have the following system of linear inequalities that represent the shaded region:
1. y<3
2. 6x+2y<18
3. x+5y<4
4. x<3
5. x+y<4
From the video transcript, we have identified five lines in the figure. Let's denote them as follows:
2. Line 2: 6x+2y=18
3. Line 3: x+5y=4
4. Line 4: x=3
5. Line 5: x+y=4
Now, we will convert each line equation into an inequality based on the shaded region.
- Since the shaded region is below this line, the inequality is:
y<3
- Rearranging gives 2y=−6x+18 or y=−3x+9.
- The shaded region is below this line, so the inequality is:
6x+2y<18
- Rearranging gives 5y=−x+4 or y=−15x+45.
- The shaded region is below this line, so the inequality is:
x+5y<4
- The shaded region is to the left of this line, so the inequality is:
x<3
- Rearranging gives y=−x+4.
- The shaded region is below this line, so the inequality is:
x+y<4
Combining all the inequalities, we have the following system of linear inequalities that represent the shaded region:
2. 6x+2y<18
3. x+5y<4
4. x<3
5. x+y<4
Topper's Solved these Questions
Similar Questions
Find the area of the shaded region given in figure.
View SolutionFind the linear inequations for which the shaded region in fig. 15.40 is the solution set.
View SolutionThe shaded region in the given figure is
View SolutionThe shaded region in the given figure is
View SolutionFind the linear inequalities for which the shaded region in the given figure is the solution set.
View SolutionFind the linear inequalities for which the shaded region in the given figure is the solution set.
View SolutionFind the linear equations for which the shaded area in Fig: 15.39 is the solution set.
View SolutionFind the linear inequations for which the shaded area in fig. 15.41 is the solution set. Draw the diagram of the solution set of the linear inequations.
View SolutionFind the linear inequations for which the shaded area in the figure given below is the solution set.
View SolutionFind the areas of the shaded region in the Fig. 15.39. (FIGURE)
View Solution
