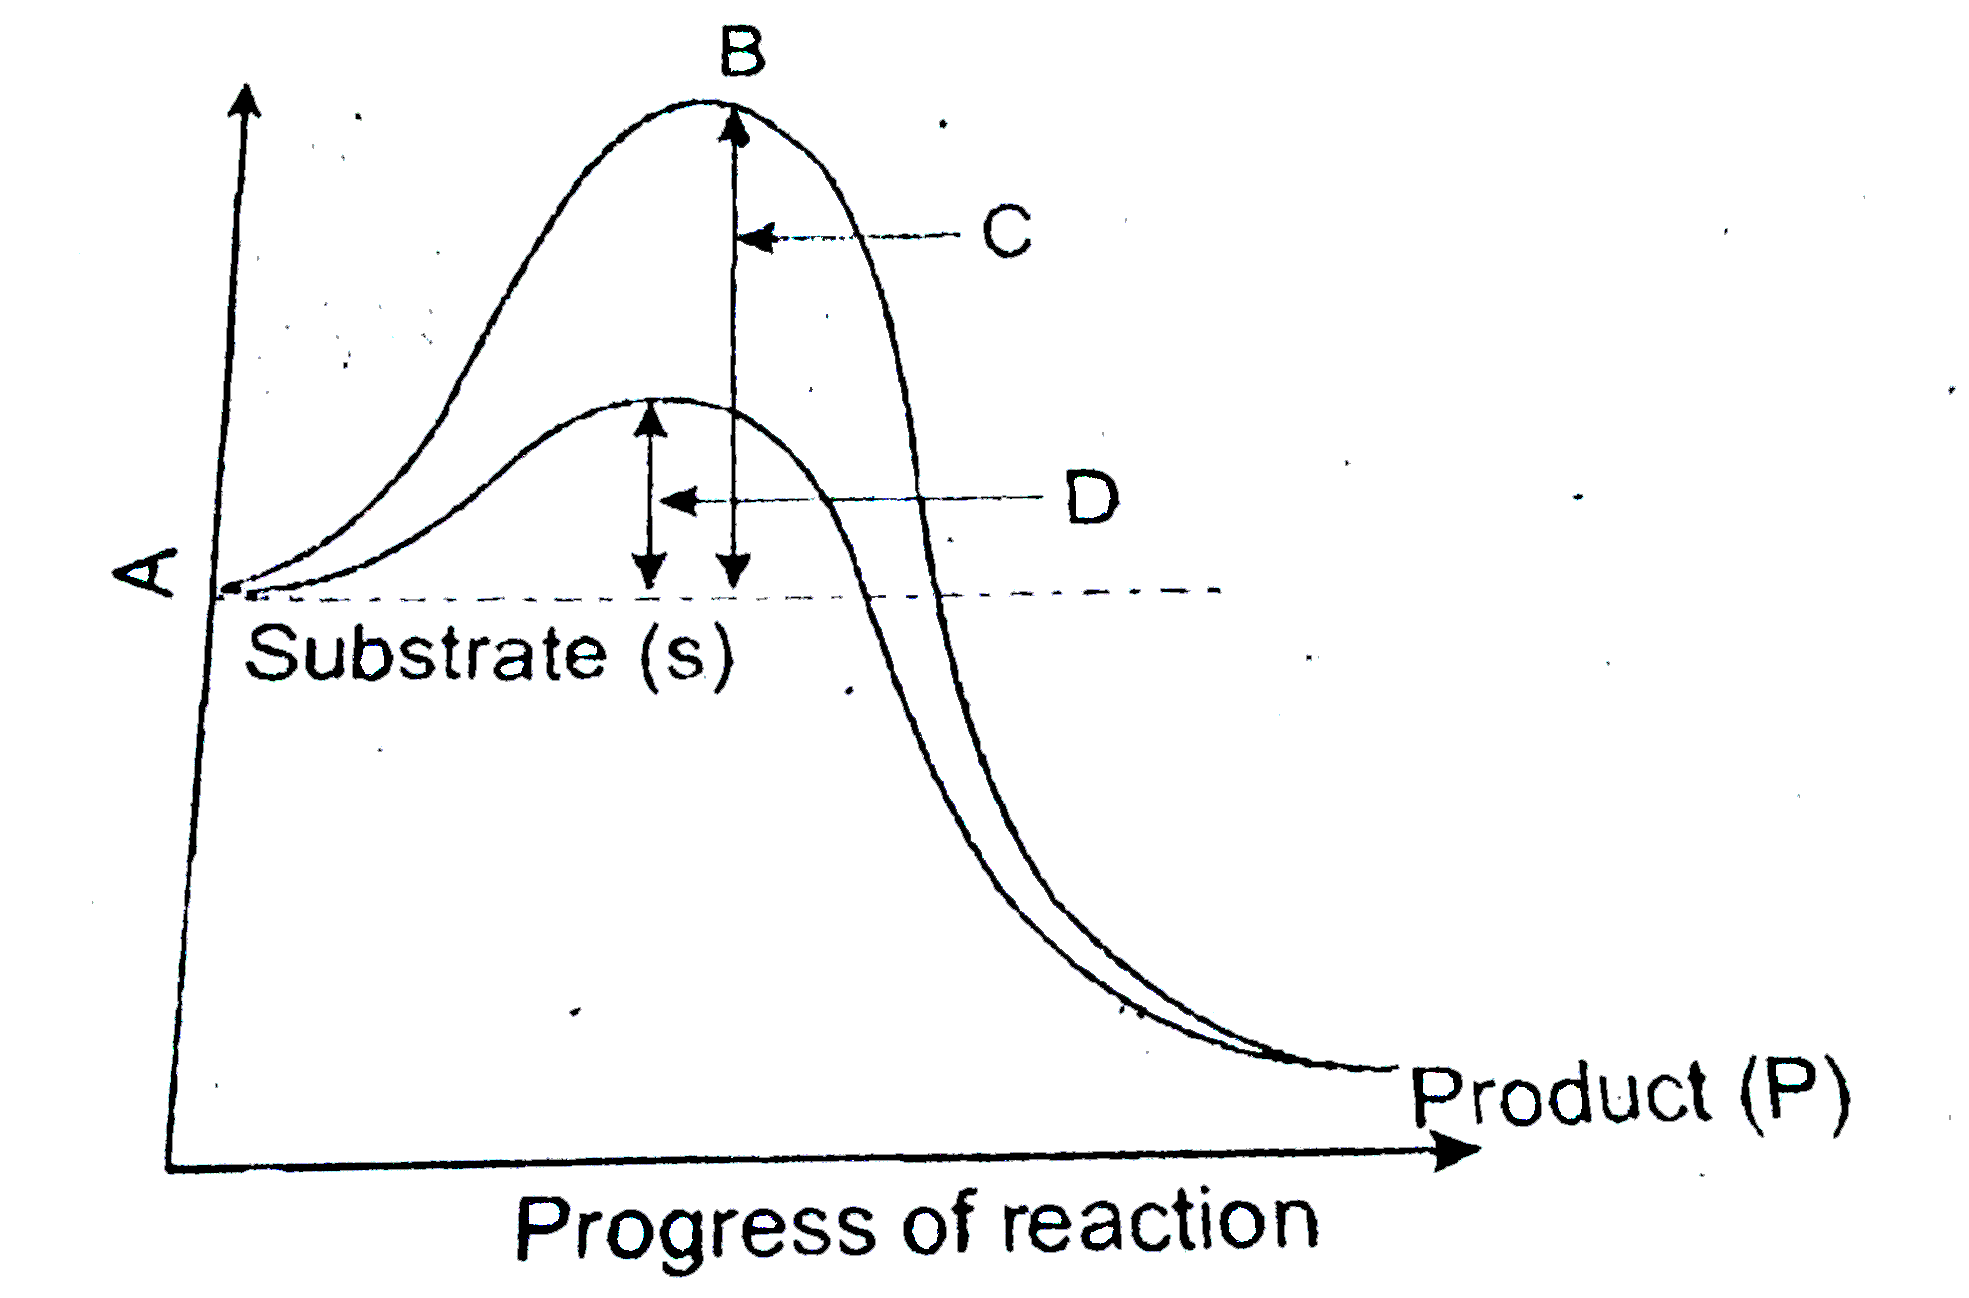
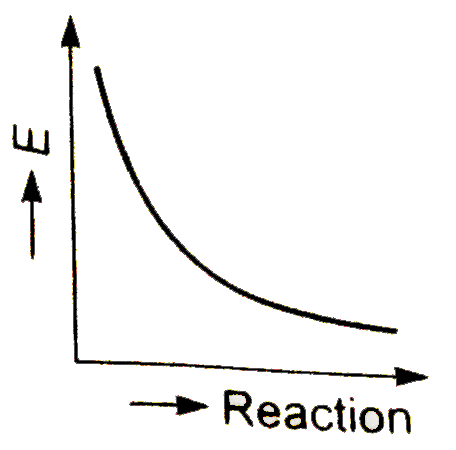
Which graph shows zero activation energy ?
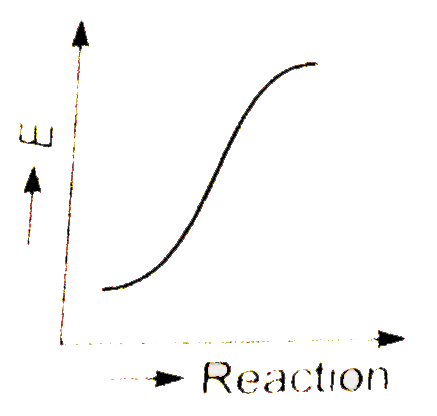
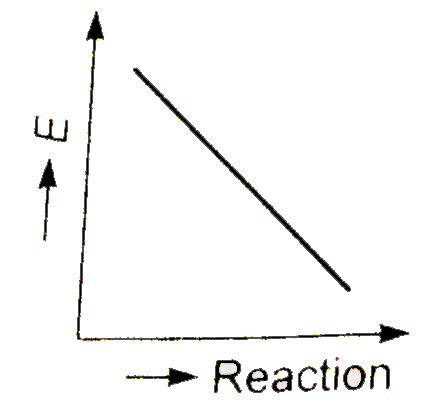
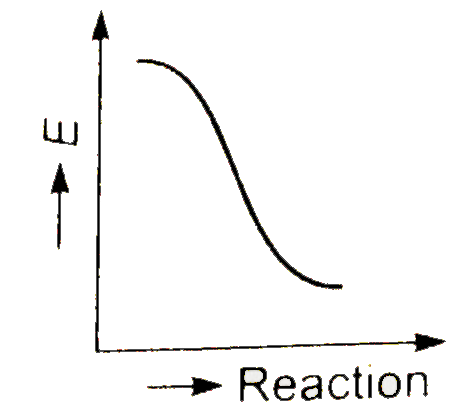
The correct Answer is:C
To determine which graph shows zero activation energy, we need to understand what activation energy represents in a reaction.
1. Understanding Activation Energy:
Activation energy is the minimum energy required for a chemical reaction to occur. It is represented as the energy difference between the reactants and the transition state (the highest energy point along the reaction pathway).
2. Analyzing Graphs:
- Graph 1: This graph shows a difference in energy between the reactants and the transition state. Therefore, it indicates a positive activation energy.
- Graph 2: Similar to Graph 1, this graph also shows a difference in energy, indicating that activation energy is present.
- Graph 3: This graph shows no difference in energy between the reactants and the transition state. This means that the energy level of the reactants is equal to that of the transition state, indicating zero activation energy.
3. Conclusion:
Based on the analysis of the graphs, Graph 3 is the correct answer as it represents a scenario where there is zero activation energy.
Final Answer:
Graph 3 shows zero activation energy.
---
Activation energy is the minimum energy required for a chemical reaction to occur. It is represented as the energy difference between the reactants and the transition state (the highest energy point along the reaction pathway).
- Graph 1: This graph shows a difference in energy between the reactants and the transition state. Therefore, it indicates a positive activation energy.
- Graph 2: Similar to Graph 1, this graph also shows a difference in energy, indicating that activation energy is present.
- Graph 3: This graph shows no difference in energy between the reactants and the transition state. This means that the energy level of the reactants is equal to that of the transition state, indicating zero activation energy.
Based on the analysis of the graphs, Graph 3 is the correct answer as it represents a scenario where there is zero activation energy.
Graph 3 shows zero activation energy.
Similar Questions
Knowledge Check
Which of the following reactions has zero activation energy?
A B
B C
C D
D
Which of the following graph shows the variationi of density of water increase in temperature ?
A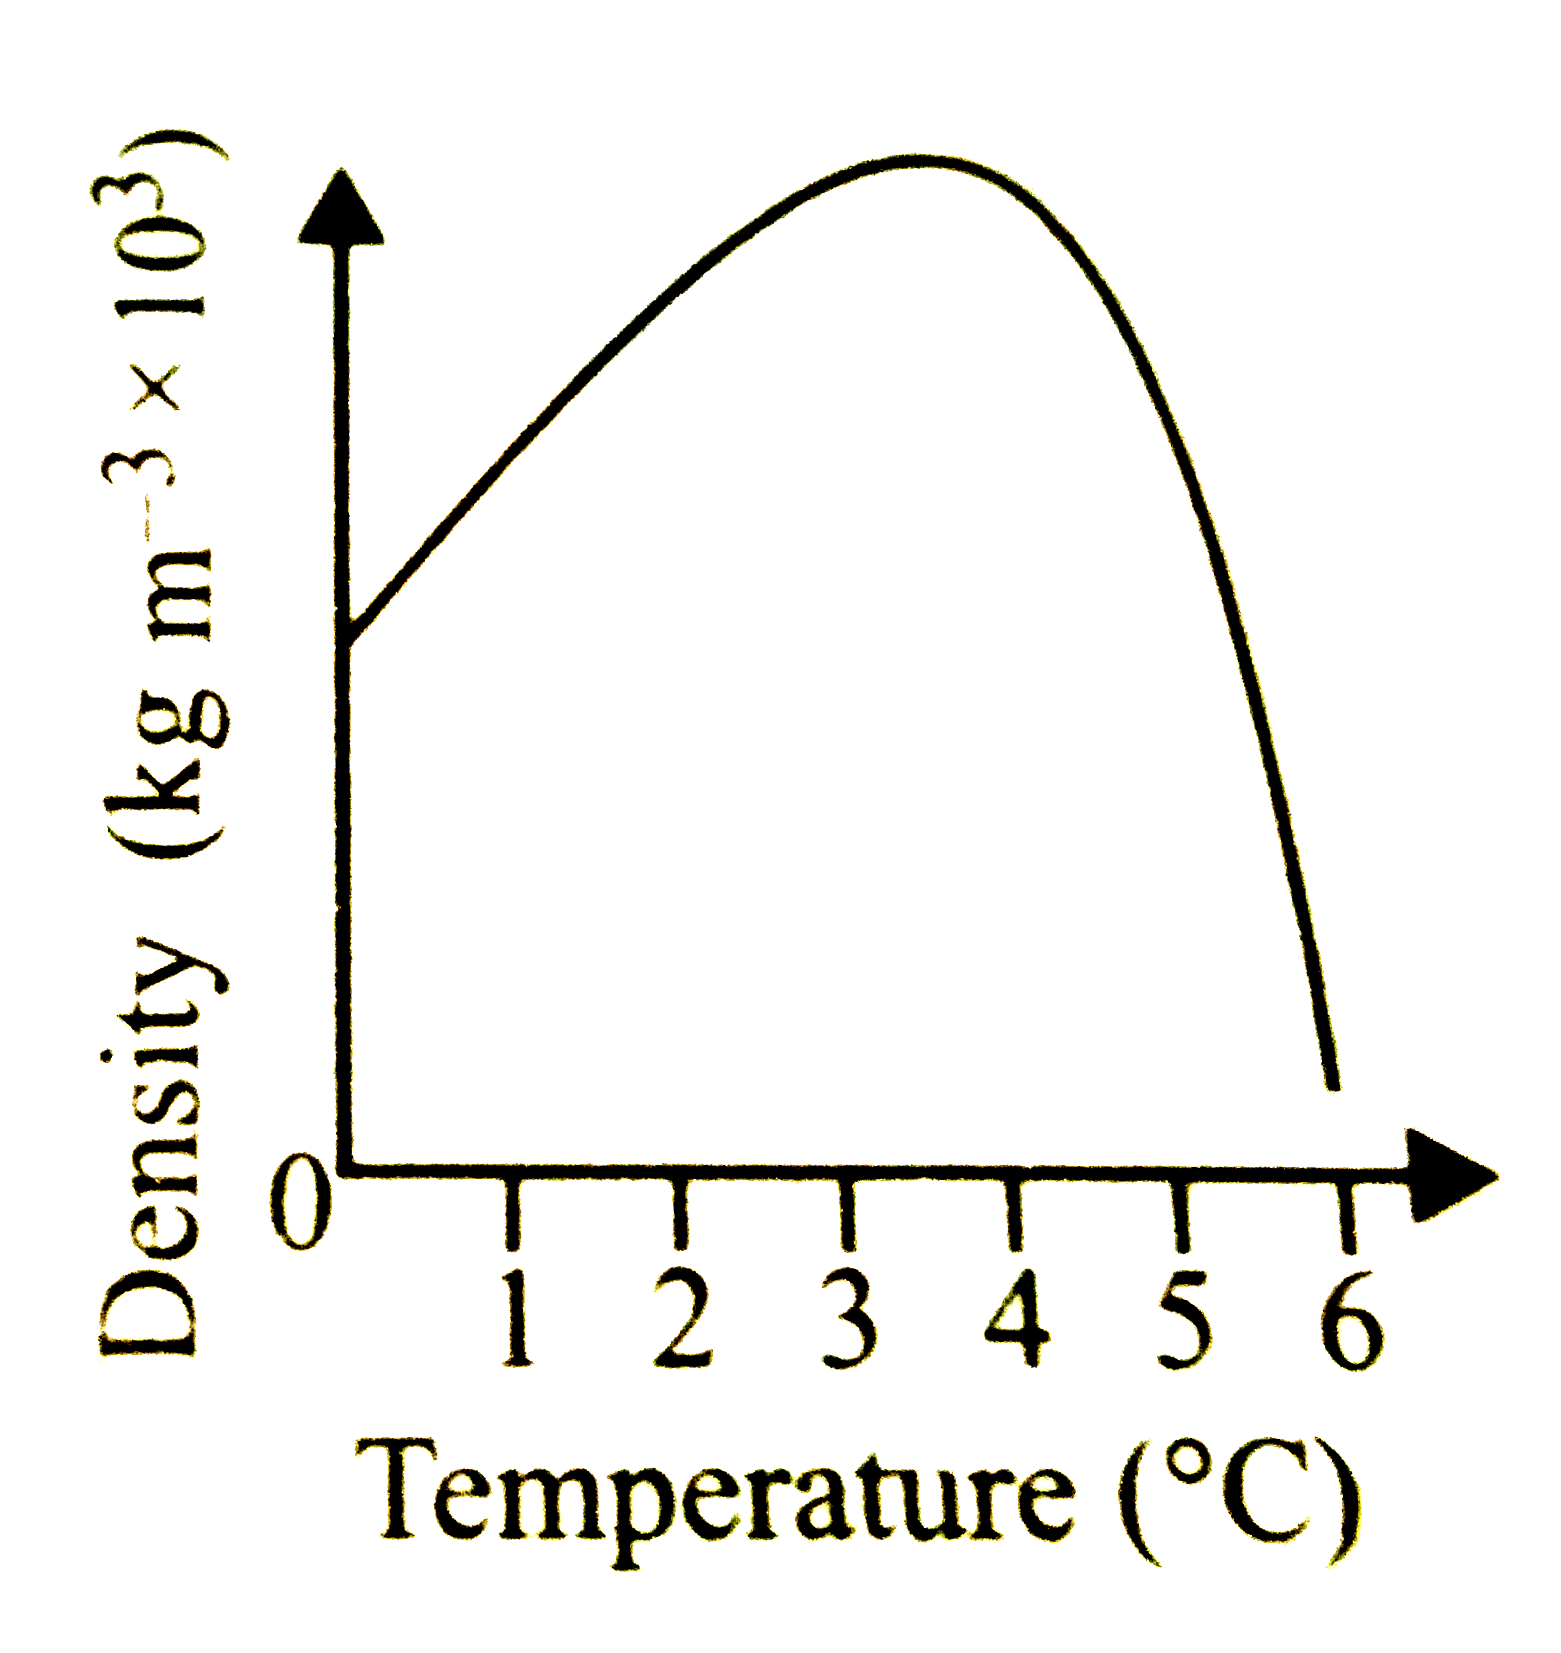 B
B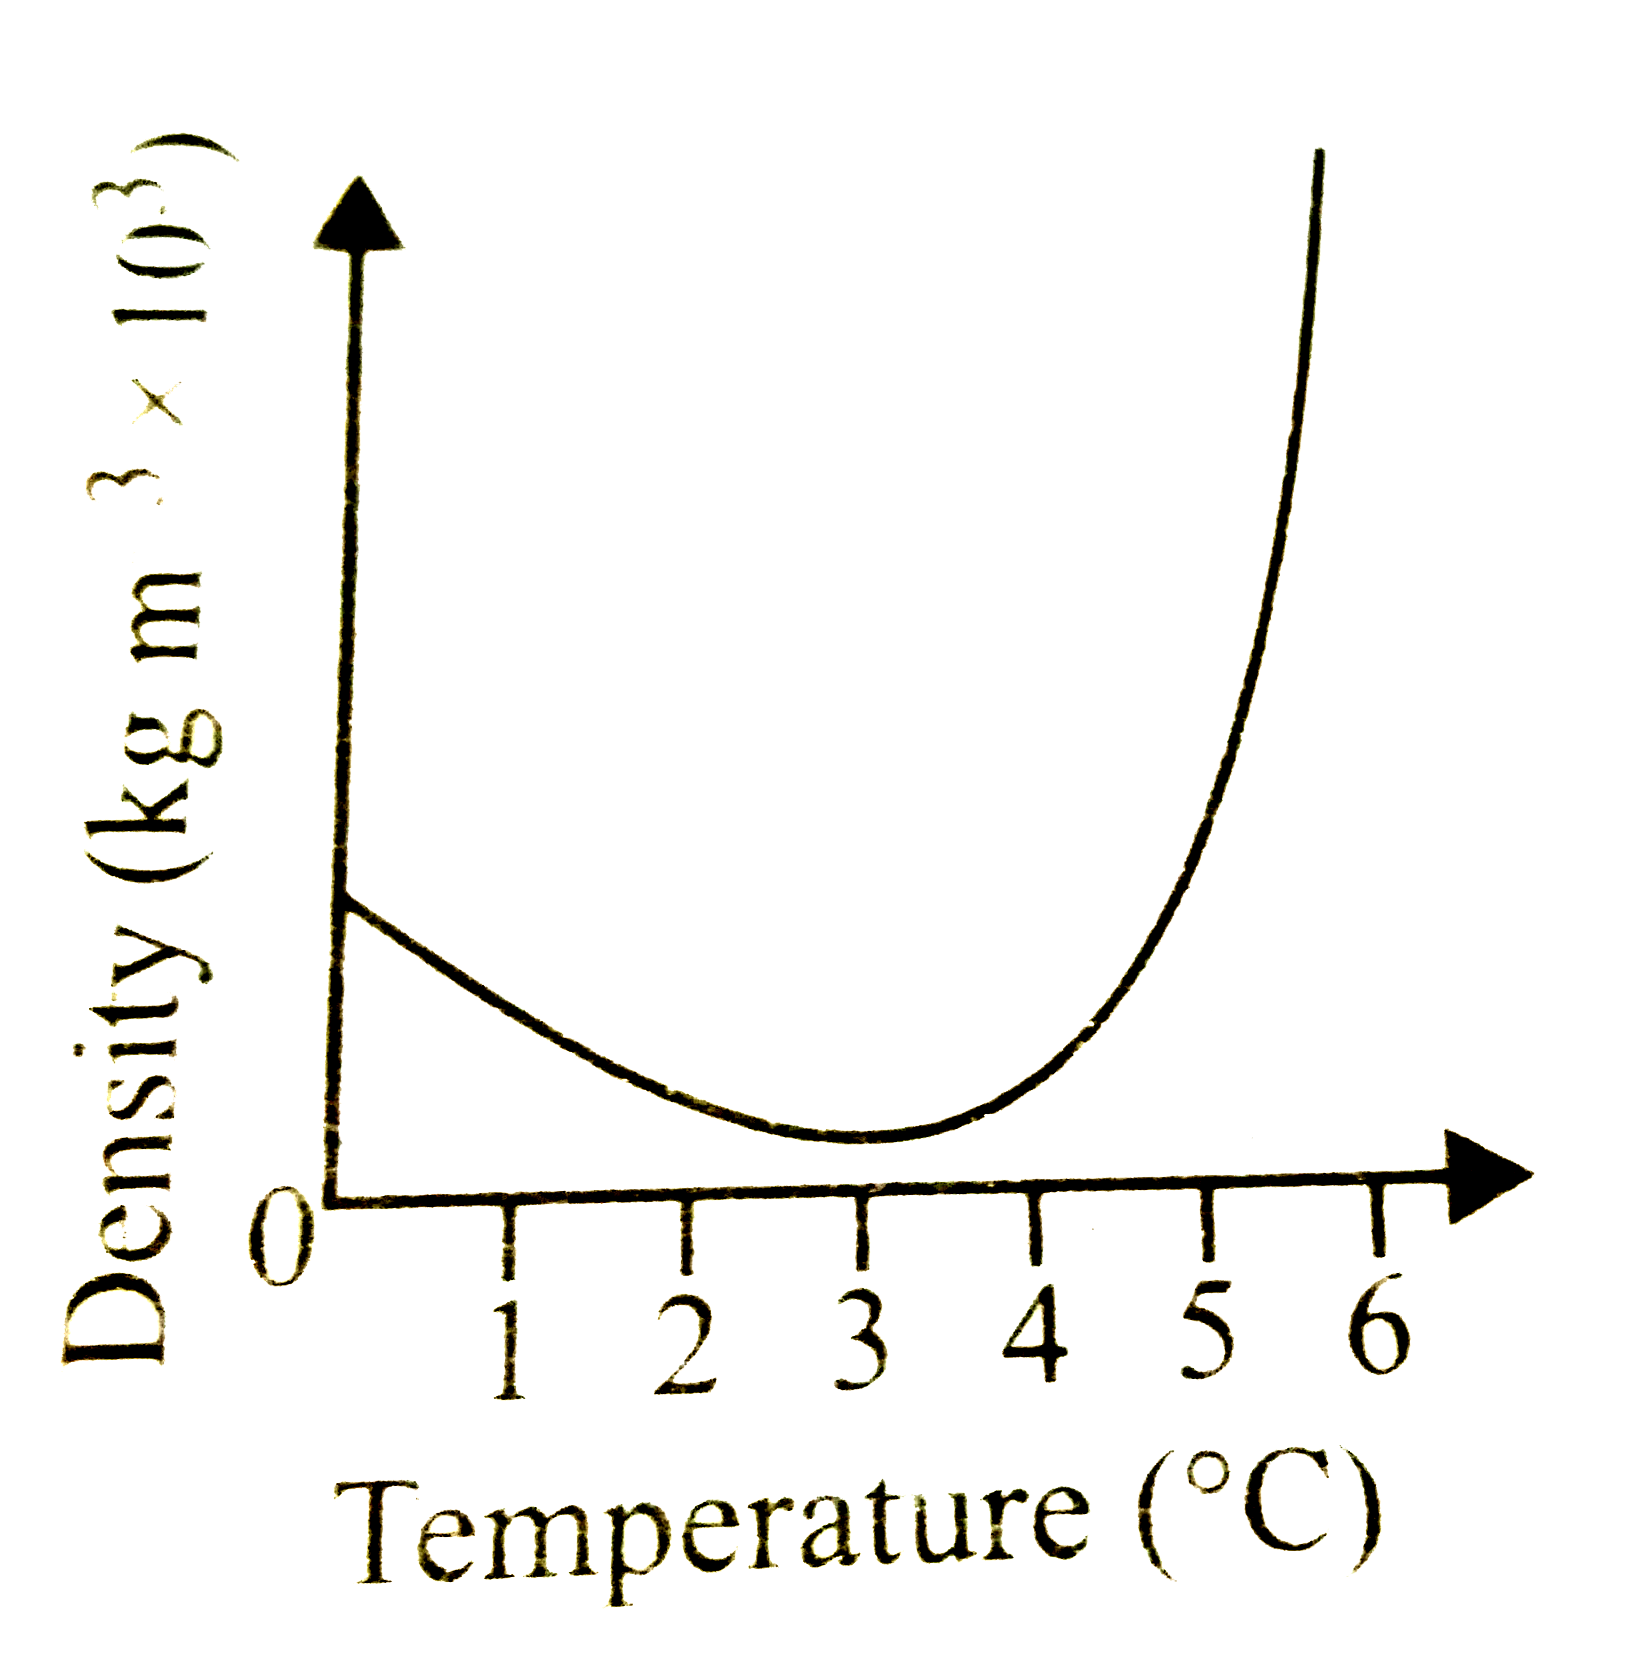 C
C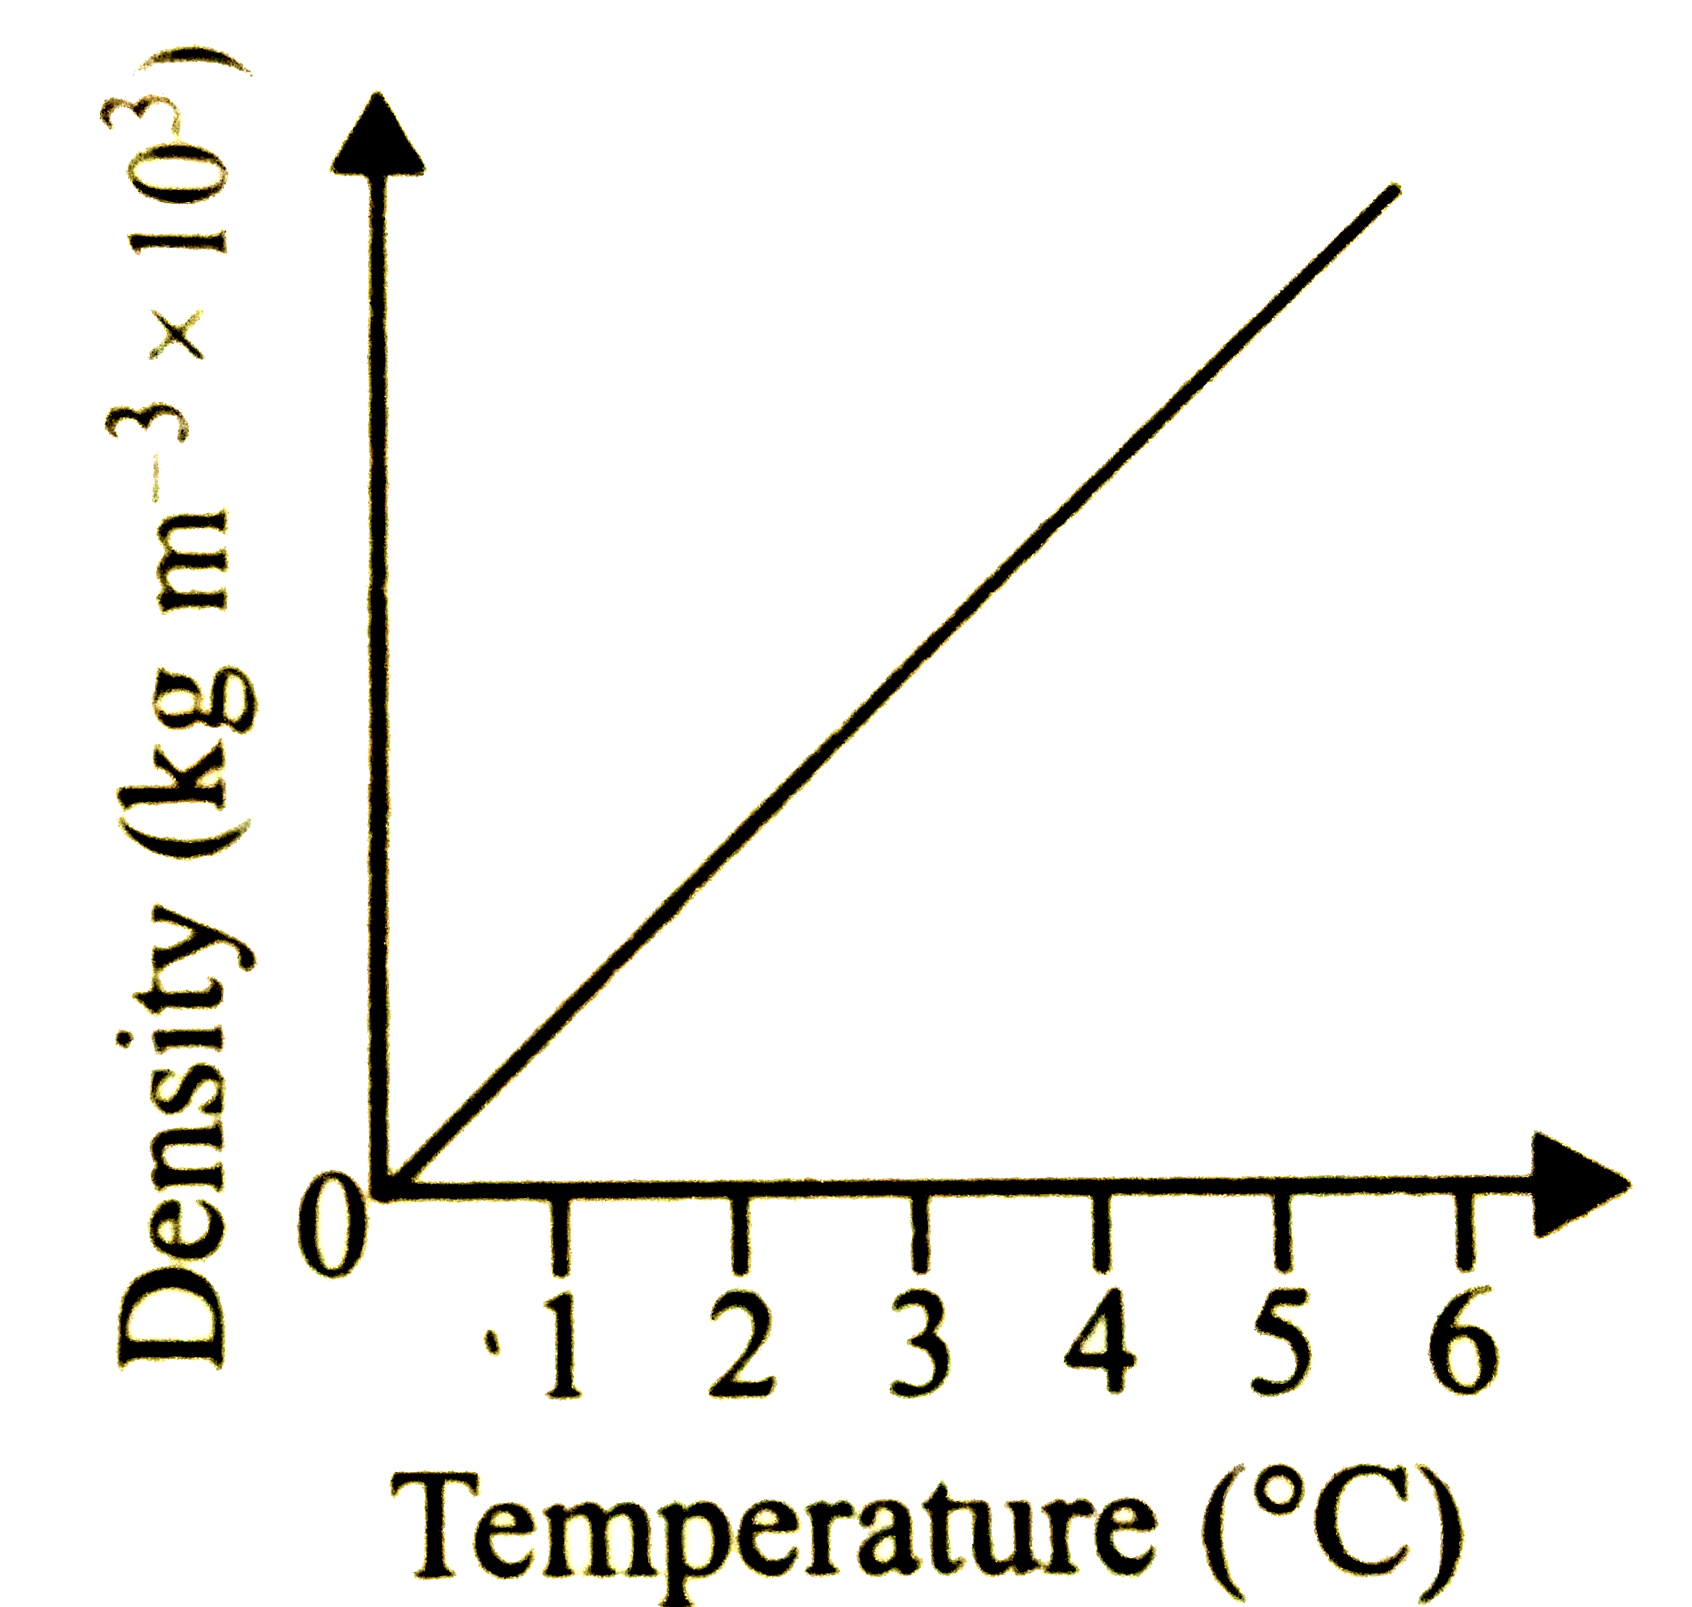 D
D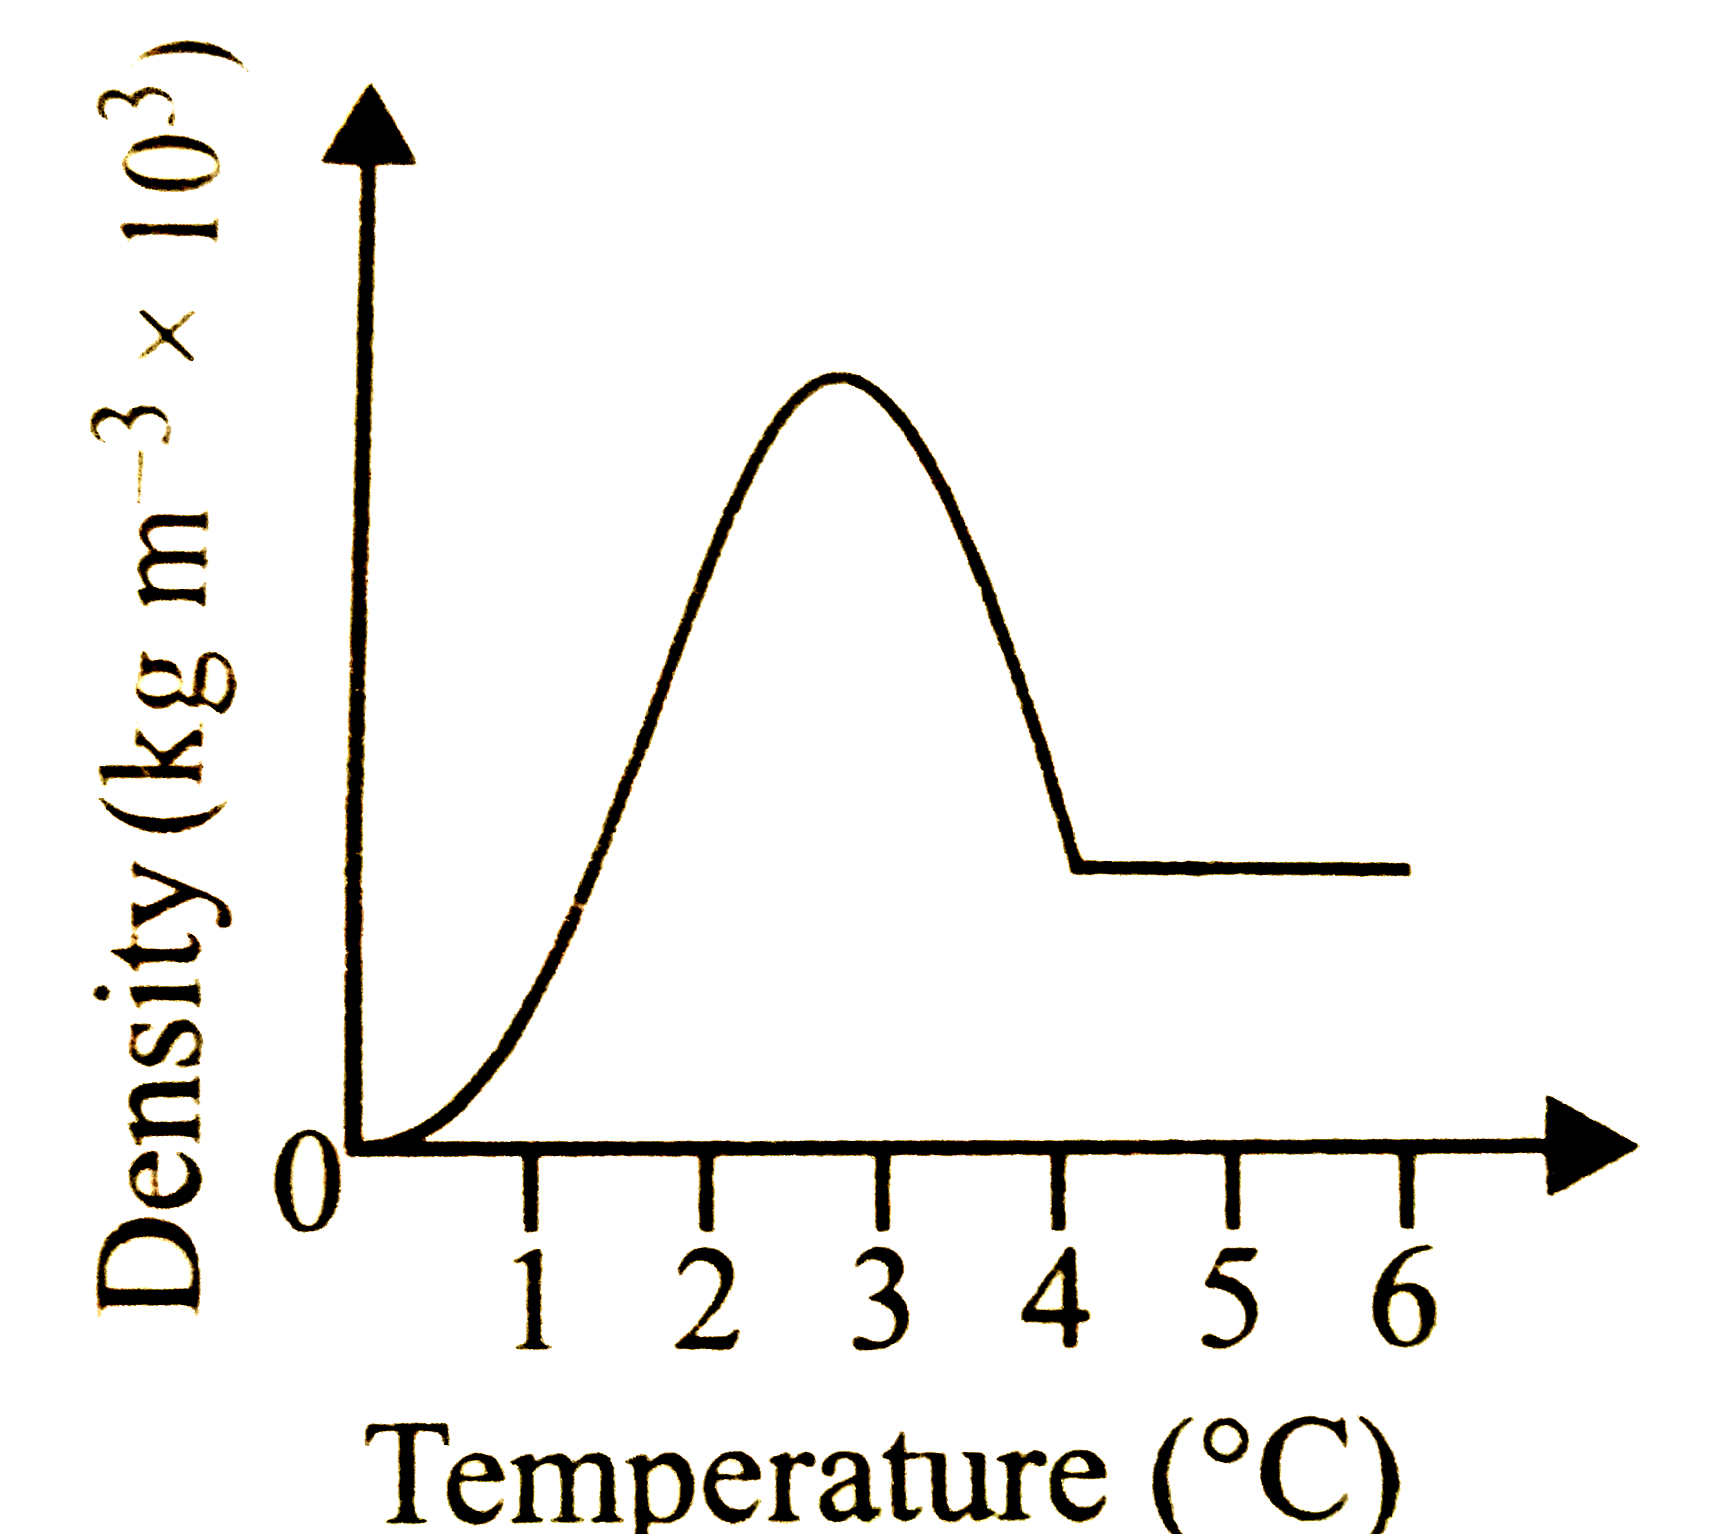
Which graph shows how the energy E of a photon of light is related to its wavelengths (λ)?
View SolutionWhich graphs shows the correct description of effect of pH on the enzymatic activity
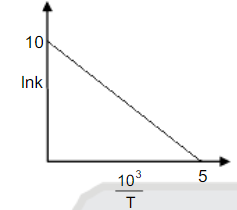
View SolutionUsing following graph find activation energy (in KJ)
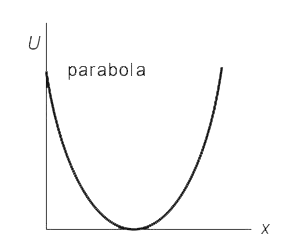
View SolutionThe first graph shows the potential energy U(x) for a particle moving on the x axis. Which of the other four graphs correctly gives the force F exerted on the particle?
View SolutionThe given (p - U) graph shows the variation of internal energy of an ideal gas with increase in pressure. Which of the following pressure - volume graph is equivalent to this graph ?
 .
.
View SolutionBy which activation energy calculate :
View Solution

