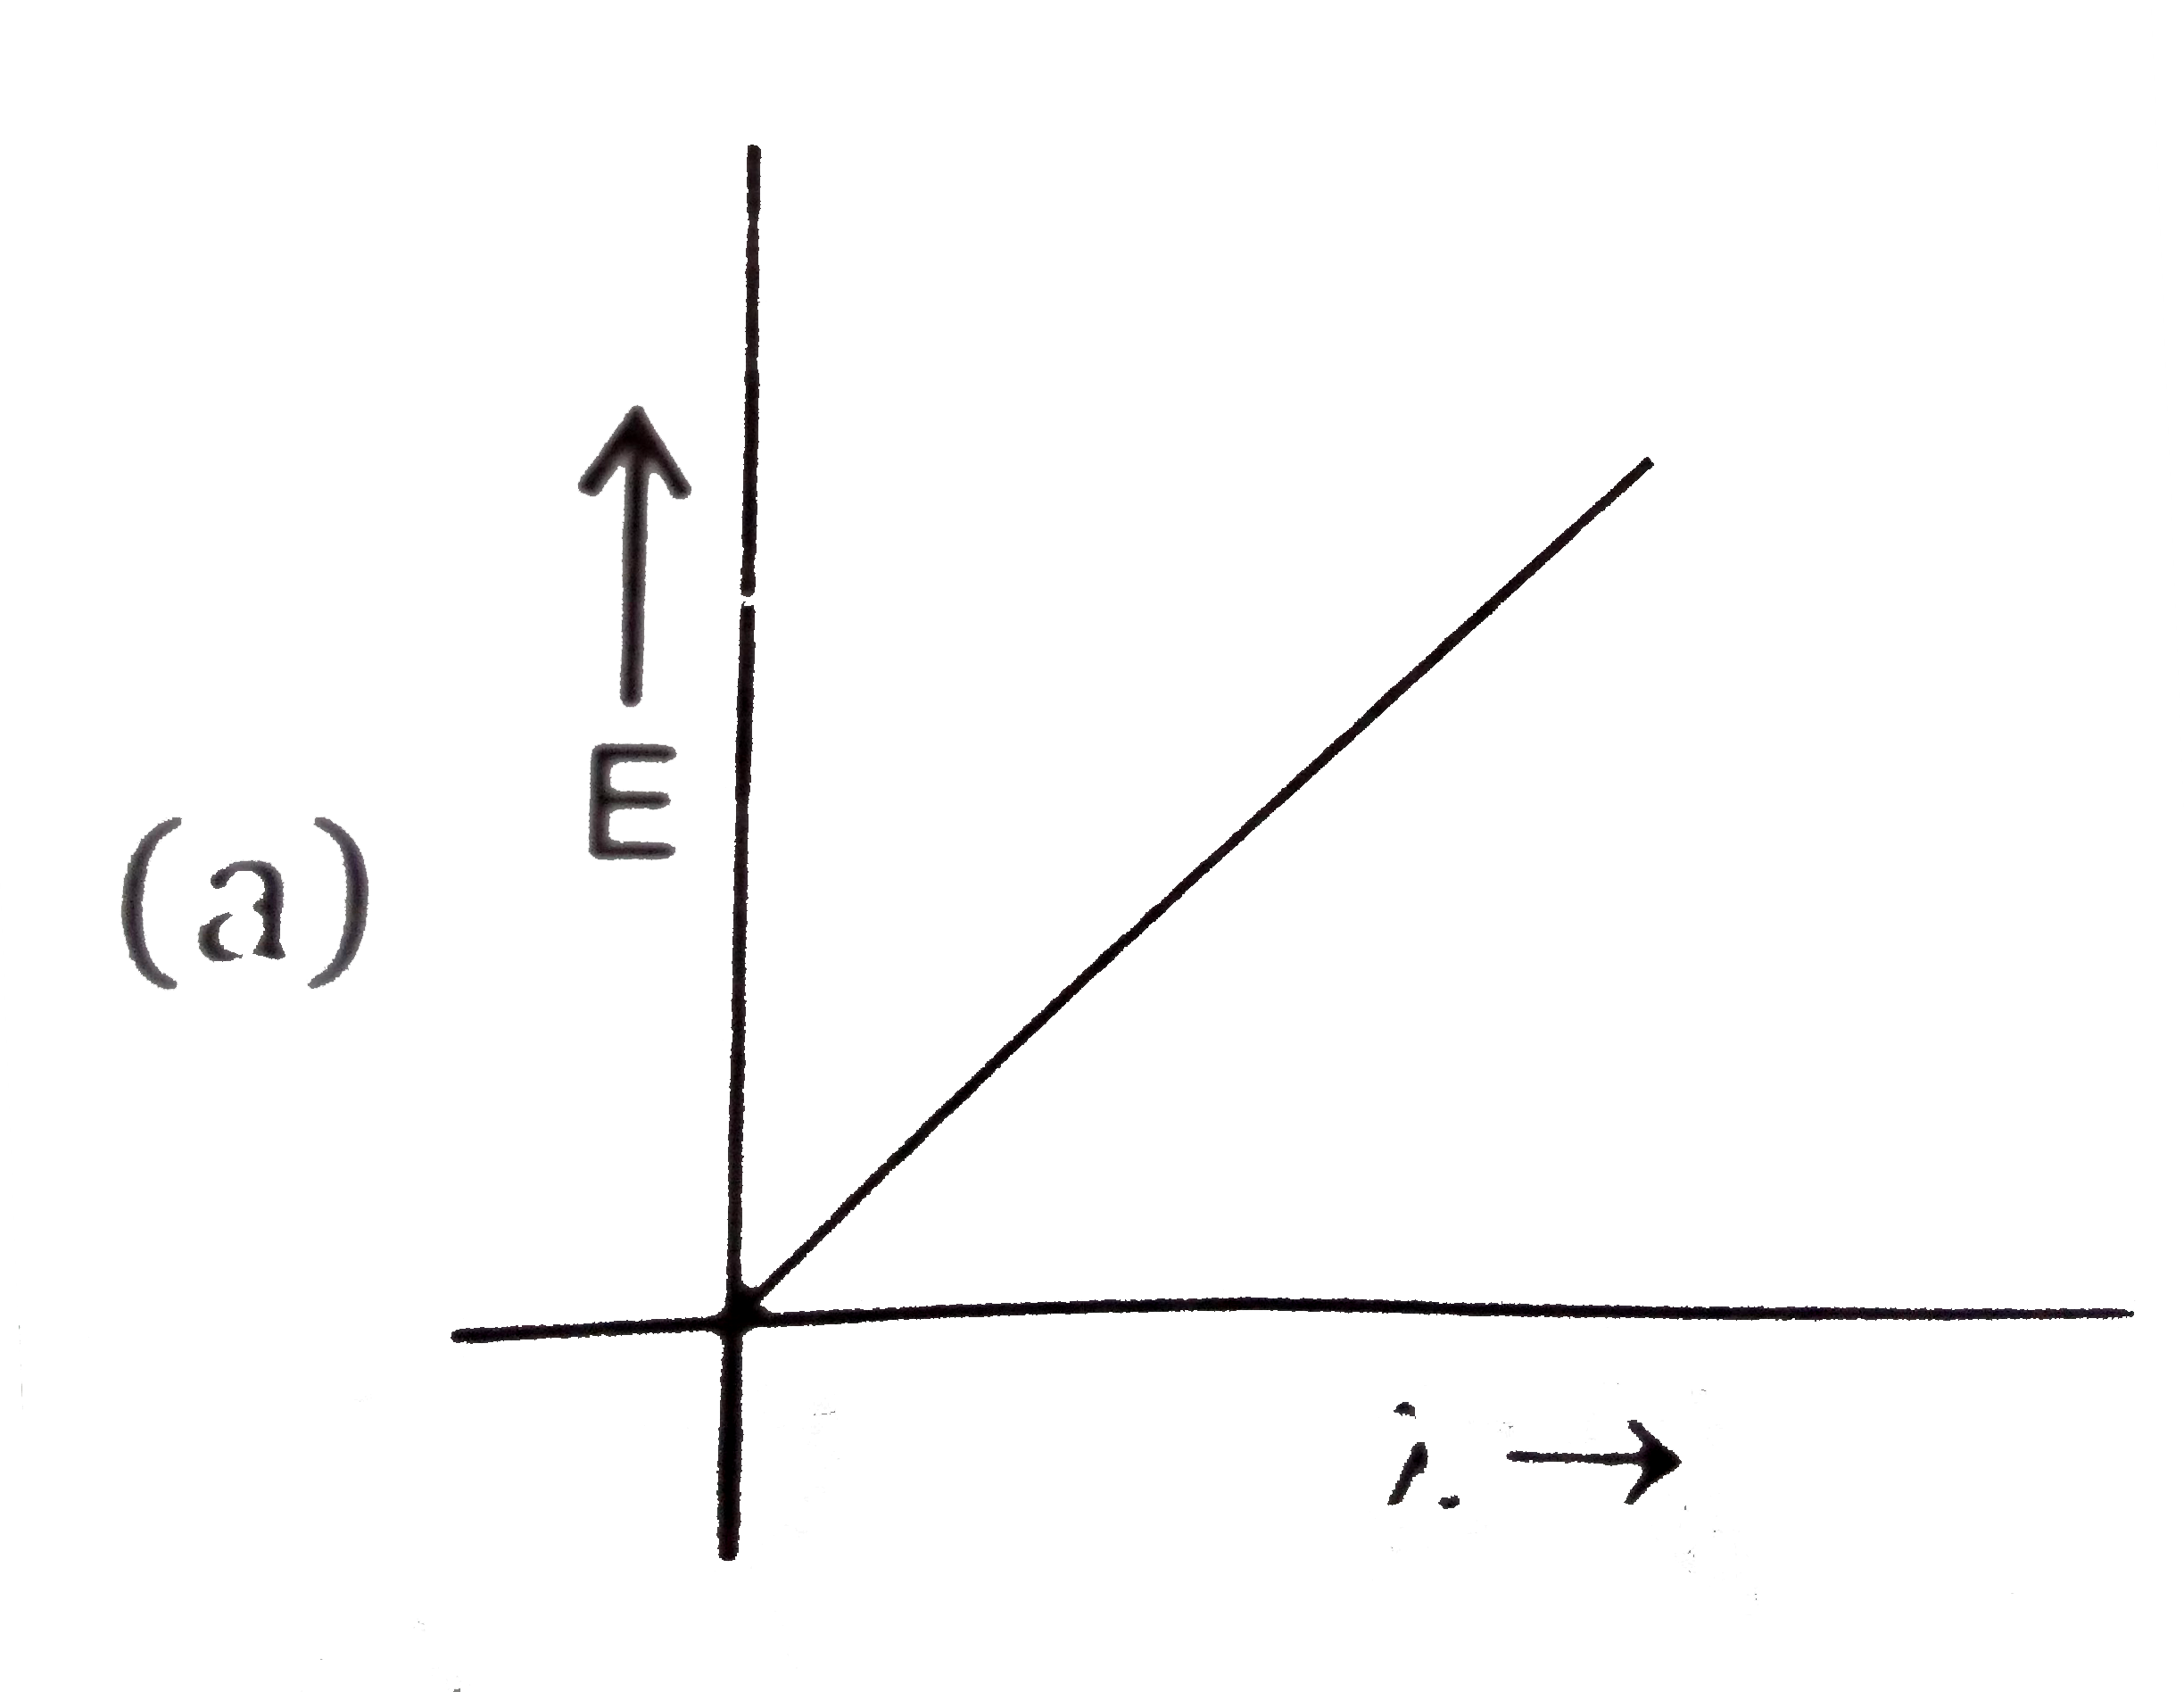
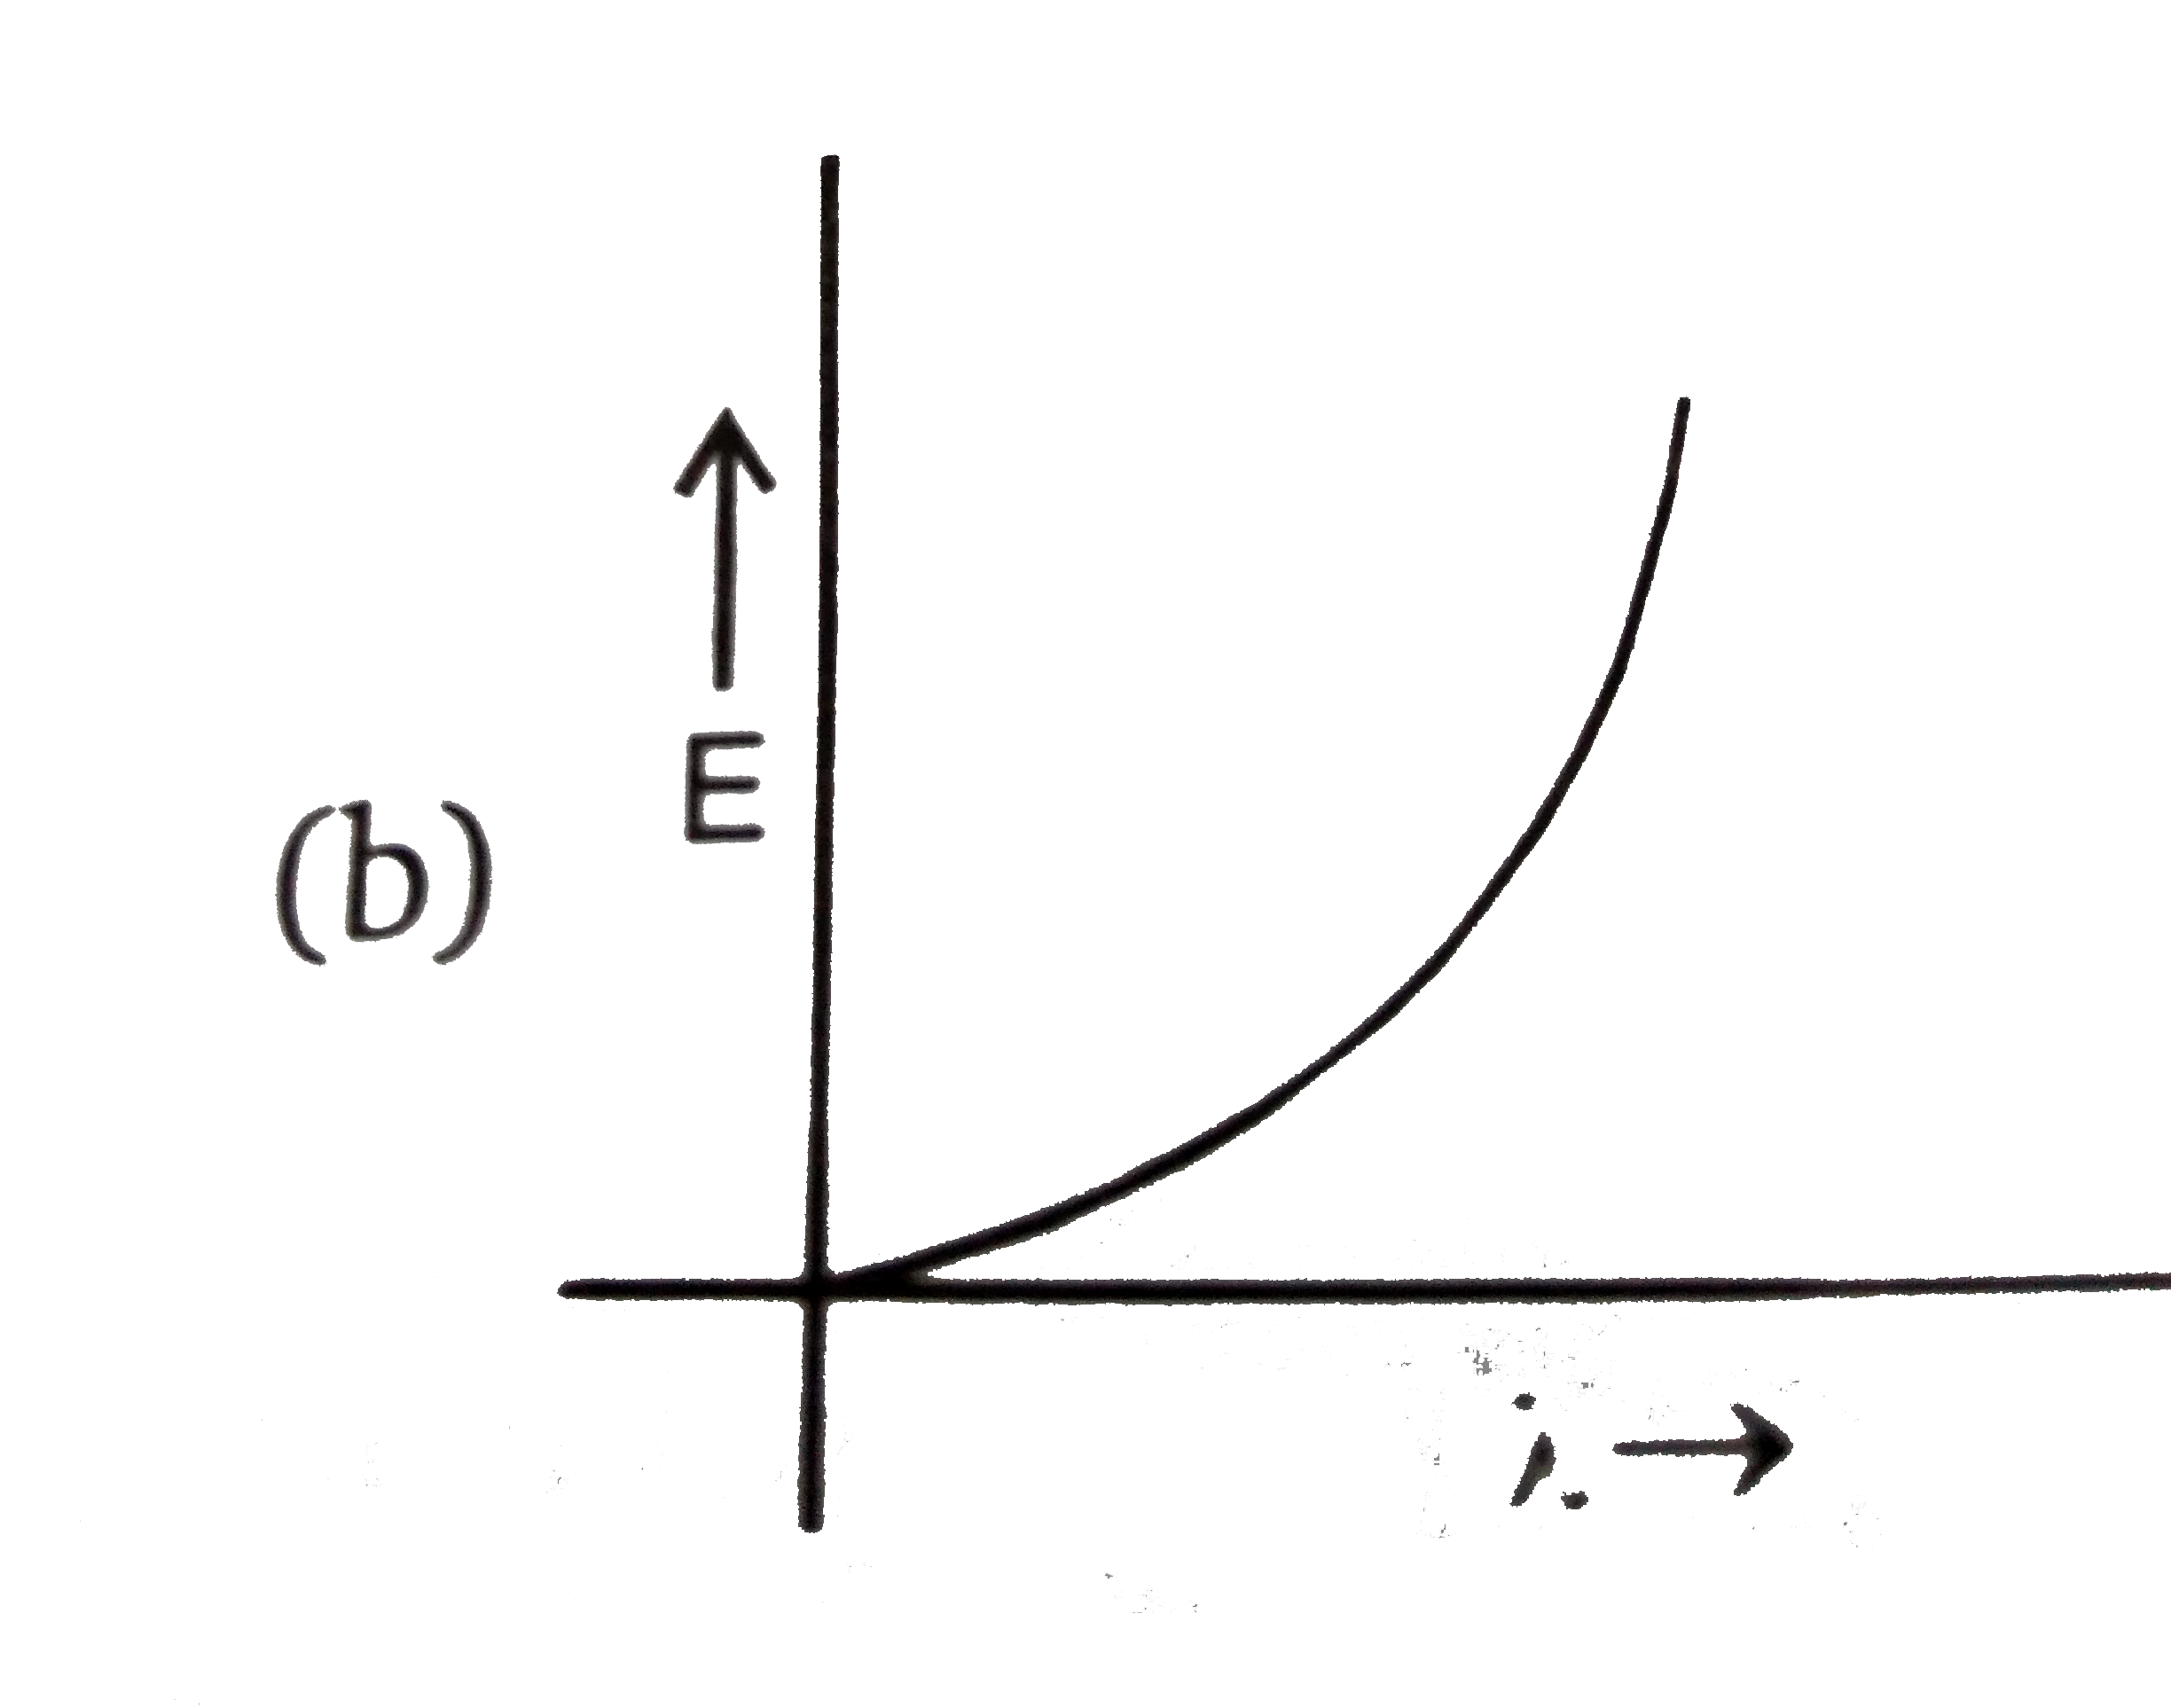
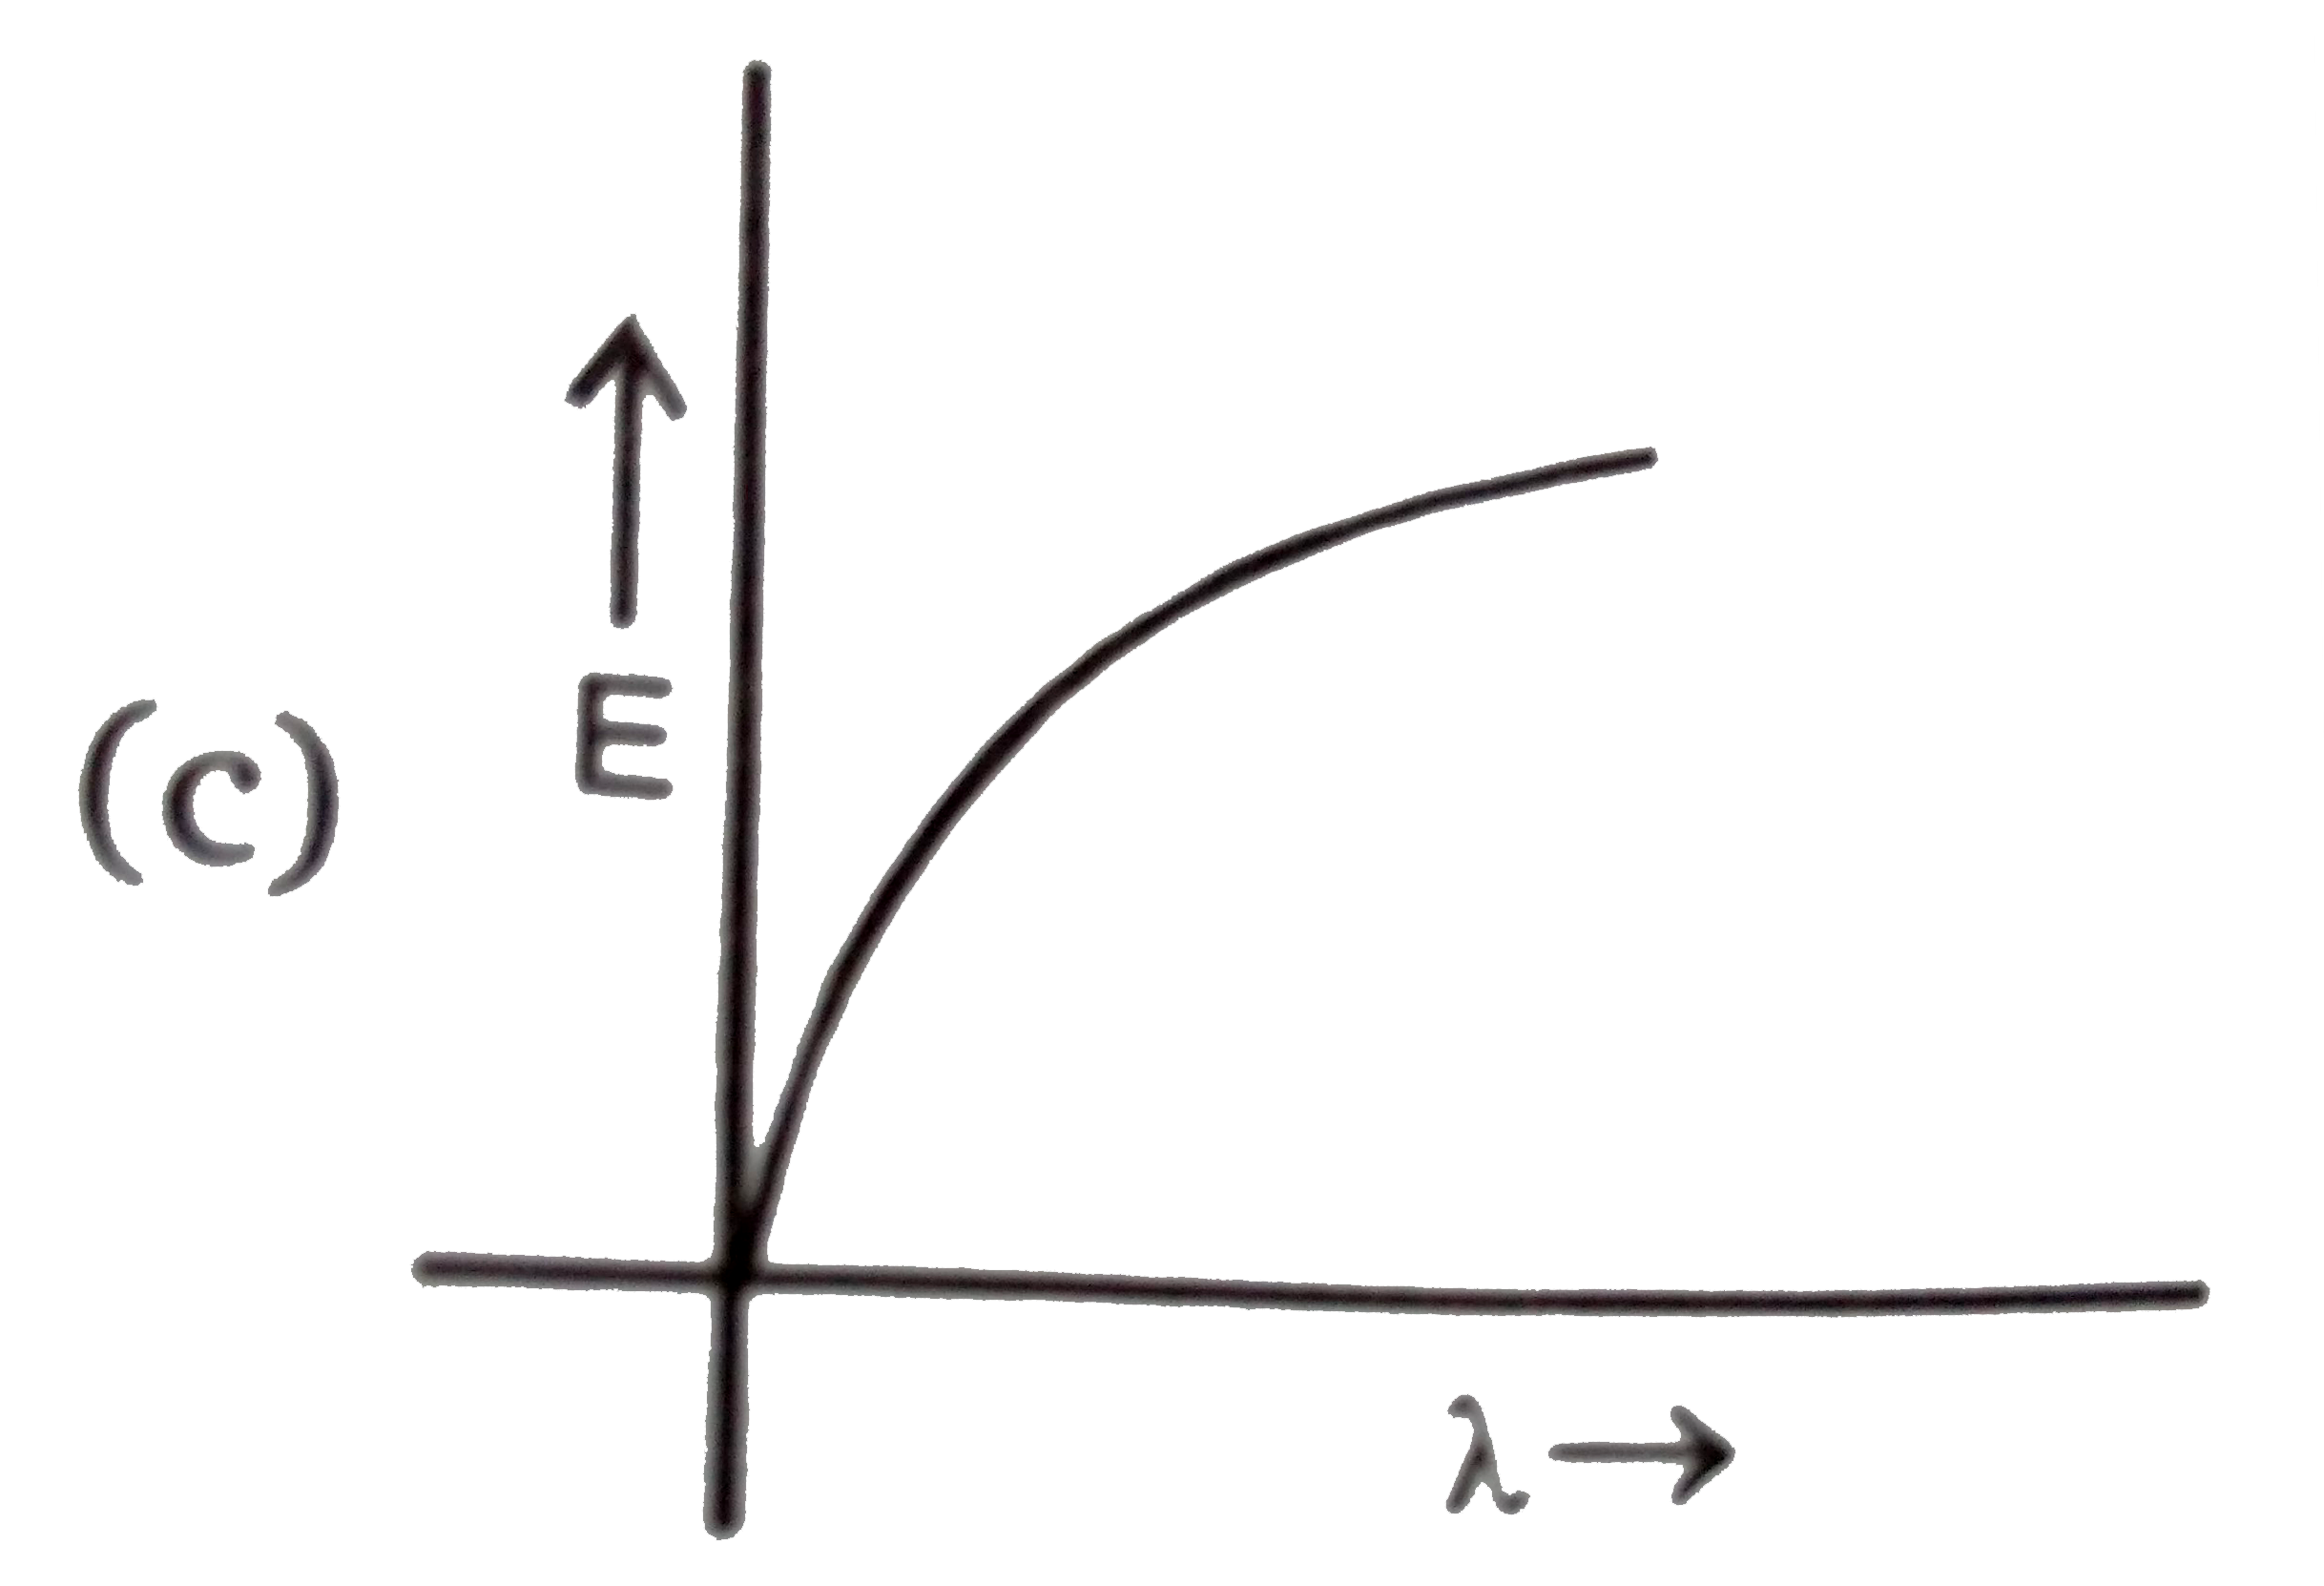
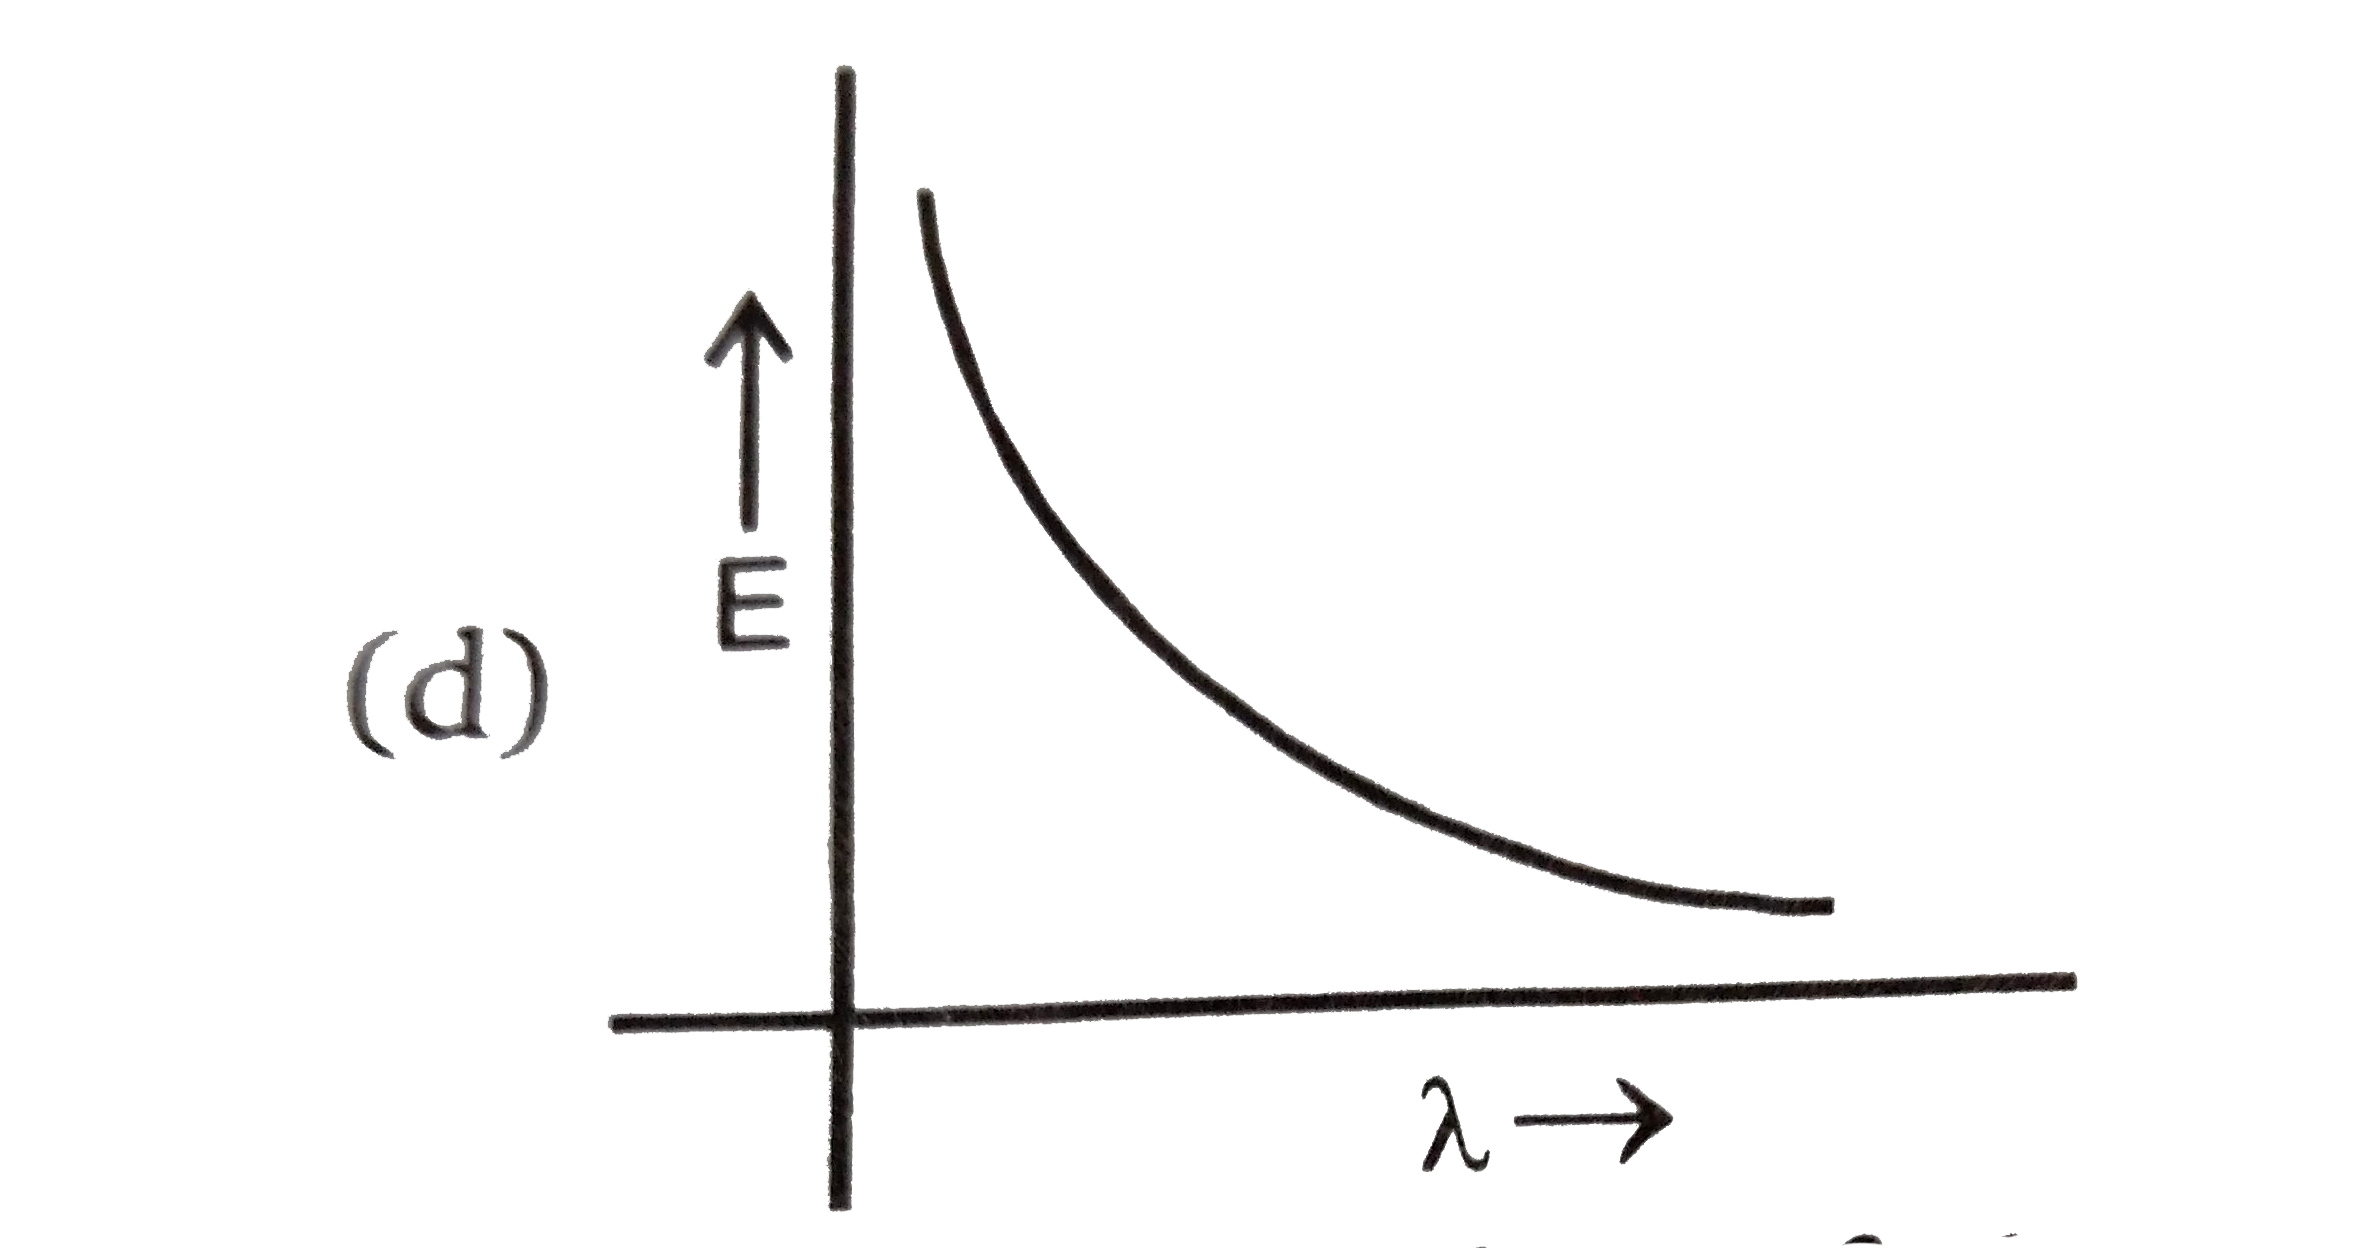
Which graph shows how the energy E of a photon of light is related to its wavelengths (λ)?


The correct Answer is:D
To determine how the energy E of a photon of light is related to its wavelength λ, we can follow these steps:
1. Understanding the Relationship:
The energy E of a photon is given by the equation:
E=hν
where h is Planck's constant and ν is the frequency of the light.
2. Relating Frequency to Wavelength:
The frequency ν is related to the wavelength λ by the equation:
c=νλ
where c is the speed of light. Rearranging this gives:
ν=cλ
3. Substituting Frequency into Energy Equation:
Now, substituting the expression for frequency into the energy equation:
E=h(cλ)
This simplifies to:
E=hcλ
4. Identifying the Relationship:
From the equation E=hcλ, we can see that energy E is inversely proportional to wavelength λ:
E∝1λ
5. Graphical Representation:
Since E is inversely proportional to λ, the graph of E versus λ will be a hyperbola. This means that as the wavelength increases, the energy decreases, and vice versa.
6. Choosing the Correct Graph:
Among the given options, the graph that represents an inverse relationship (hyperbola) is the correct one. The other options (parabola, linear, etc.) do not represent this relationship.
Conclusion:
The correct graph that shows how the energy E of a photon of light is related to its wavelength λ is a hyperbolic graph.
---
The energy E of a photon is given by the equation:
E=hν
where h is Planck's constant and ν is the frequency of the light.
The frequency ν is related to the wavelength λ by the equation:
c=νλ
where c is the speed of light. Rearranging this gives:
ν=cλ
Now, substituting the expression for frequency into the energy equation:
E=h(cλ)
This simplifies to:
E=hcλ
From the equation E=hcλ, we can see that energy E is inversely proportional to wavelength λ:
E∝1λ
Since E is inversely proportional to λ, the graph of E versus λ will be a hyperbola. This means that as the wavelength increases, the energy decreases, and vice versa.
Among the given options, the graph that represents an inverse relationship (hyperbola) is the correct one. The other options (parabola, linear, etc.) do not represent this relationship.
The correct graph that shows how the energy E of a photon of light is related to its wavelength λ is a hyperbolic graph.
Topper's Solved these Questions
- ATOMIC STUCTUREBOOK - NARENDRA AWASTHI ENGLISHCHAPTER - ATOMIC STUCTUREEXERCISE - level 2
30 Videos
- ATOMIC STUCTUREBOOK - NARENDRA AWASTHI ENGLISHCHAPTER - ATOMIC STUCTUREEXERCISE - Level 3 (Passage 1)
3 Videos
- CHEMICAL EQUILIBRIUMBOOK - NARENDRA AWASTHI ENGLISHCHAPTER - CHEMICAL EQUILIBRIUMEXERCISE - Match the column
1 Videos
Similar Questions
Knowledge Check
What will be the energy of a photon which corresponds to the wavelength of 0.50 Å?
A3.98×10−15JB3×1015JC3.9×108JD3×10−34J
Which graph shows zero activation energy ?
View SolutionWhat is the energy of photon whose wavelength is 6840Å ?
View SolutionThe log - log graph between the energy E of an electron and its de - Broglie wavelength λ will be
View SolutionCalculate the momentum of a photon of light of wavelength 500nm .
View SolutionWhat is the wavelength of a photon of energy 1 eV?
View SolutionCalculate the ratio of the energy of a photon of wavelength 3000 Å to that of a photon of wavelength 6000Å respectively
View SolutionIf the energy of a photon is E, then its momentum is (c is velocity of light )
View Solution
