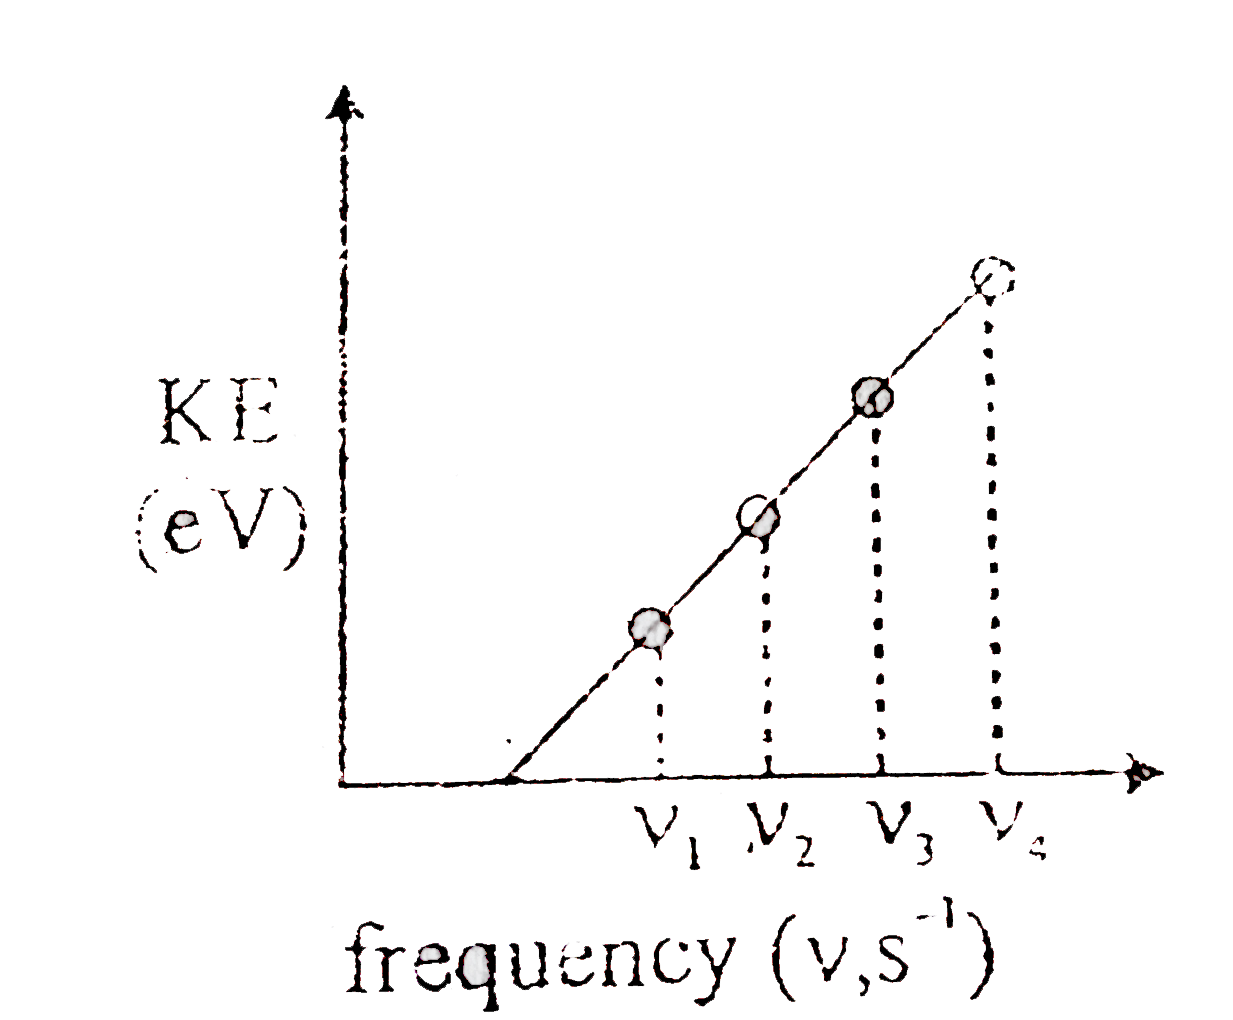
A plot of Gibbs energy of a reaction mixture against the exent of the reaftion is :
minimum at eqilibrium
zero at equilibrium
miximum at equilibrium
None of these
The correct Answer is:A
To solve the question regarding the plot of Gibbs energy of a reaction mixture against the extent of the reaction, we will follow these steps:
1. Understanding Gibbs Energy (G):
- Gibbs energy (G) is a thermodynamic potential that can be used to predict the direction of chemical reactions and the position of equilibrium.
2. Defining Spontaneous and Non-Spontaneous Reactions:
- A spontaneous reaction has a Gibbs energy change (ΔG) that is less than zero (ΔG < 0).
- A non-spontaneous reaction has a Gibbs energy change that is greater than zero (ΔG > 0).
3. Graphical Representation:
- When we plot Gibbs energy (G) against the extent of the reaction, we can visualize how G changes as the reaction proceeds from reactants to products.
- For a spontaneous reaction, the graph typically shows a downward trend until it reaches a minimum point (equilibrium) and then starts to rise again.
- For a non-spontaneous reaction, the graph starts higher and decreases to a minimum point (equilibrium) before rising again.
4. Identifying Equilibrium:
- At equilibrium, the Gibbs energy is at a minimum. This is because the system has reached a state where the forward and reverse reactions occur at the same rate, and there is no net change in the concentrations of reactants and products.
- At this point, ΔG = 0, which signifies that the system is at equilibrium.
5. Conclusion:
- Based on the understanding of Gibbs energy and its behavior in spontaneous and non-spontaneous reactions, we conclude that the plot of Gibbs energy against the extent of the reaction will show a minimum at equilibrium.
Final Answer:
The plot of Gibbs energy of a reaction mixture against the extent of the reaction is minimum at equilibrium.
---
- Gibbs energy (G) is a thermodynamic potential that can be used to predict the direction of chemical reactions and the position of equilibrium.
- A spontaneous reaction has a Gibbs energy change (ΔG) that is less than zero (ΔG < 0).
- A non-spontaneous reaction has a Gibbs energy change that is greater than zero (ΔG > 0).
- When we plot Gibbs energy (G) against the extent of the reaction, we can visualize how G changes as the reaction proceeds from reactants to products.
- For a spontaneous reaction, the graph typically shows a downward trend until it reaches a minimum point (equilibrium) and then starts to rise again.
- For a non-spontaneous reaction, the graph starts higher and decreases to a minimum point (equilibrium) before rising again.
- At equilibrium, the Gibbs energy is at a minimum. This is because the system has reached a state where the forward and reverse reactions occur at the same rate, and there is no net change in the concentrations of reactants and products.
- At this point, ΔG = 0, which signifies that the system is at equilibrium.
- Based on the understanding of Gibbs energy and its behavior in spontaneous and non-spontaneous reactions, we conclude that the plot of Gibbs energy against the extent of the reaction will show a minimum at equilibrium.
The plot of Gibbs energy of a reaction mixture against the extent of the reaction is minimum at equilibrium.
Similar Questions
Knowledge Check
Assertion : A catalyst increases the rate of reaction without itself undergoing any permanent chemical change.
Reason : A catalyst changes the Gibbs energy (ΔG) of the reaction and equilibrium constant of the reaction.AIf both assertion and reason are true and reason is the correct explanation of assertion.BIf both assertion and reason are true but reason is not the correct explanation of assertion.CIf assertion is true but reason is false.DIf both assertion and reason are false.
In the reaction
PCl5(g)⇔PCl3(g)+Cl2(g)
a graph in plotted to show the variation of rate of forward and backward
reactions against time. Which of the following is correct?
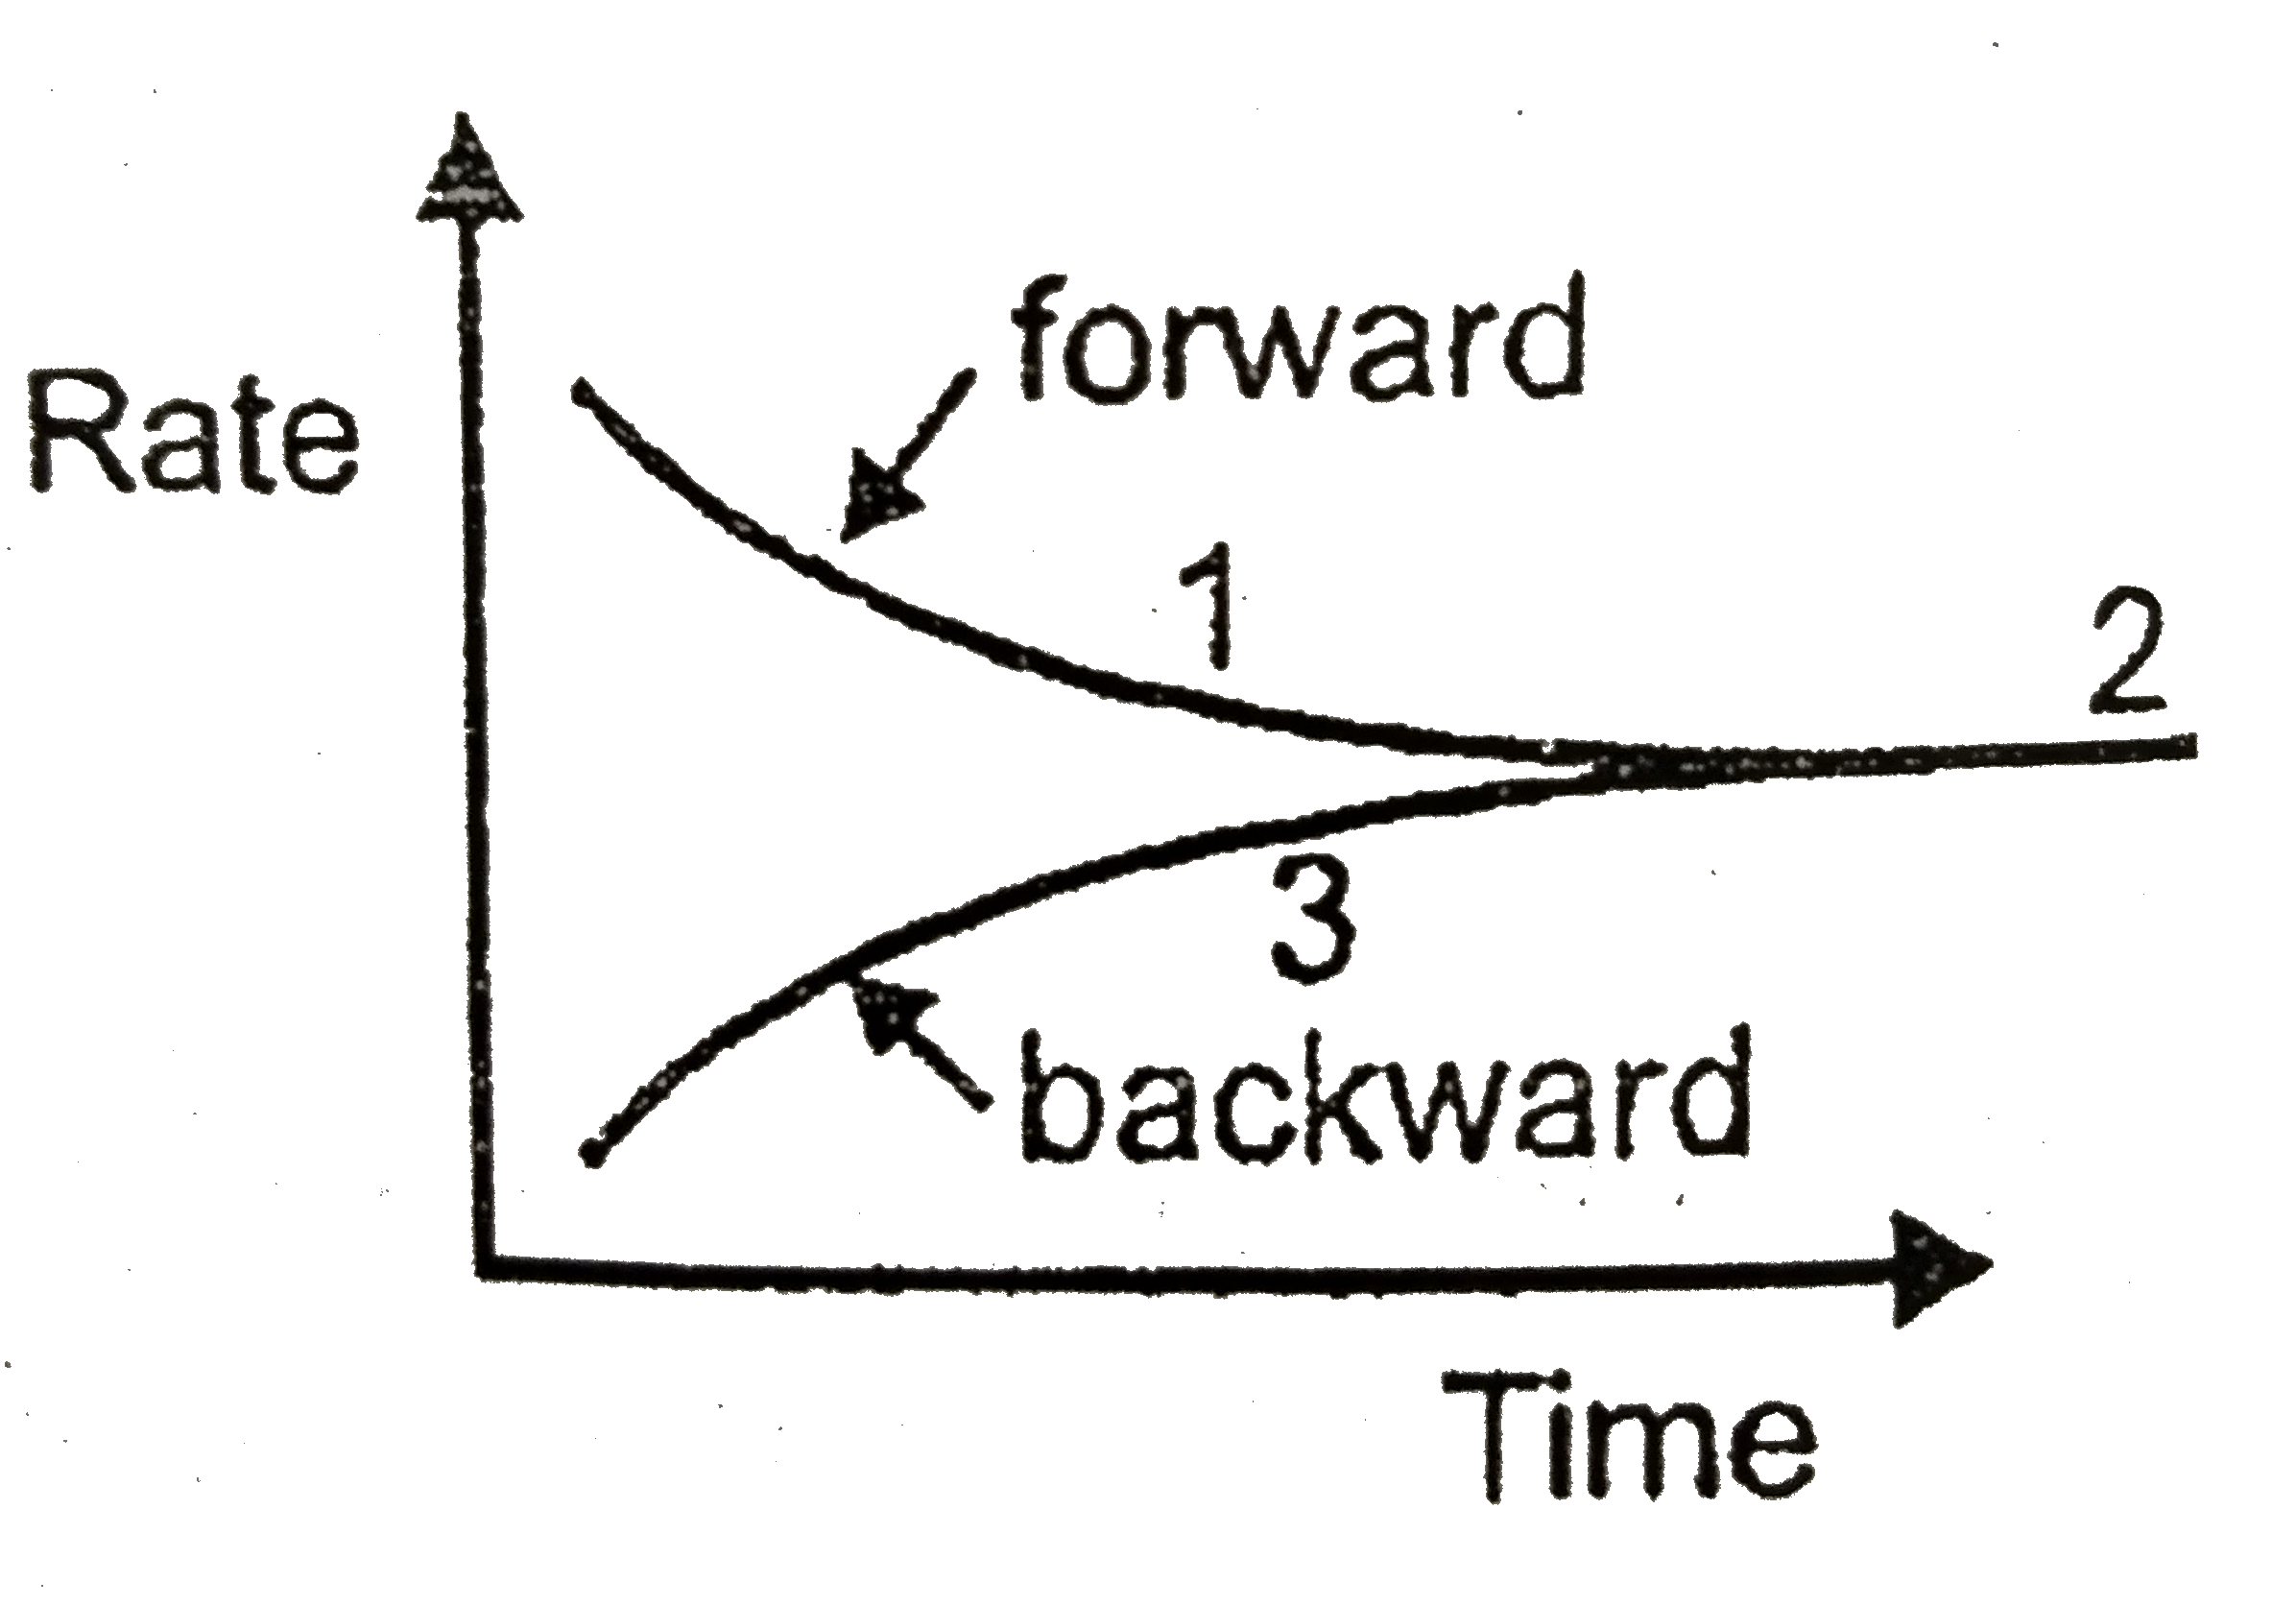
Q>K Q=K Q<K
View SolutionWhich of the following can help to predict the rate of reaction if the standard Gibb's free energy of reaction (ΔrG∘) is known ?
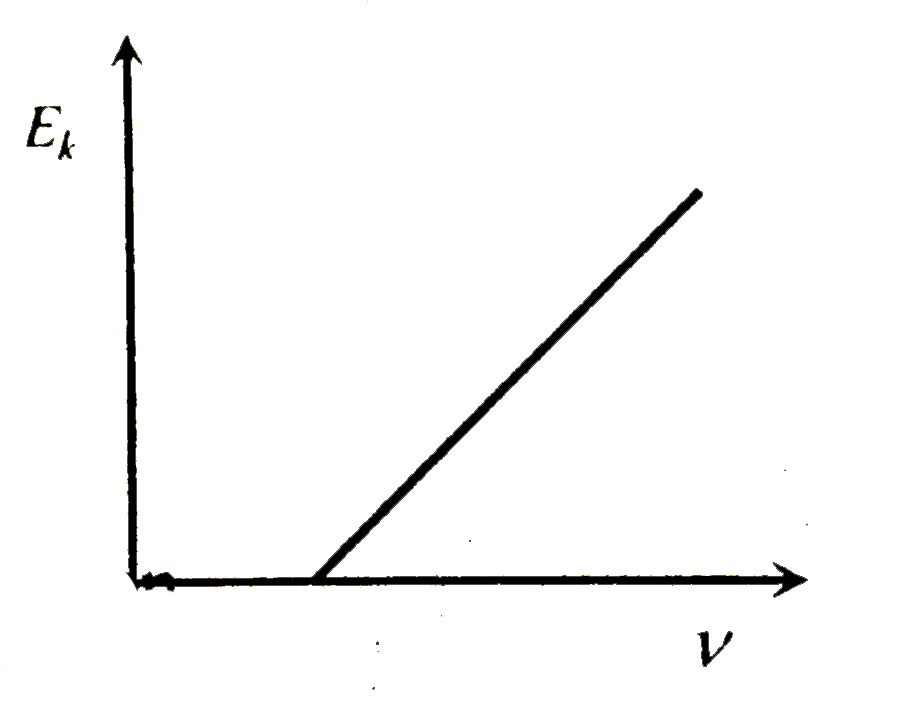
View SolutionFor the photoelectric effect, the maximum kinetic energy Ek of the emitted photoelectrons is plotted against the frequency of the incident photons as shown in the figure. The slope of the curve gives
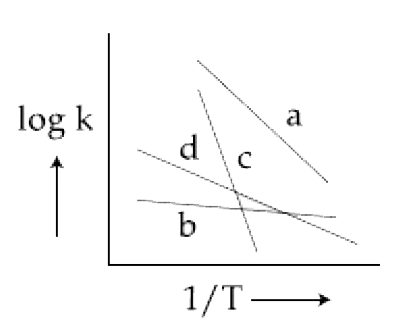
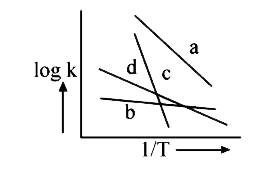
View SolutionConsider the following plots of rate constant versus 1T for four different reactions. Which of the following orders is correct for the activation energies of these reactions ?
View SolutionWhat is the effect of catalyst on:
(i) Gibbs energy (ΔG) and
(ii) activation energy of a rection ?
View SolutionGrowth plotted against time gives a
View SolutionConsider the following plots of rate constant versus 1T for four different reactions. Which of the following orders is correct for the activation energies of these reactions?
View Solution

