Growth plotted against time gives a
Parabolic curve
Sigmoid curve
Upright line
Horizontal line
The correct Answer is:B
To solve the question "Growth plotted against time gives a:", we will analyze the options provided and understand the concept of growth phases in biological organisms.
1. Understanding Growth Phases:
- Biological growth can be divided into distinct phases: lag phase, log (exponential) phase, stationary phase, and death phase. Each of these phases represents a different rate of growth.
2. Lag Phase:
- In the lag phase, the growth rate is slow as the cells are preparing for division. This phase is characterized by little to no increase in cell number.
3. Log Phase:
- The log phase is where the growth rate accelerates. Cells are actively dividing, and the population increases exponentially. This is the phase where maximum growth occurs.
4. Stationary Phase:
- In the stationary phase, the growth rate slows down and stabilizes. The number of new cells created is equal to the number of cells dying, resulting in a constant population size.
5. Death Phase:
- In the death phase, the number of dying cells exceeds the number of new cells being produced, leading to a decline in the overall population.
6. Plotting Growth Against Time:
- When we plot growth (on the y-axis) against time (on the x-axis), the resulting graph reflects these phases. The curve starts slowly during the lag phase, rises steeply during the log phase, levels off during the stationary phase, and then declines in the death phase.
7. Identifying the Curve Type:
- The resulting graph is an S-shaped curve, known as a sigmoid curve. This shape reflects the different phases of growth over time.
8. Conclusion:
- Therefore, when growth is plotted against time, it gives a sigmoid curve.
Final Answer:
The correct answer is: Sigmoid curve (Option 2).
- Biological growth can be divided into distinct phases: lag phase, log (exponential) phase, stationary phase, and death phase. Each of these phases represents a different rate of growth.
- In the lag phase, the growth rate is slow as the cells are preparing for division. This phase is characterized by little to no increase in cell number.
- The log phase is where the growth rate accelerates. Cells are actively dividing, and the population increases exponentially. This is the phase where maximum growth occurs.
- In the stationary phase, the growth rate slows down and stabilizes. The number of new cells created is equal to the number of cells dying, resulting in a constant population size.
- In the death phase, the number of dying cells exceeds the number of new cells being produced, leading to a decline in the overall population.
- When we plot growth (on the y-axis) against time (on the x-axis), the resulting graph reflects these phases. The curve starts slowly during the lag phase, rises steeply during the log phase, levels off during the stationary phase, and then declines in the death phase.
- The resulting graph is an S-shaped curve, known as a sigmoid curve. This shape reflects the different phases of growth over time.
- Therefore, when growth is plotted against time, it gives a sigmoid curve.
The correct answer is: Sigmoid curve (Option 2).
Similar Questions
In the reaction A+B→C+D, the rate (dxdt) when plotted against time 't' gives a straight line parallel to time aixs.
The order and rate of reaction will be:
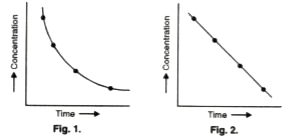
View SolutionIn the reaction A→ B , if the concentration of A is plotted against time, the curves obtained will be as shown in Fig. 1 and 2. Predict the order of the reactions.

View Solution
Knowledge Check
The growth of a plant or a part when plotted against time shows
(a) linear curve
(b) sigmoid curve
(c) hyperbola
(d) bell-shaped curveAlinear curveBsigmoid curveChyperbolaDbell-shaPed curve
In the reaction A→ B , if the concentration of A is plotted against time, the curves obtained will be as shown in Fig. 1 and 2. Predict the order of the reactions.

View SolutionIn the reaction A→ B , if the concentration of A is plotted against time, the curves obtained will be as shown in Fig. 1 and 2. Predict the order of the reactions.

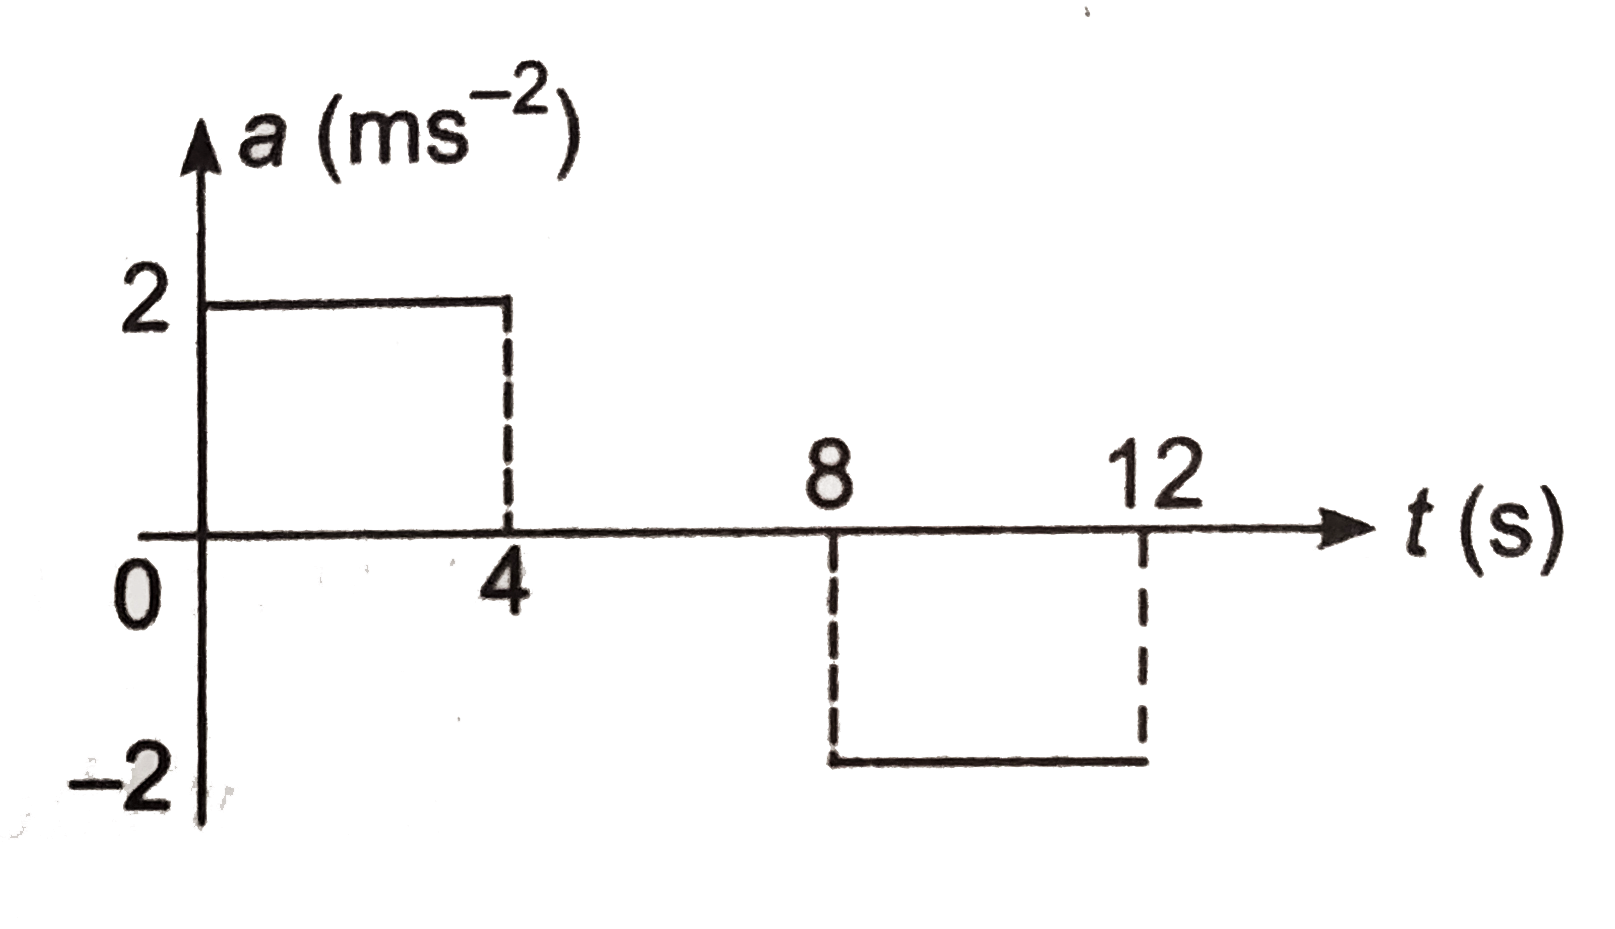
View SolutionA lift starts from rest. Its acceleration is plotted against time. When it comes to rest its height above its starting point is

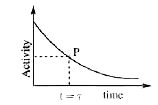
View SolutionThe activity of a certain radioactive sample is plotted against time in graph. If the initial slope of the curve is m, then find the slope of the curve at point P ?

View SolutionA stone is projected at time t=0 with a speed v0 at an angle θ with the horizontal in a uniform gravitational field. The rate of work done (P) by the gravitational force plotted against time (t) will be as.
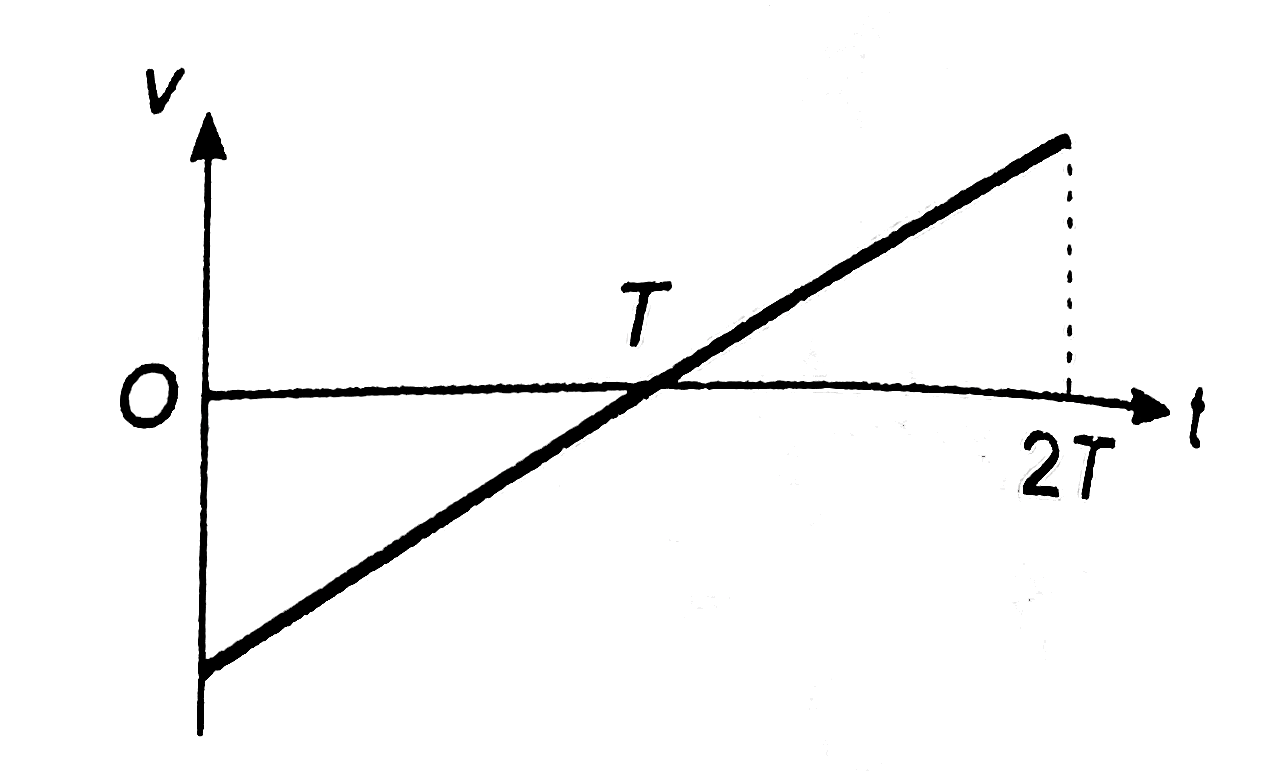
View SolutionThe figure shows the velocity (v) of a particle plotted against time (t).

View SolutionThe figure shows the velocity (v) of a particle plotted against time (t).

View Solution