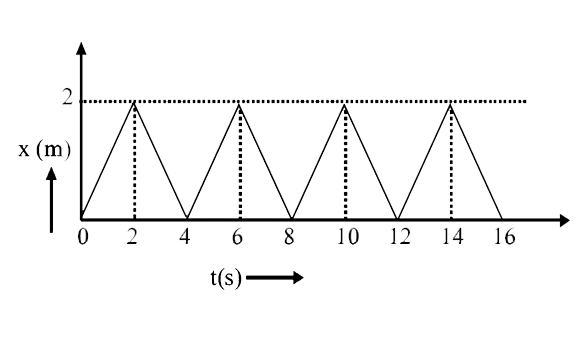
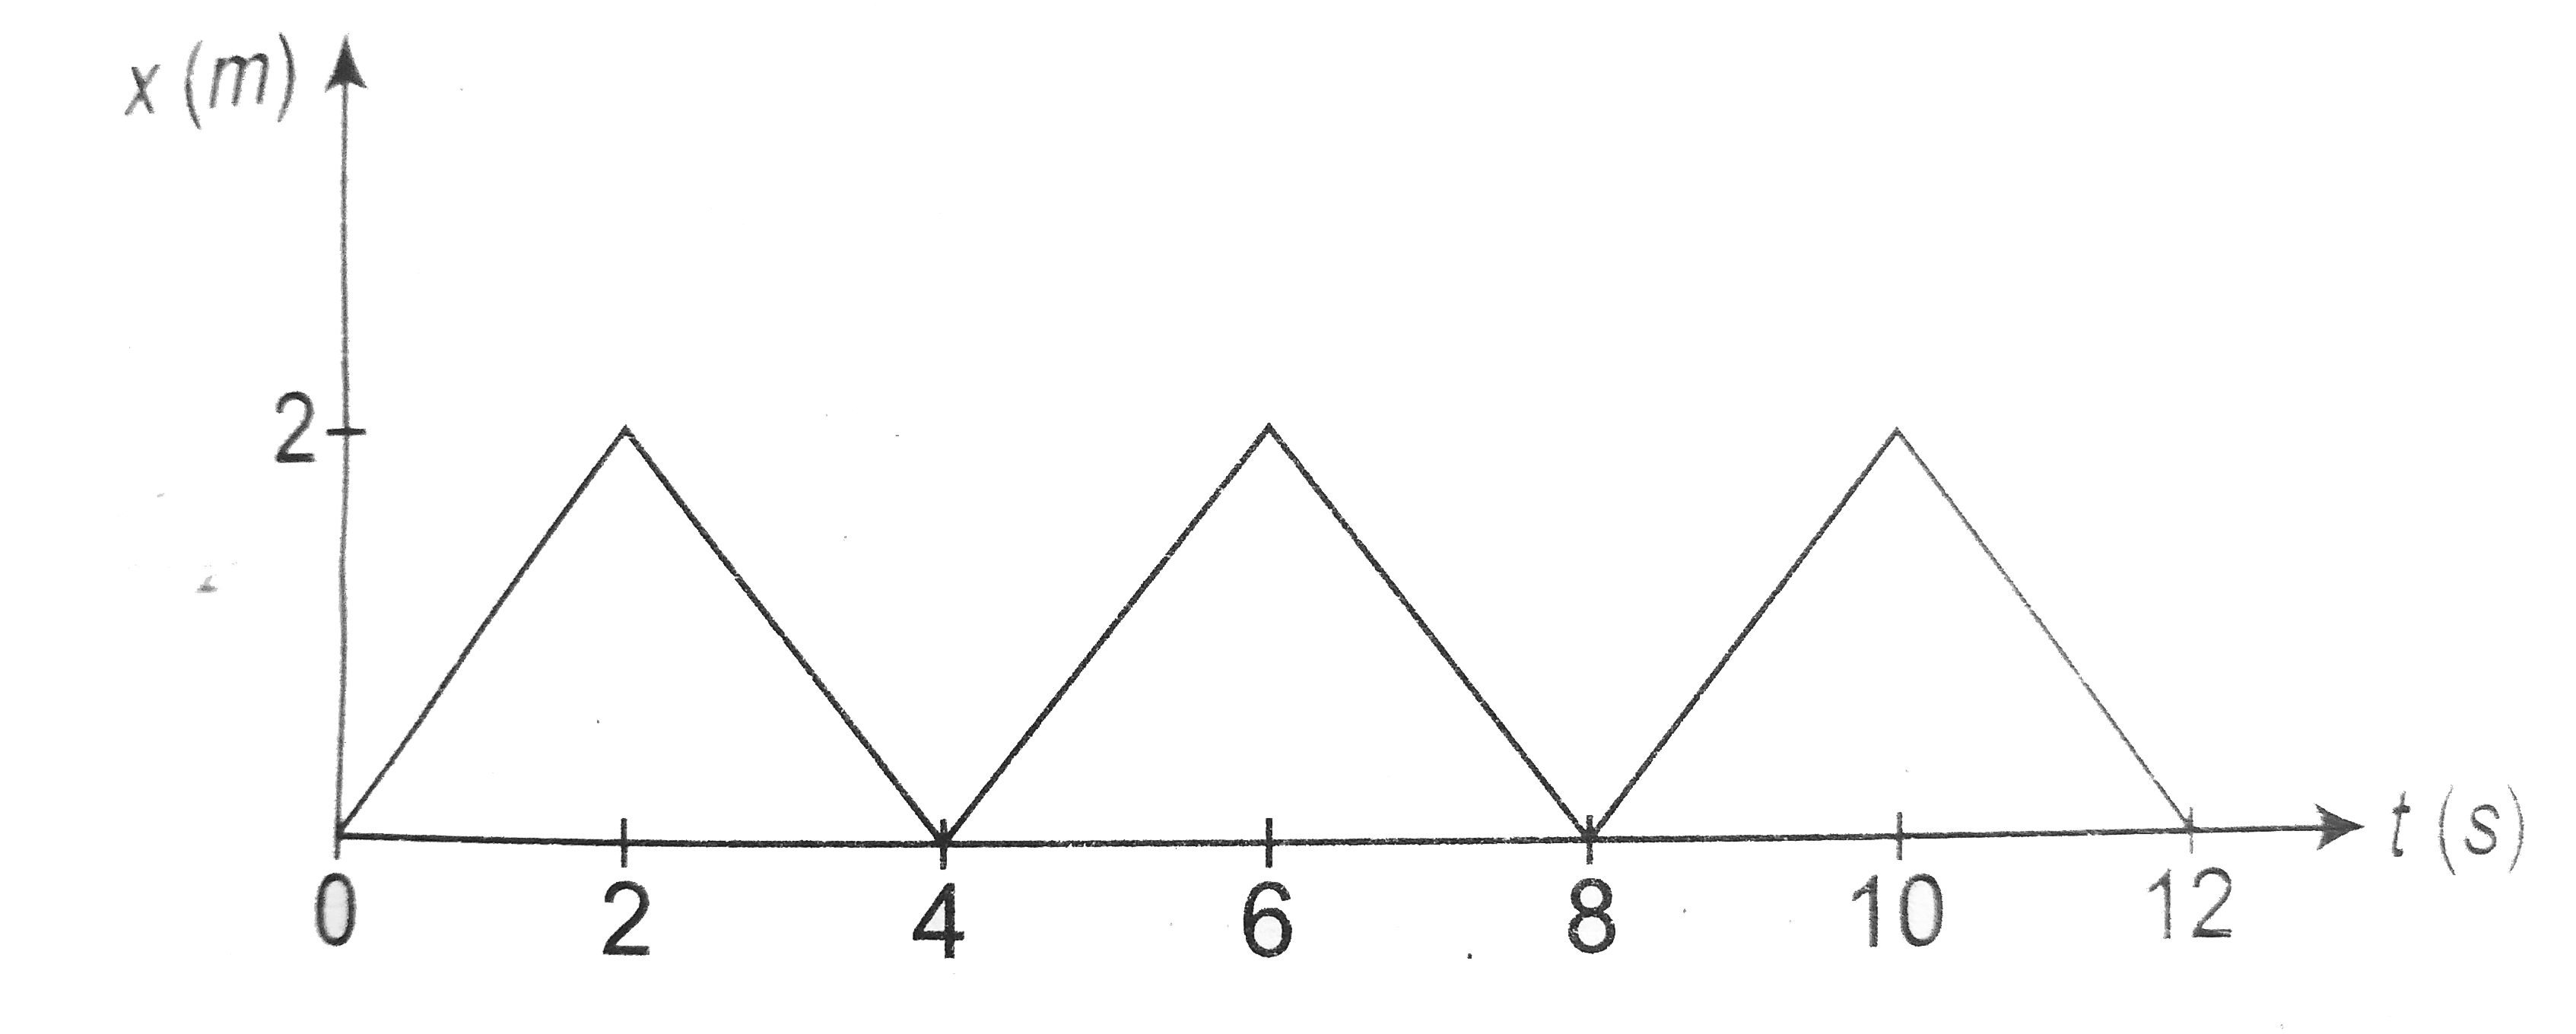
The figure shows the position-time (x-t) graph of one-dimensional motion of a body of mass 0.4kg. The magnitude of each impulse is
0.2 Ns
0.4 Ns
0.8 Ns
1.6 Ns
Step by step video & image solution for The figure shows the position-time (x-t) graph of one-dimensional motion of a body of mass 0.4kg. The magnitude of each impulse is by Physics experts to help you in doubts & scoring excellent marks in Class 11 exams.
Topper's Solved these Questions
Similar Questions
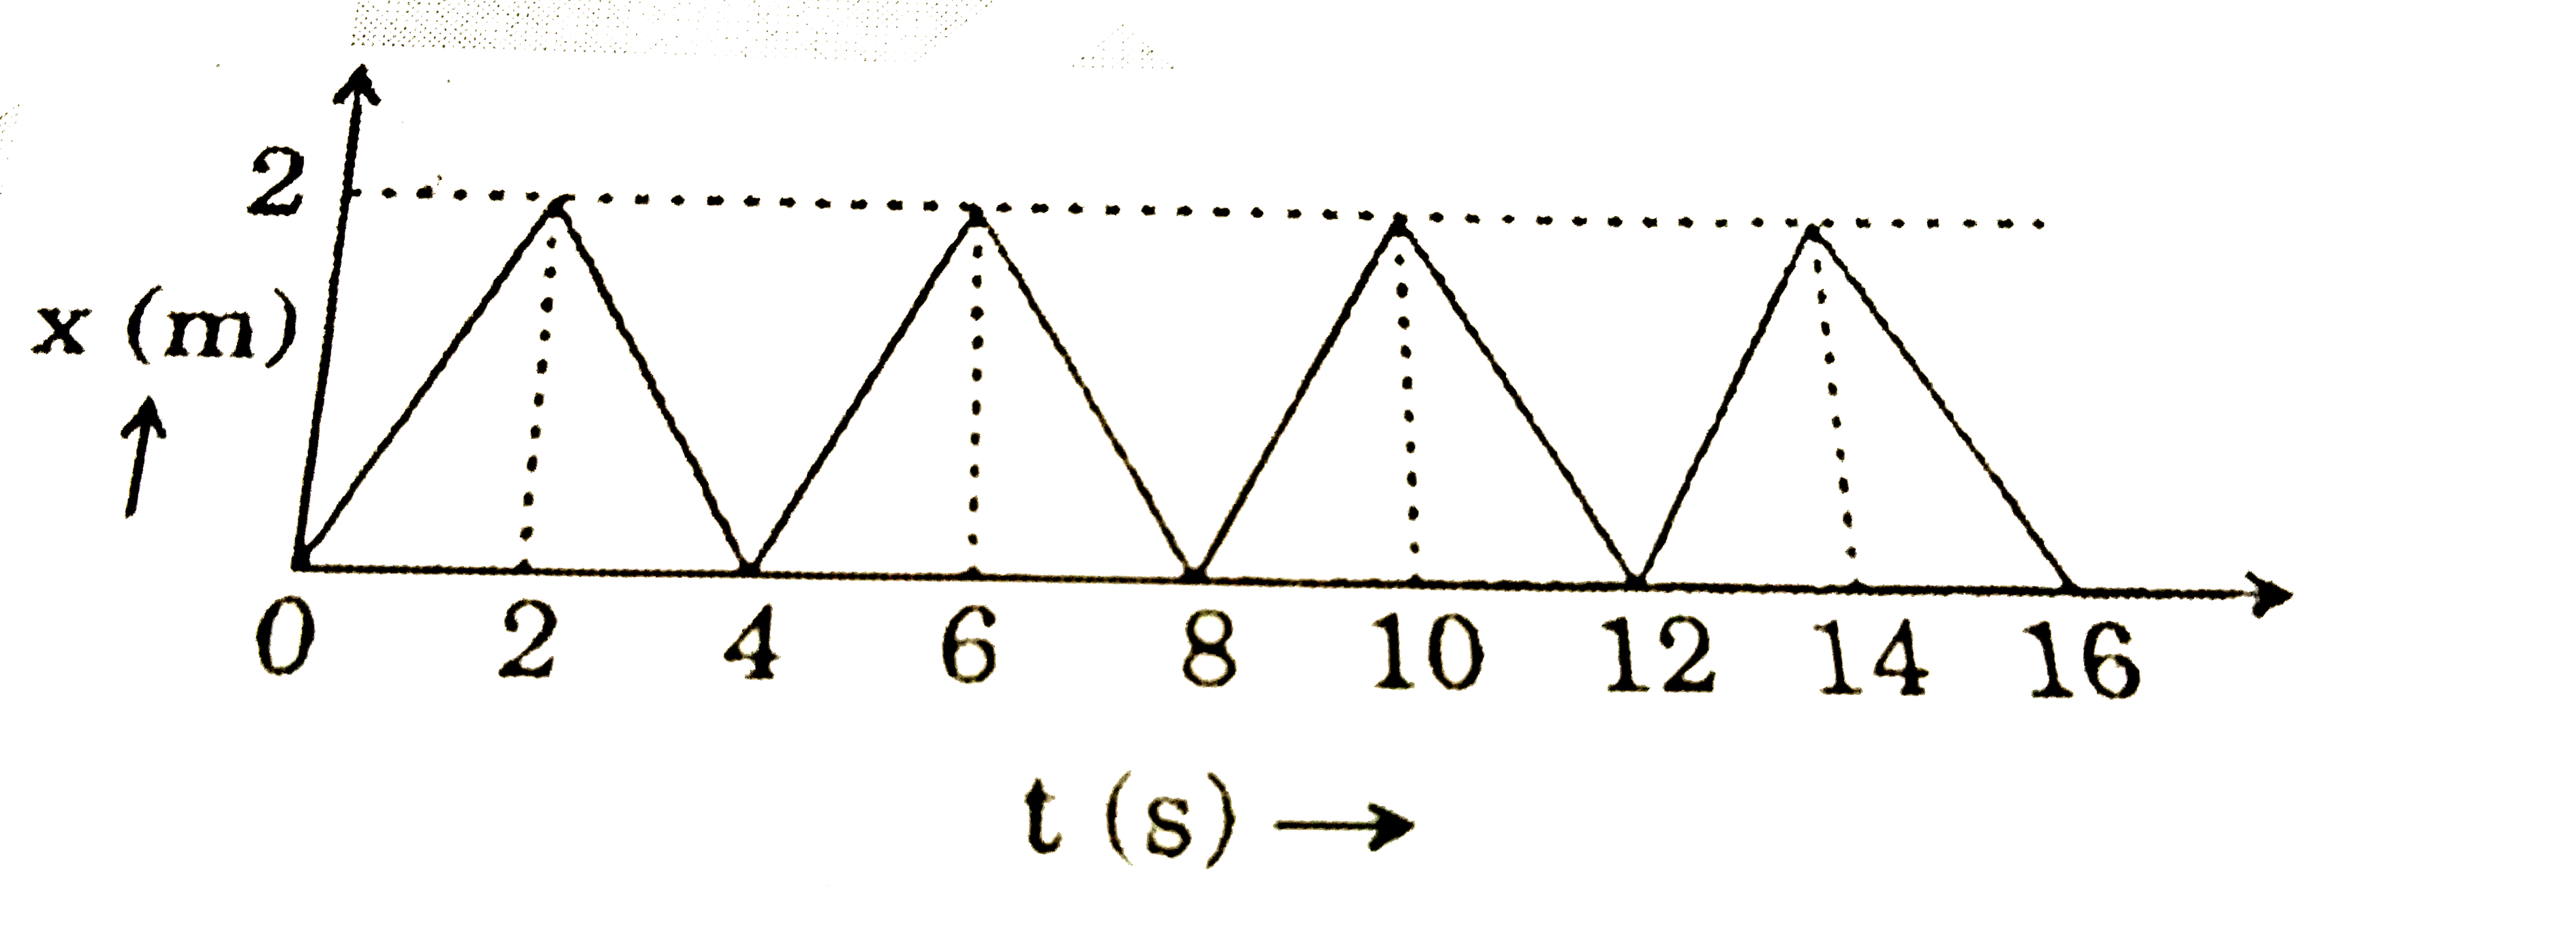
The figure shows the position - time (x - t) graph of one-dimensional motion of a body of mass 0.4 kg. The magnetic of each impulse is
 View Solution
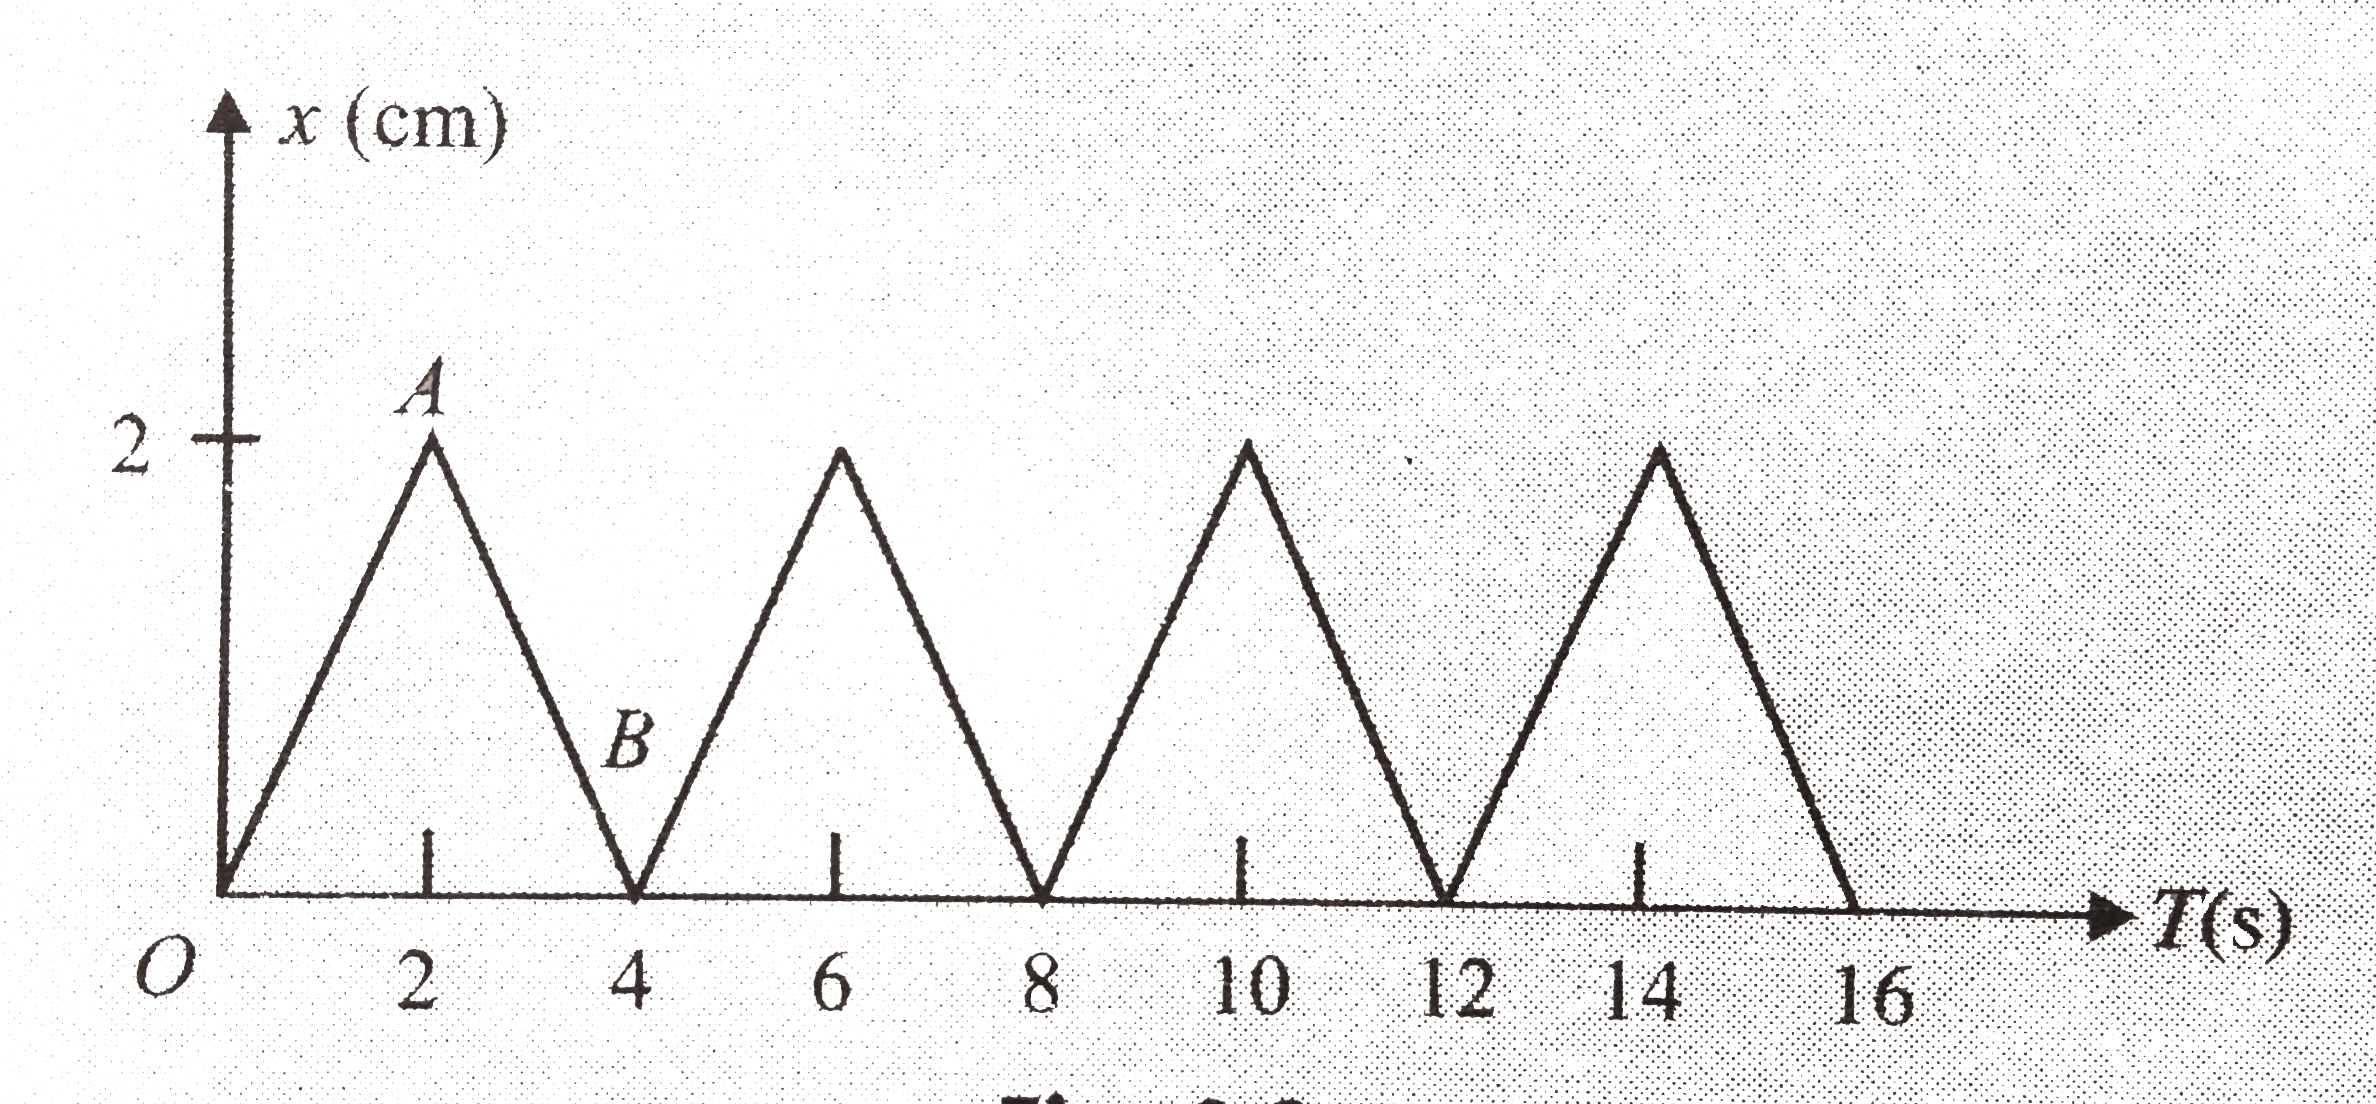
Figure shows the position-time graph of a particle of mass 0.04kg. Suggest a suitable physical context for this motion. What is the time between two consecutive impulses received by the particle? What is the magnitude of each impluse?
 View Solution
Knowledge Check
- Question 1 - Select One
The figure shows the position – time (x – t) graph of one – dimensional motion of a body of mass 0.4 kg. The magnitude of each impulse is:
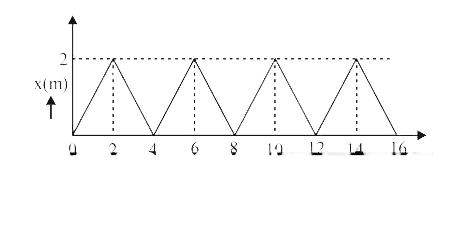 A0.4 NsB0.8 NsC1.6 NsD0.2 Ns
 - Question 2 - Select One
Figure shows the position-time (x-t) graph of one dimensional motion of a mass 500g. What is the time interval between two consecutive impulses received by the body?
 A2sB4sC6sD8s
 - Question 3 - Select One or More
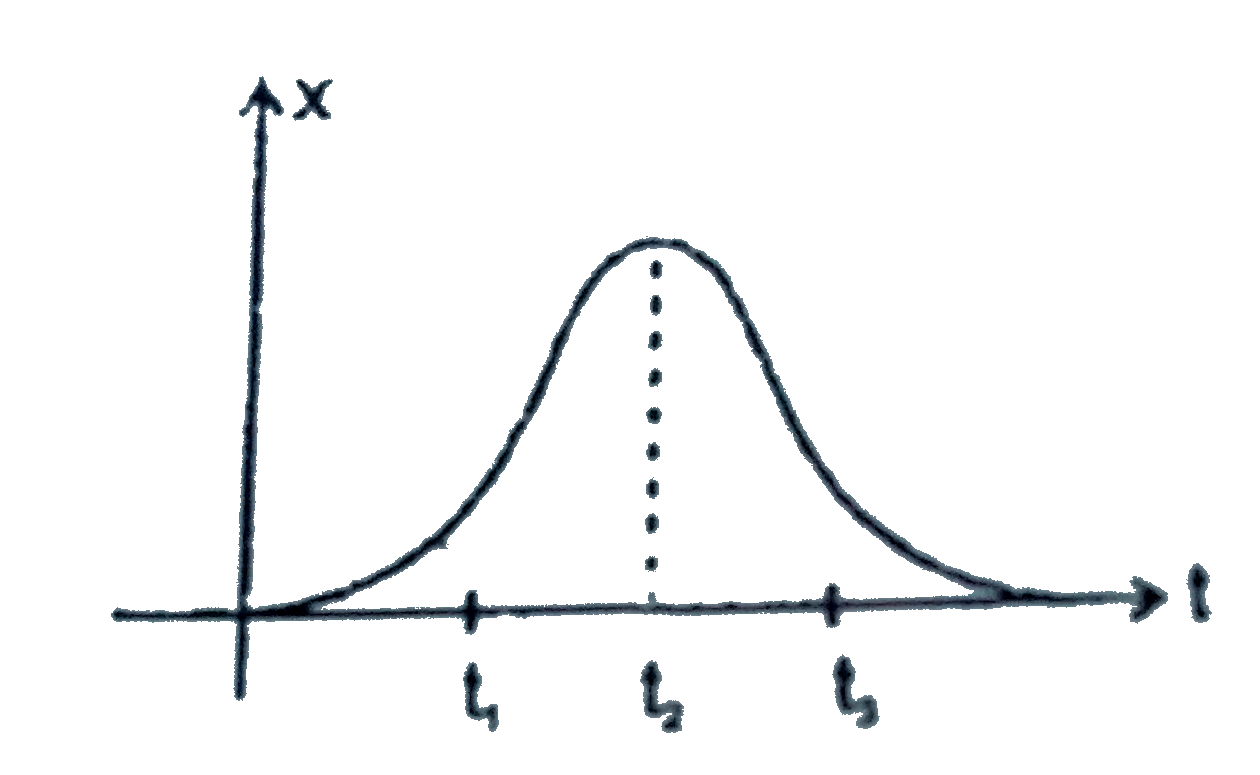
Given figure shows position-time curve during one dimentional motion of body. Select correct statements.AAt t1,vx and ax are in same direction.BAt t2,vx and ax are in same direction.CAt t1,vx and ax are in opposite direction.DAt t2,vx and ax are in opposite direction.
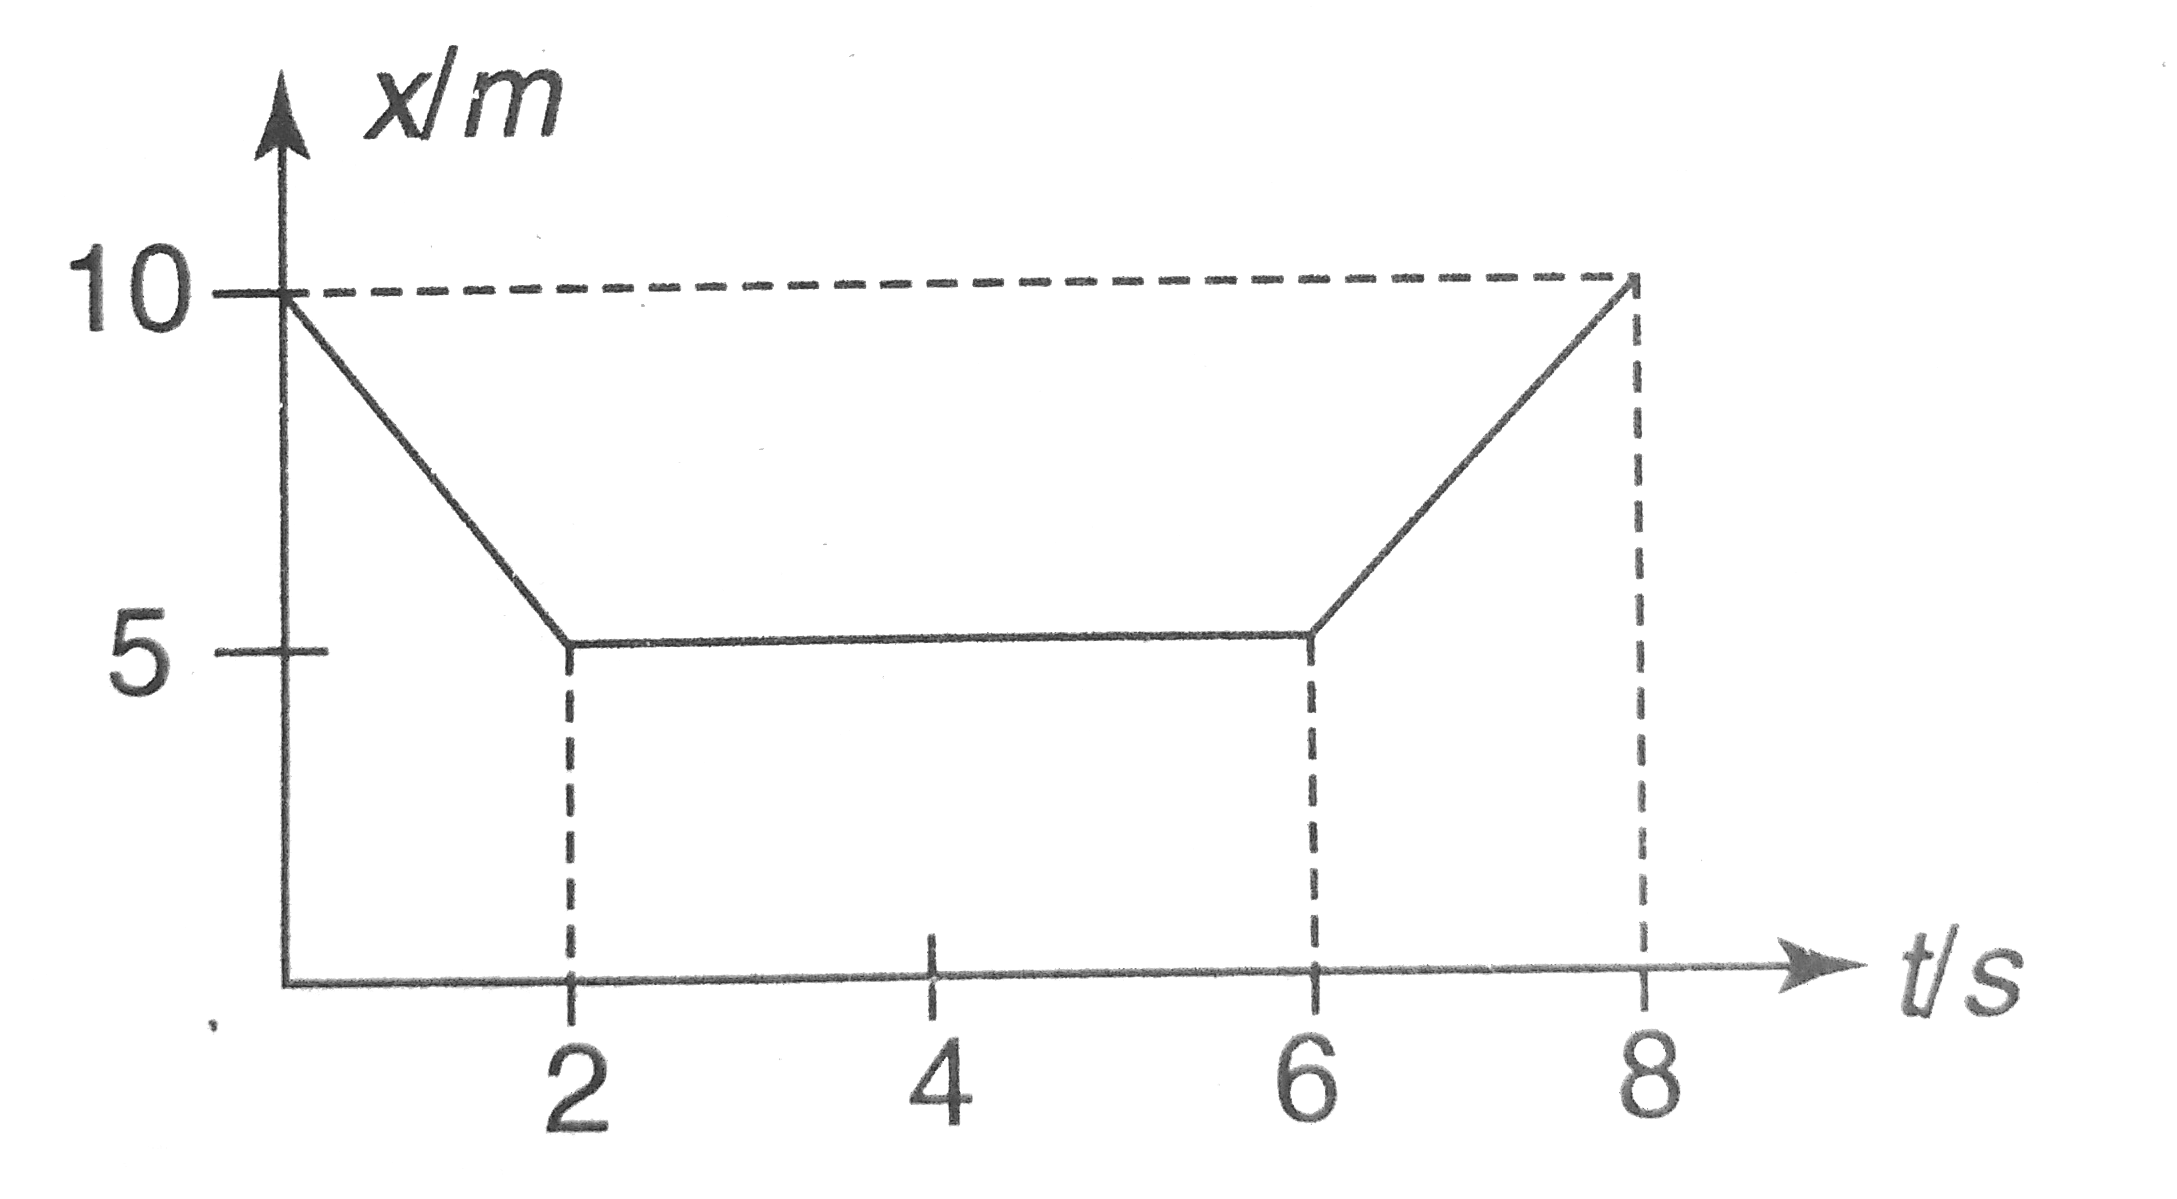
Figure shows the position time graph for a particle in one dimensional motion. What is the displacement of the particle in first 4 seconds ?
 View Solution
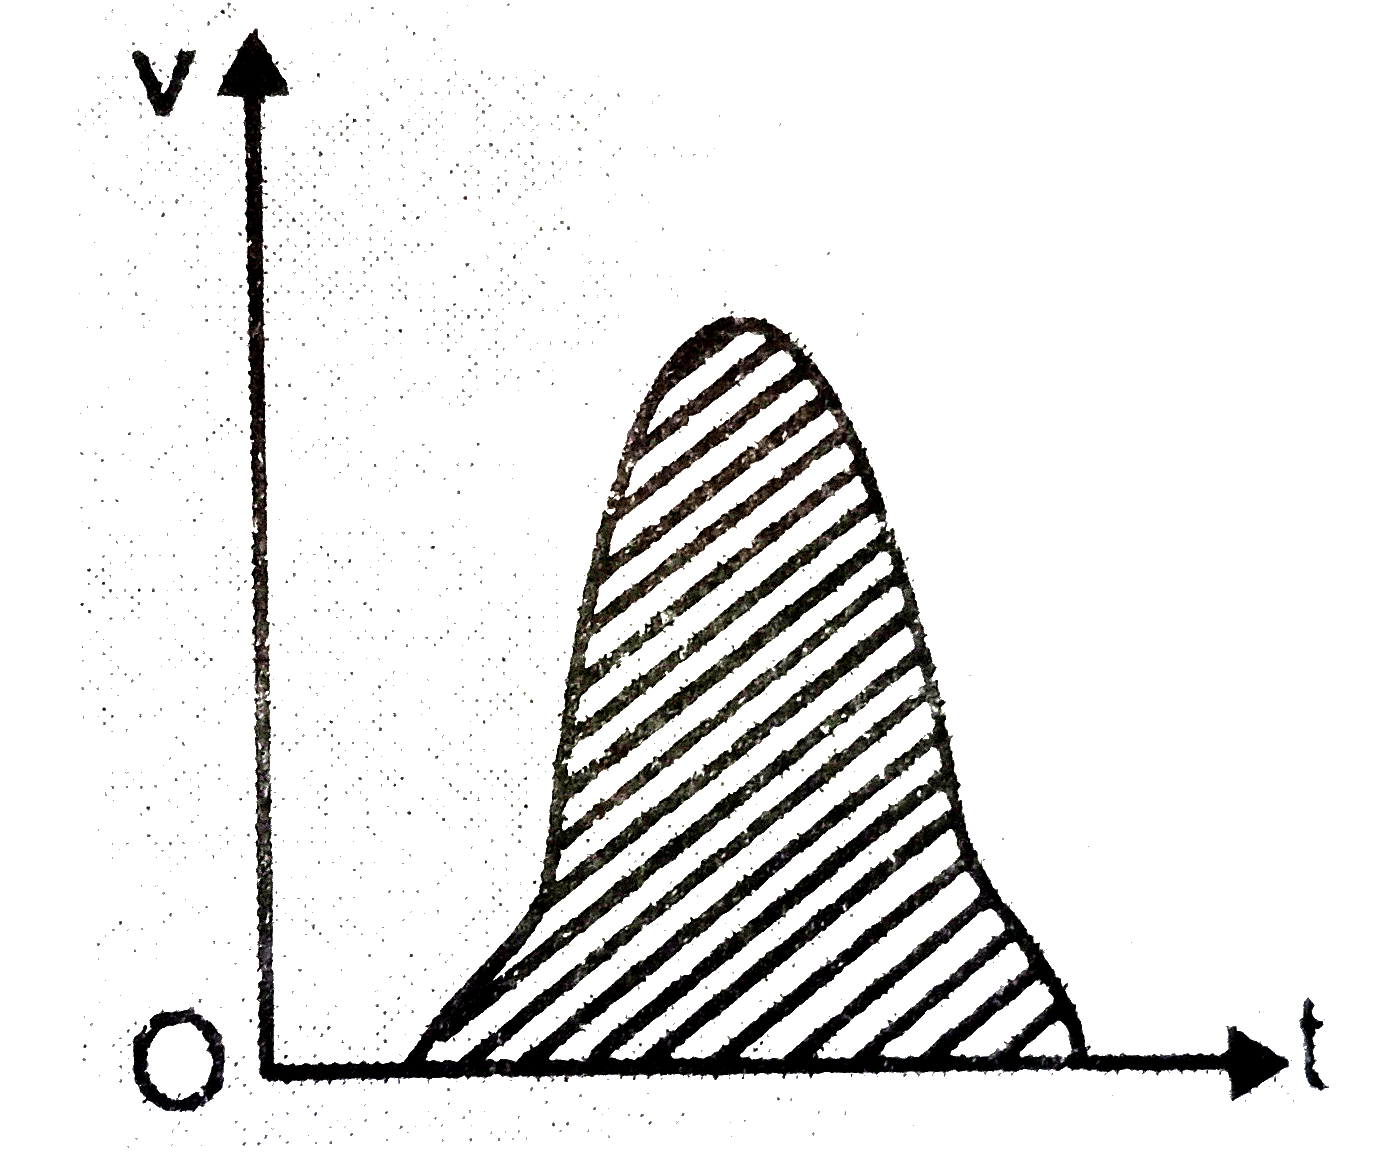
Figure below shows the velocity-time graph of a one dimensional motion. Which of the following characteristic of the particle is represented by the shaded area?
 View Solution
In the figure given below, the position time graph of a particle of mass 0.1kg is shown. The impulse at t=2 sec is
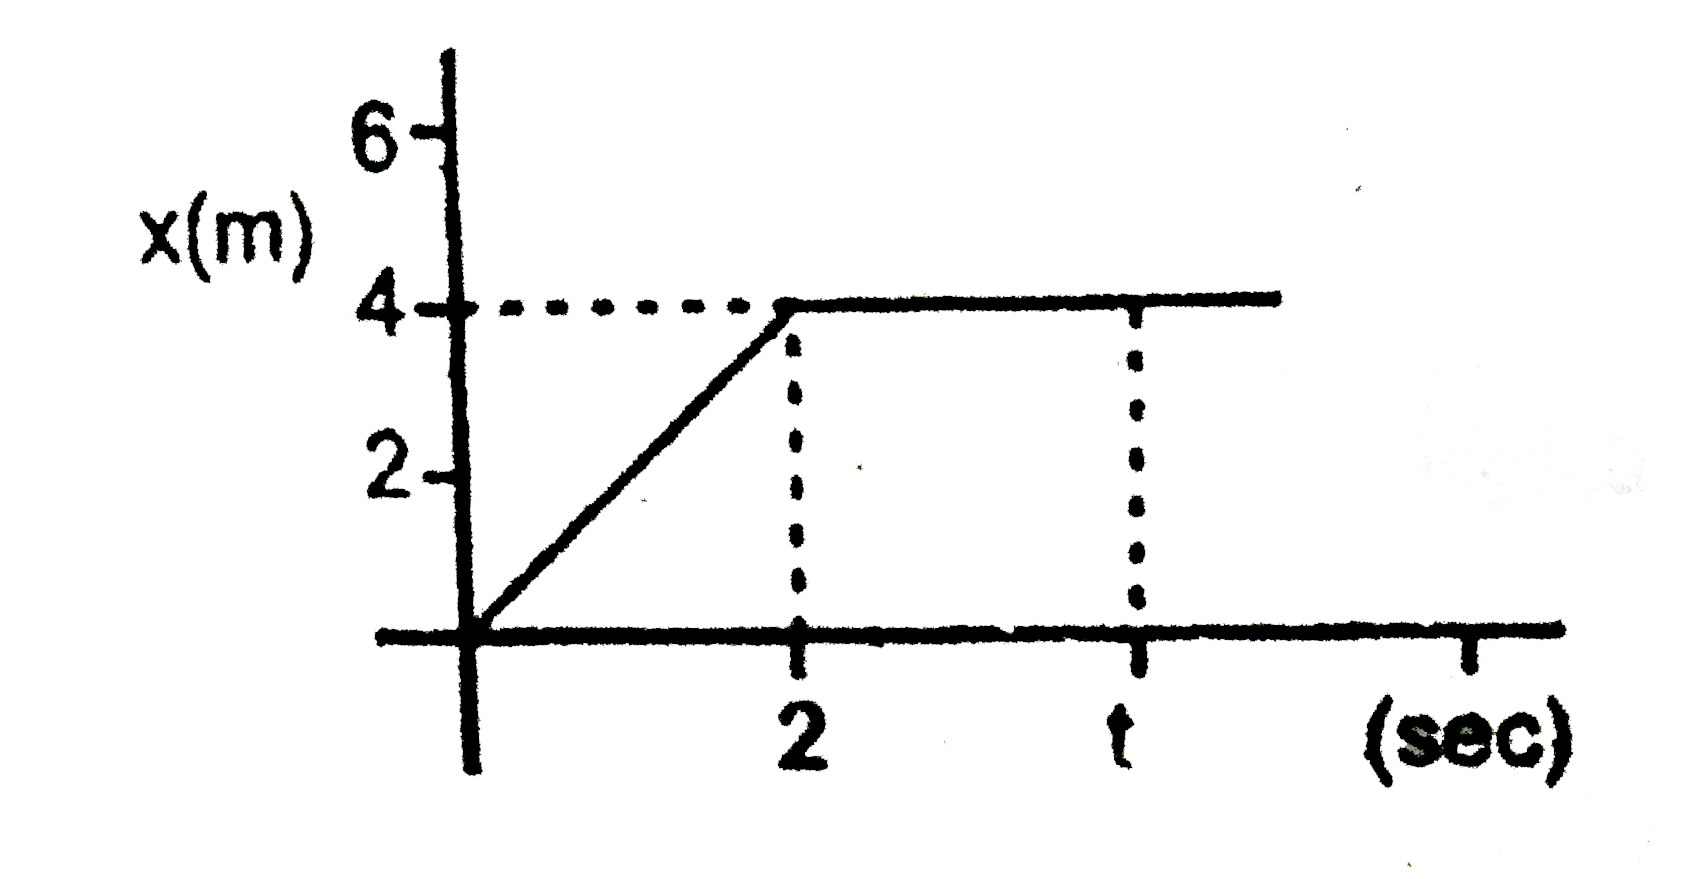 View Solution
In the figure given below, the position-time graph of a particle of mass 0.1kg is shown. The impuslse at t=2 sec is
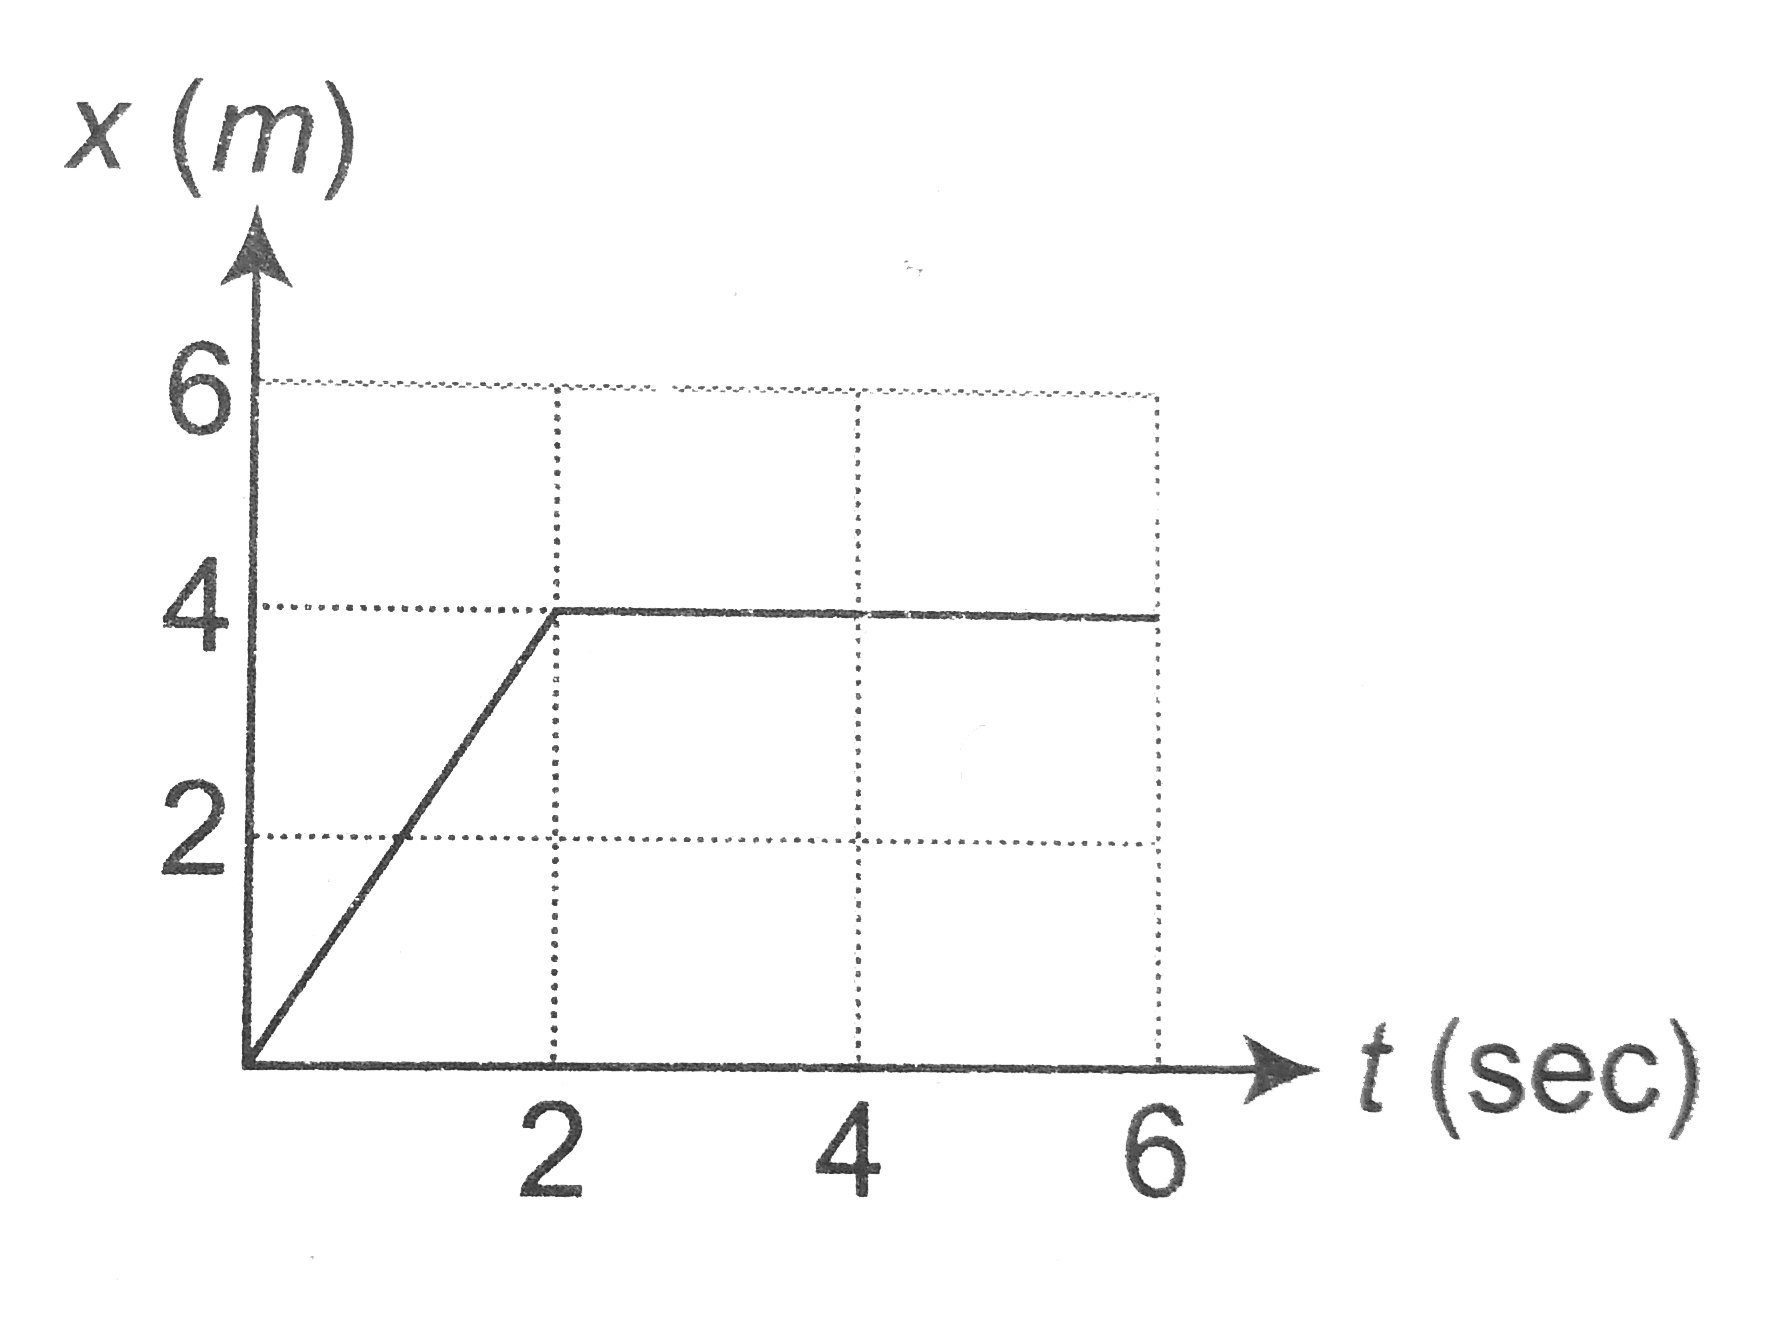 View Solution
In the figure given, the position-time graph of a particle of mass 0.1 kg is shown the impulse at t = 2s is
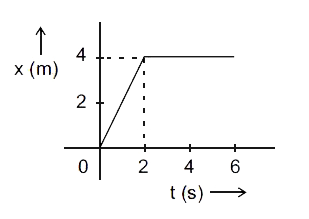 View Solution

