The graph between pressure P and volume V for a given mass of a gas a fixed temperature T is a ________ .
To solve the question, we need to analyze the relationship between pressure (P) and volume (V) for a given mass of gas at a fixed temperature (T) using the ideal gas law.
1. Understand the Ideal Gas Law: The ideal gas law is given by the equation:
PV=nRT
where P is the pressure, V is the volume, n is the number of moles of gas, R is the ideal gas constant, and T is the temperature.
2. Identify Constants: In this scenario, we are told that the mass of the gas is fixed, which means n is constant. The temperature T is also fixed, making R a constant as well. Therefore, we can say:
PV=k
where k=nRT is a constant.
3. Rearranging the Equation: From the equation PV=k, we can express pressure P in terms of volume V:
P=kV
4. Graphical Representation: The equation P=kV indicates that pressure is inversely proportional to volume. When we plot this relationship on a graph with pressure P on the y-axis and volume V on the x-axis, we will get a hyperbolic curve.
5. Conclusion: Therefore, the graph between pressure P and volume V for a given mass of gas at a fixed temperature T is a hyperbola.
Final Answer:
The graph between pressure P and volume V for a given mass of gas at a fixed temperature T is a hyperbola.
PV=nRT
where P is the pressure, V is the volume, n is the number of moles of gas, R is the ideal gas constant, and T is the temperature.
PV=k
where k=nRT is a constant.
P=kV
The graph between pressure P and volume V for a given mass of gas at a fixed temperature T is a hyperbola.
Topper's Solved these Questions
Similar Questions
Knowledge Check
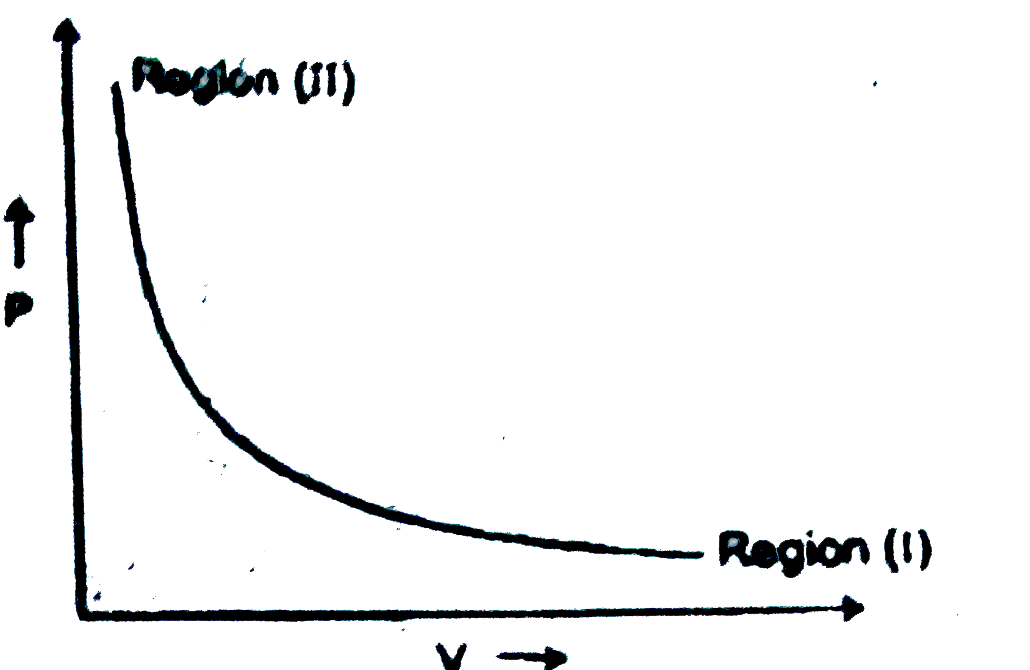
Following graph represents a pressure (P) volume (V) relationship at a fixed temperature (T) for n moles of a real gas. The graph has two regions marked (I) and (II). Which of the following options is true.
 AZ>1 in the region (II).BZ=1 in the region (II)CZ=1 for the curveDZ approaches 1 as we move from region (II) to region (I)
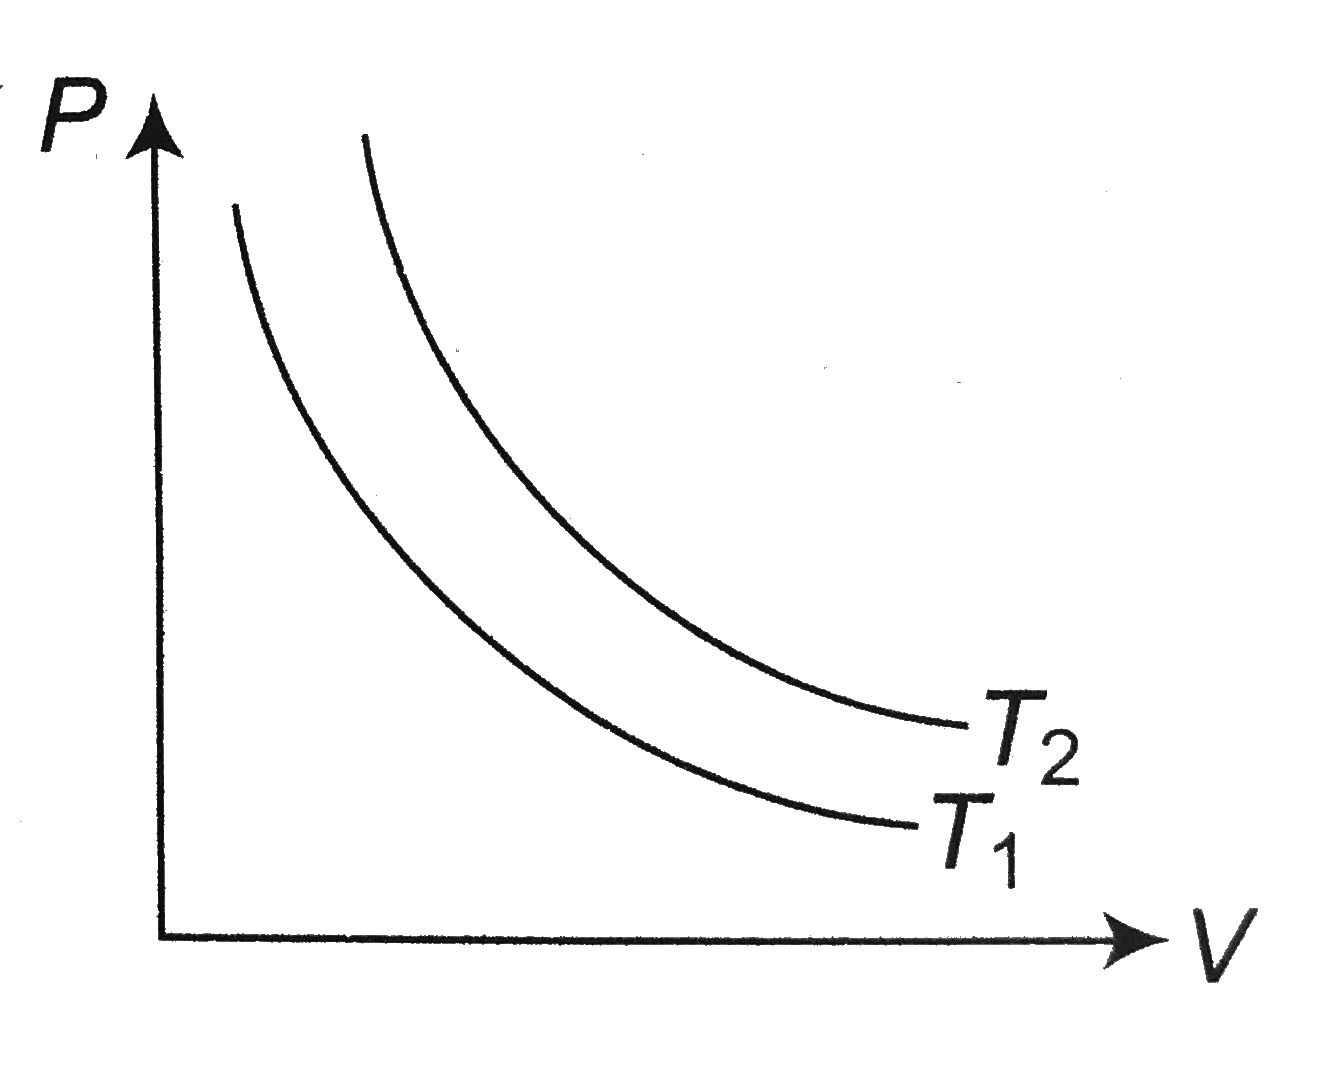
Figure shows the pressure P versus volume V graphs for a certains mass of a gas at two constant temperature T1andT2. Which of the following interface is correct?
 AT1=T2BT1>T2CT1<T2Dno inference can be drawn due to insufficient information
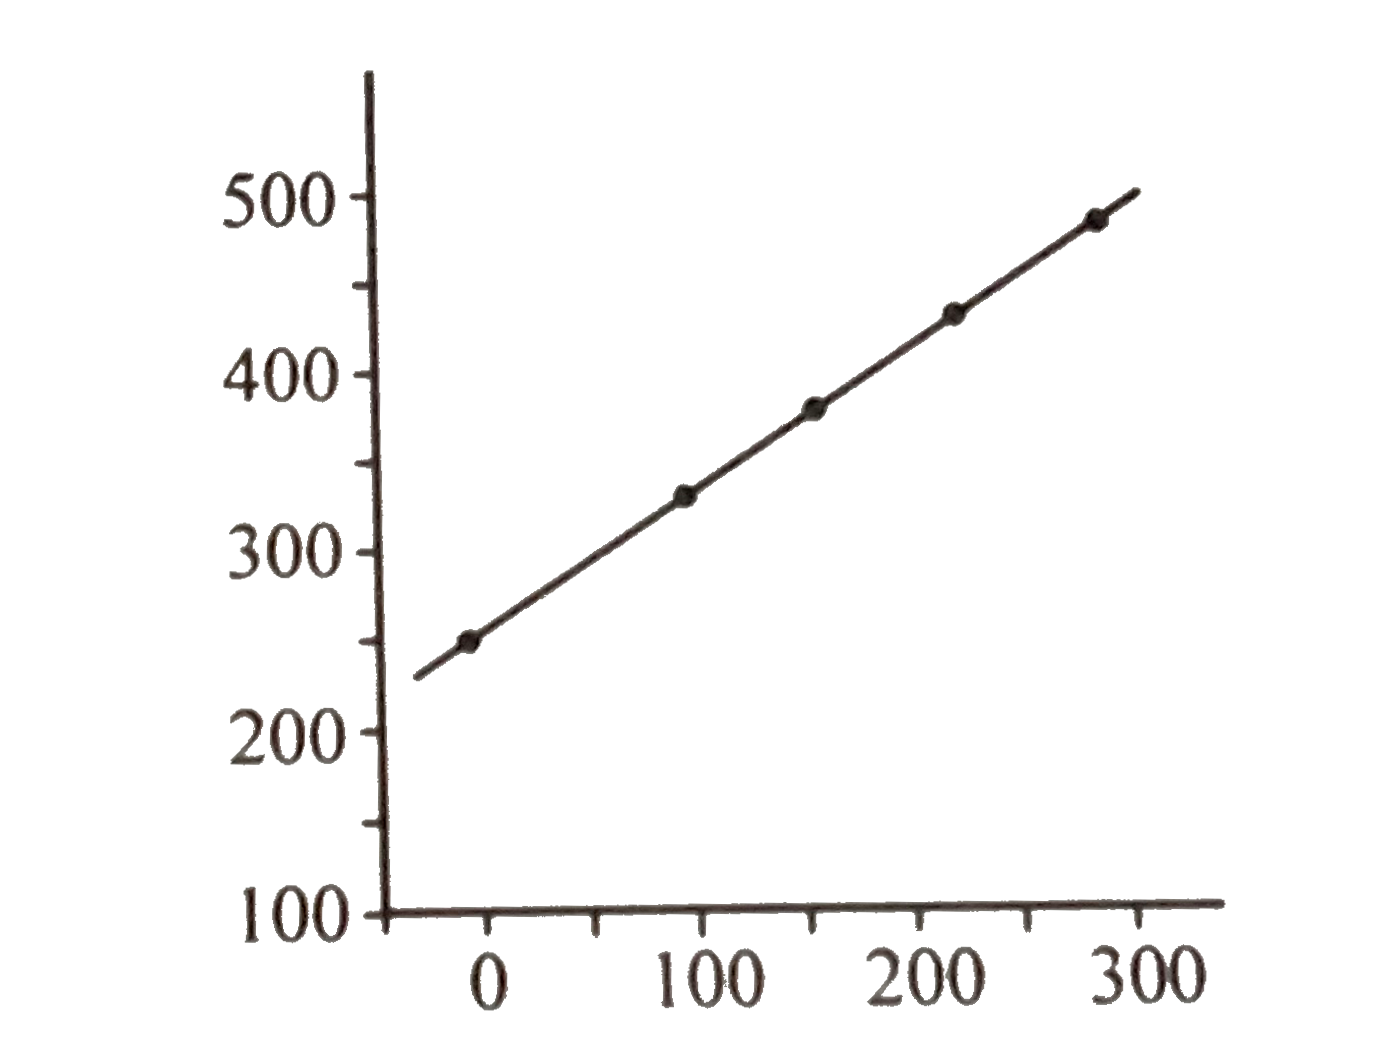
At constant pressure , the volume of a fixed mass of a gas varies as a function of temperarture as shown in the graph

the volume of the gas 300∘C is larger than at 0∘C by a factor ofA3B4C1D2
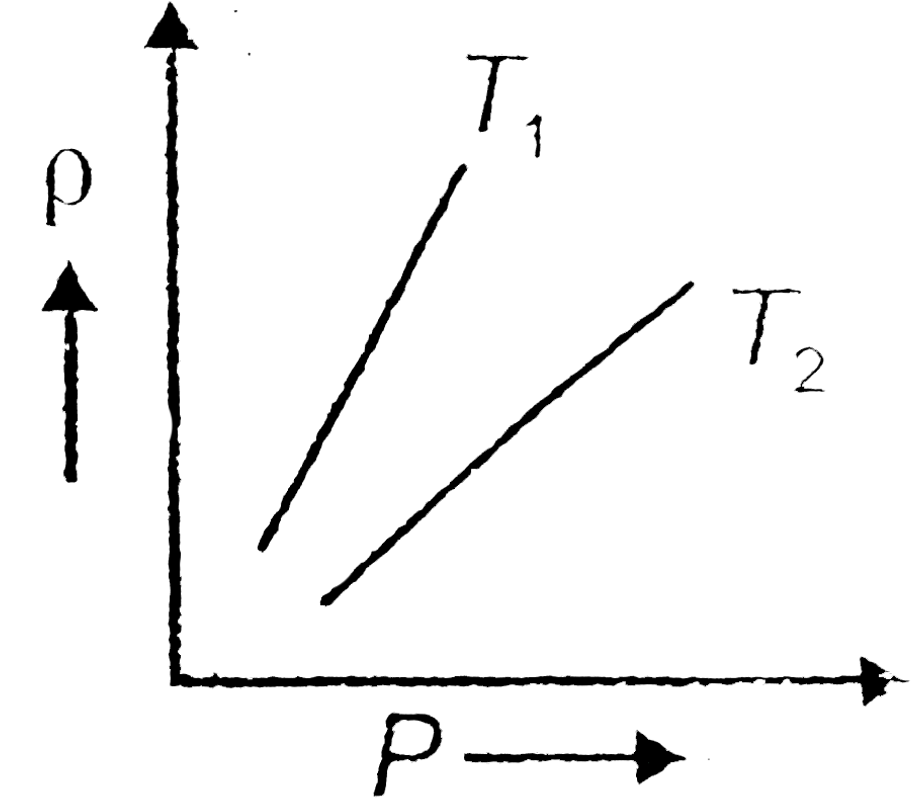
The density (ρ) versus pressure (P) graphs of a given mass of an ideal gas is shown at two temperatures T1andT2. Then relation between T1andT2 may be

View SolutionWhat is the nature of graph of P versus (1/V) for a given mass of gas at constant temperature ?
View SolutionIf the volume of a given mass of a gas at constant temperature becomes three times, the pressure will be
View SolutionWhat is the nature of graph of PV versus P for a given mass of a gas at constant temperature?
View SolutionGraph between speed v of sound in air and pressure P at a constant temperature is given by
View Solution