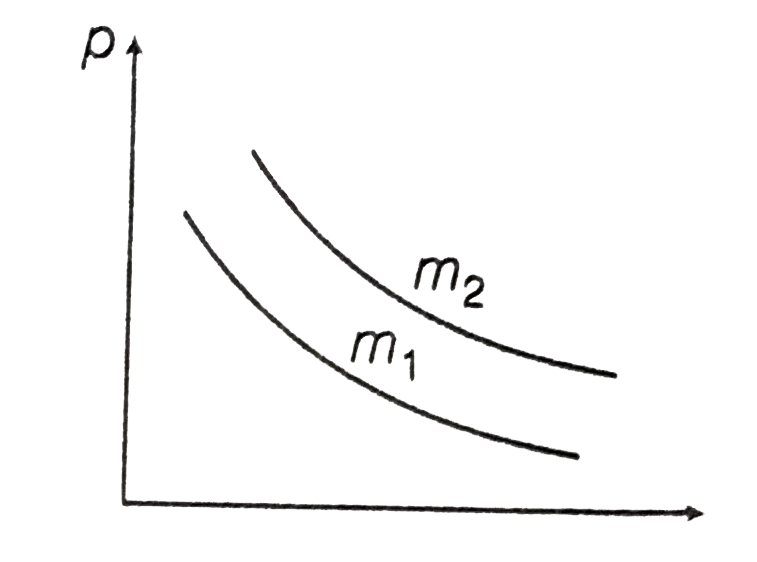
What is the nature of graph between pressure (P) and volume(V)for a given mass of a gas at a fixed temperature ?
To determine the nature of the graph between pressure (P) and volume (V) for a given mass of gas at a fixed temperature, we can follow these steps:
1. Understand the Ideal Gas Law:
The ideal gas law is given by the equation:
PV=nRT
where P is the pressure, V is the volume, n is the number of moles, R is the universal gas constant, and T is the temperature.
2. Identify Constants:
For a given mass of gas at a fixed temperature, the number of moles n and the temperature T are constant. Therefore, nRT can be treated as a constant k:
PV=k
3. Rearrange the Equation:
From the equation PV=k, we can express pressure in terms of volume:
P=kV
This indicates that pressure P is inversely proportional to volume V.
4. Graphical Representation:
The equation P=kV suggests that if we plot pressure P on the y-axis and volume V on the x-axis, the graph will be a hyperbola. This is because as volume increases, pressure decreases, and vice versa.
5. Nature of the Graph:
The graph will be a hyperbola that lies in the first quadrant since both pressure and volume are positive quantities. The curve approaches the axes but never touches them, indicating that pressure cannot be zero when volume is finite and vice versa.
Conclusion:
The nature of the graph between pressure (P) and volume (V) for a given mass of gas at a fixed temperature is a hyperbola that lies in the first quadrant.
---
The ideal gas law is given by the equation:
PV=nRT
where P is the pressure, V is the volume, n is the number of moles, R is the universal gas constant, and T is the temperature.
For a given mass of gas at a fixed temperature, the number of moles n and the temperature T are constant. Therefore, nRT can be treated as a constant k:
PV=k
From the equation PV=k, we can express pressure in terms of volume:
P=kV
This indicates that pressure P is inversely proportional to volume V.
The equation P=kV suggests that if we plot pressure P on the y-axis and volume V on the x-axis, the graph will be a hyperbola. This is because as volume increases, pressure decreases, and vice versa.
The graph will be a hyperbola that lies in the first quadrant since both pressure and volume are positive quantities. The curve approaches the axes but never touches them, indicating that pressure cannot be zero when volume is finite and vice versa.
The nature of the graph between pressure (P) and volume (V) for a given mass of gas at a fixed temperature is a hyperbola that lies in the first quadrant.
Topper's Solved these Questions
Similar Questions
Knowledge Check
The temperature of a gas at pressure P and volume V is 27∘C. Keeping its volume constant. If its temperature is raised to 927∘C, then its pressure will be
A2PB3PC4PD6PThe temperature of a gas at pressure P and volume V is 27∘C . Keeping its volume constant if its temperature is raised to 927∘C , then its pressure will be
A2PB3PC4PD6PThe temperature of a gas at pressure p and volume V is 27∘C. Keeping its volume constant, if its temperature is raised to 927∘C, then its pressure will be
A2pB3pC4pD6p
What is the nature of graph of P versus (1/V) for a given mass of gas at constant temperature ?
View SolutionEstablish the relationship between temperature pressure and volume of a given mass of a gas.
View SolutionDraw the graph between P and 1/V (reciprocal of volume) for a perfect gas at constant temperature.
View SolutionThe slope of the graph between log P and log V at constant temperature for a given mass of gas is
View SolutionTwo different isotherms representing the relationship between pressure p and volume V at a given temperature of the same ideal gas are shown for masses m1 and m2 then

View Solution
