The graphs given under is obtained by Boyle.s law at constant volume and temperature mention the types of each graph and state that what it indicates ?

(i) This graph is Hyperbola it is indicated that pressure increase and volume decreases. p∝1V
(ii) Graph V∝1p is straight line and it pass through origin it indicated that pV = constant. Volume is inversely proportional to volume.
(iii) p∝1V graph is obtained as straight line.
pressdure is inversely proportional to volume.
Note : The slope are different (ii) and (iii).
The slope of V∝1p<p→1V
(iv) Graph of log10p→ log V slope is negative.
Thus show that there is linear relation between log10p and log10V.
as, pV=k1
∴log10p+log10V=logK1
(v) It is isotherm graph (T3,T2,T1) temperature curve decreases.
(vi) Graph is straight line. It indicate that slope is increase with temperature.
(vii) 
pV → p graph is linear and parallel of axis.
Value of pV increases with temperature.
The graph shows that the multiplicastion of pressure are volume remains consdtant at constant temperature.
Topper's Solved these Questions
- STATES OF MATTER BOOK - KUMAR PRAKASHANCHAPTER - STATES OF MATTER EXERCISE - SECTION - C MULIPLE CHOICE QUESTIONS (MCQs)
93 Videos
- STATES OF MATTER BOOK - KUMAR PRAKASHANCHAPTER - STATES OF MATTER EXERCISE - SECTION - D SOLUTION OF NCERT EXEMPLAR PROBLEMS (Multiple Choice Questions)
17 Videos
- STATES OF MATTER BOOK - KUMAR PRAKASHANCHAPTER - STATES OF MATTER EXERCISE - SECTION - A QUESTIONS (TRY YOUR SELF)
47 Videos
- SOME BASIC CONCEPTS OF CHEMISTRYBOOK - KUMAR PRAKASHANCHAPTER - SOME BASIC CONCEPTS OF CHEMISTRYEXERCISE - Section - D (Solutions of NCERT Exemplar Problems) (Long Answer Type Questions)
4 Videos
- STRUCTURE OF ATOMBOOK - KUMAR PRAKASHANCHAPTER - STRUCTURE OF ATOMEXERCISE - QUESTINS PAPER FROM MODULE (SECTION -D)
2 Videos
Similar Questions
Knowledge Check
According to Boyle's law, PV = constant, at constant temperature. Which of the following graphs is correct?
A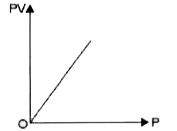 B
B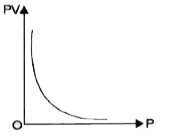 C
C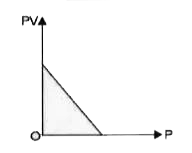 D
D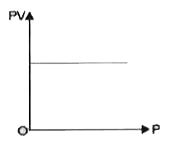
Under constant temperature, graph between P and 1/V is a
AparabolaBhyperbolaCstraight lineDcircle
Pressure vs volume graph at constant temperature is known as…………….
View SolutionWhat is the type of graph between log P and log V at constant temperature?
View SolutionWhat is the type of graph between log P and log V at constant temperature?
View SolutionA graph is plotted between pressure and volume at different temperature. On the basis of the graph what changes will you observe in the volume if
(i) the pressure is increased at constant temperature
(ii) the temperature is decreased at constant pressure
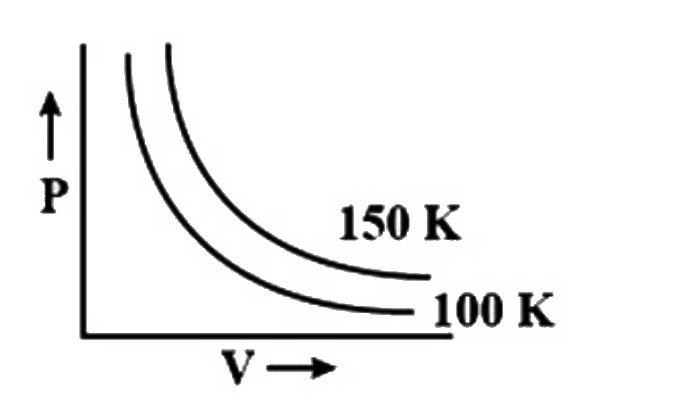
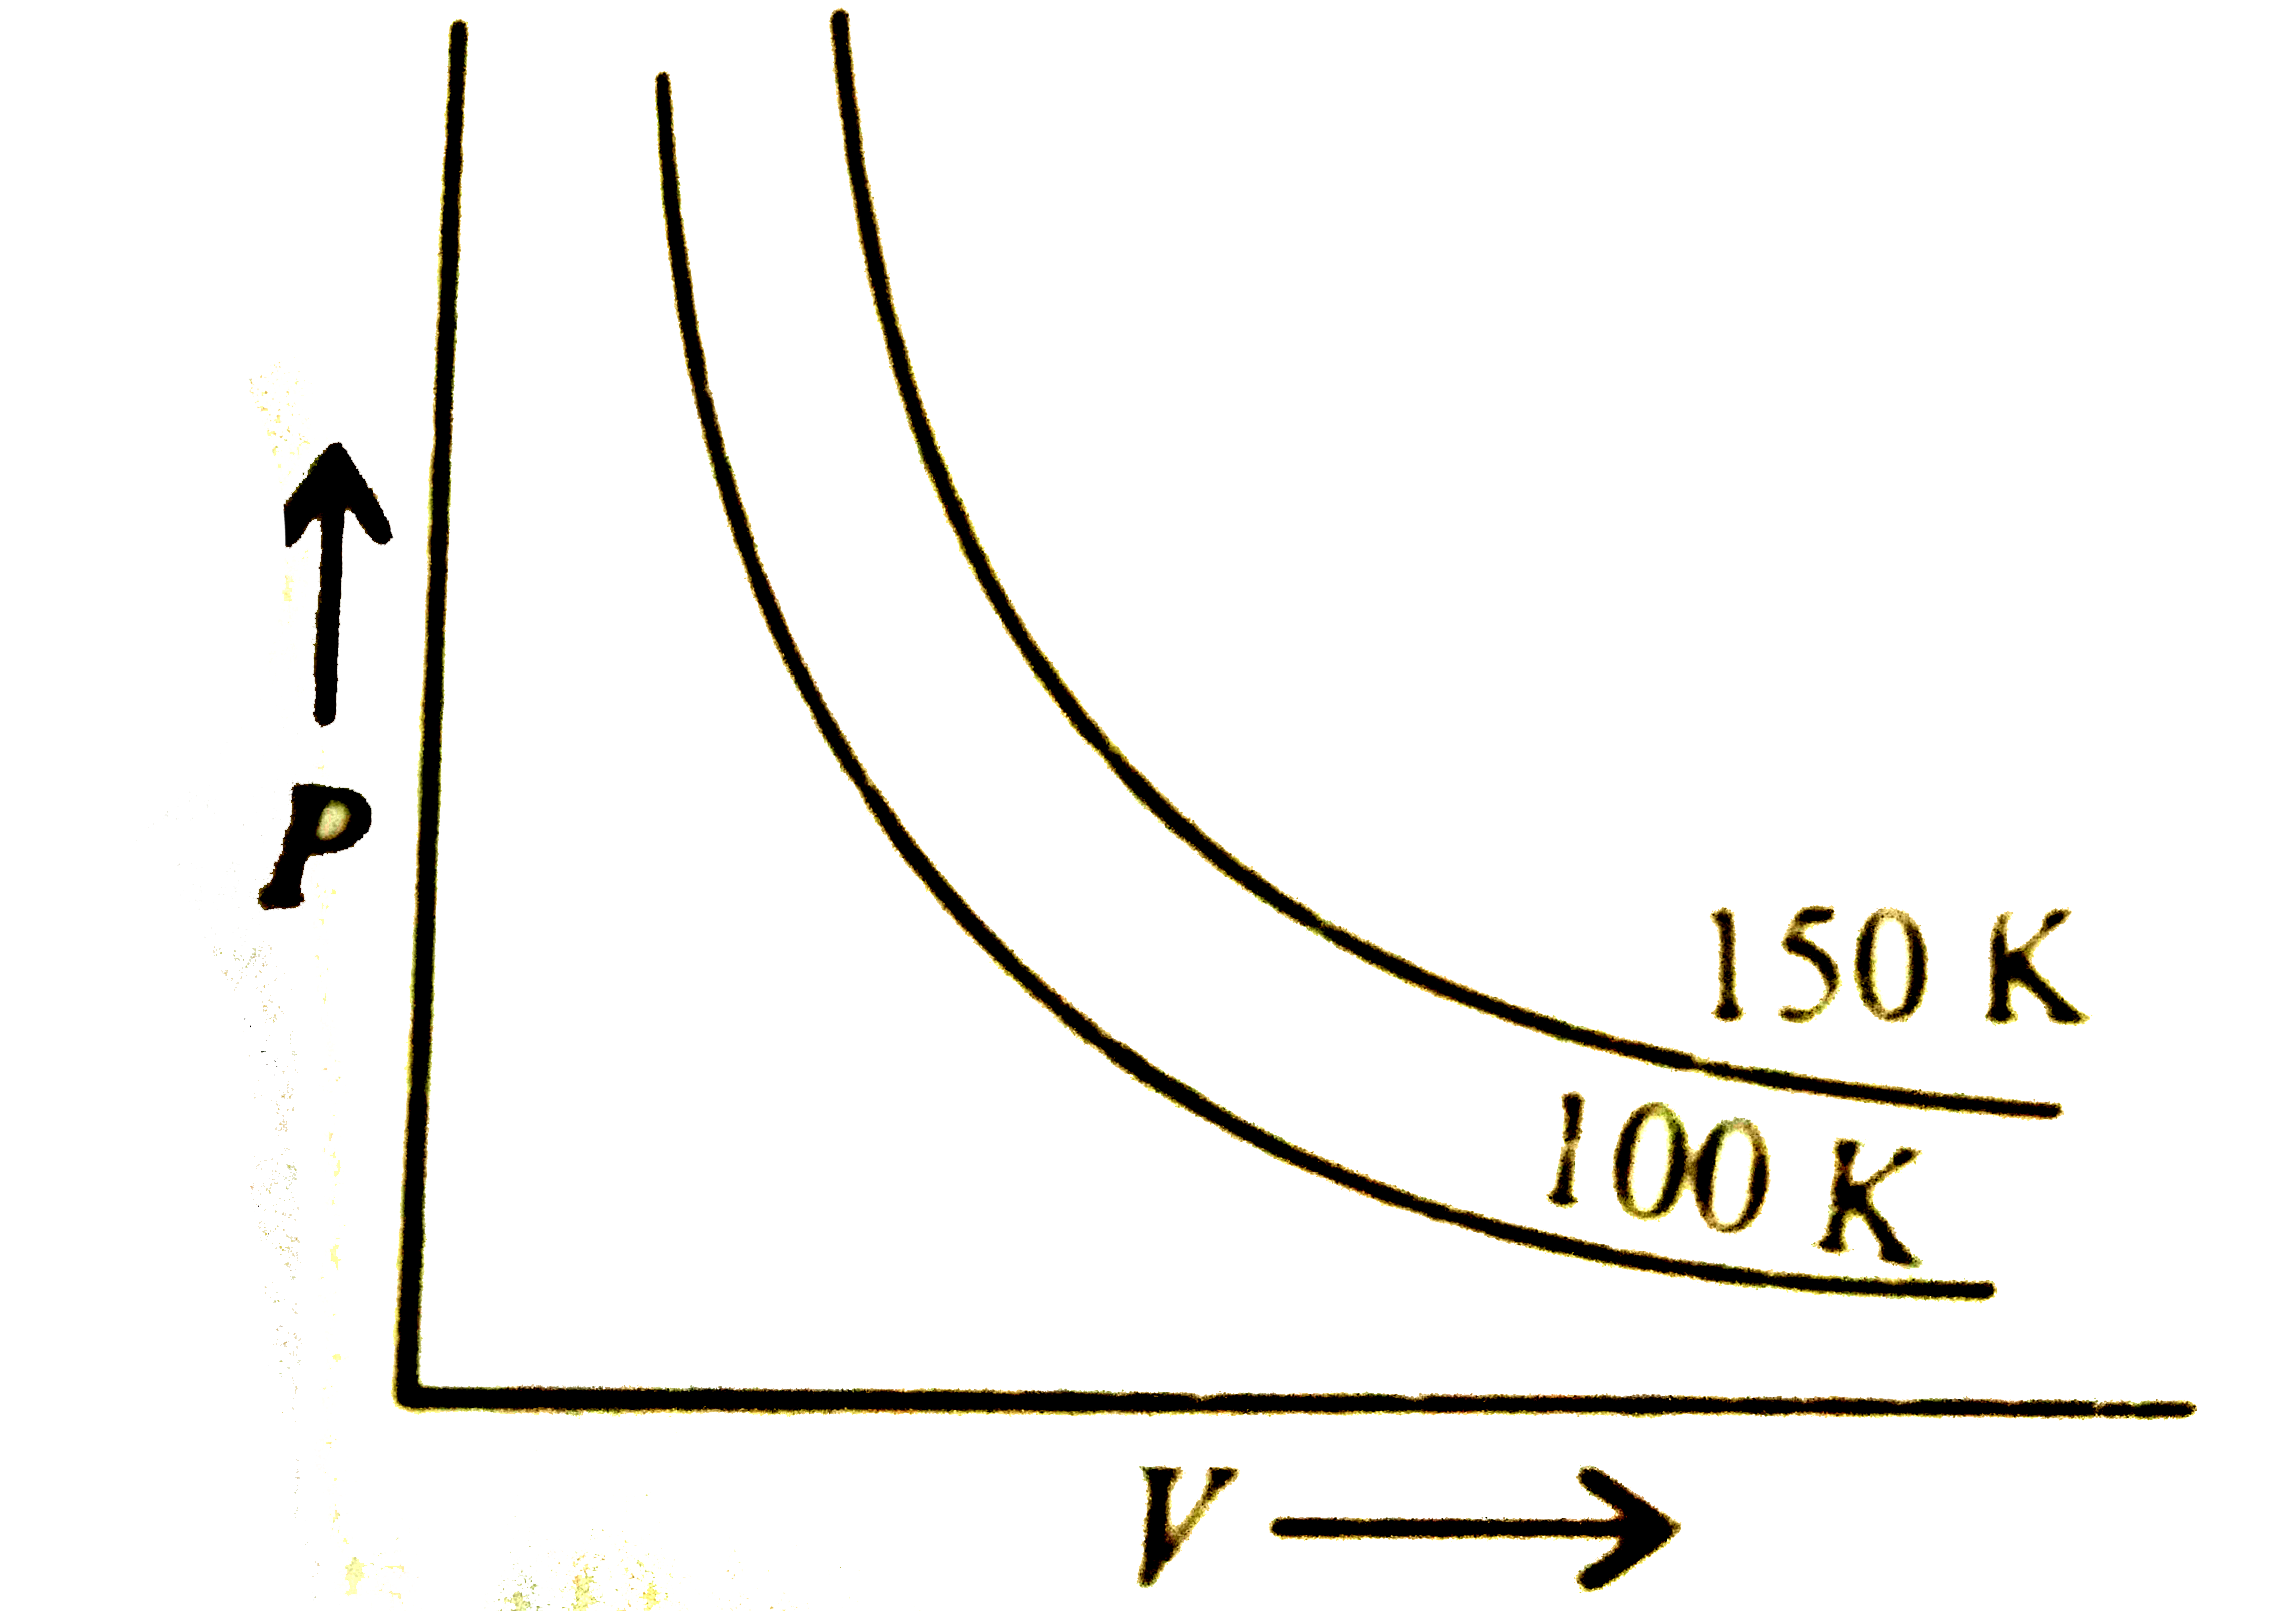
View SolutionA graph is plotted between pressure and volume at different temperatures . On the basis of the graph what changes will you observe in the volume if
(i) the pressure is increased at constant temperature .
(ii) the temperature is decreased at constant pressure .
View SolutionWhile stating Boyle's law why should we use the phrase " at constant temperature"?
View Solution
