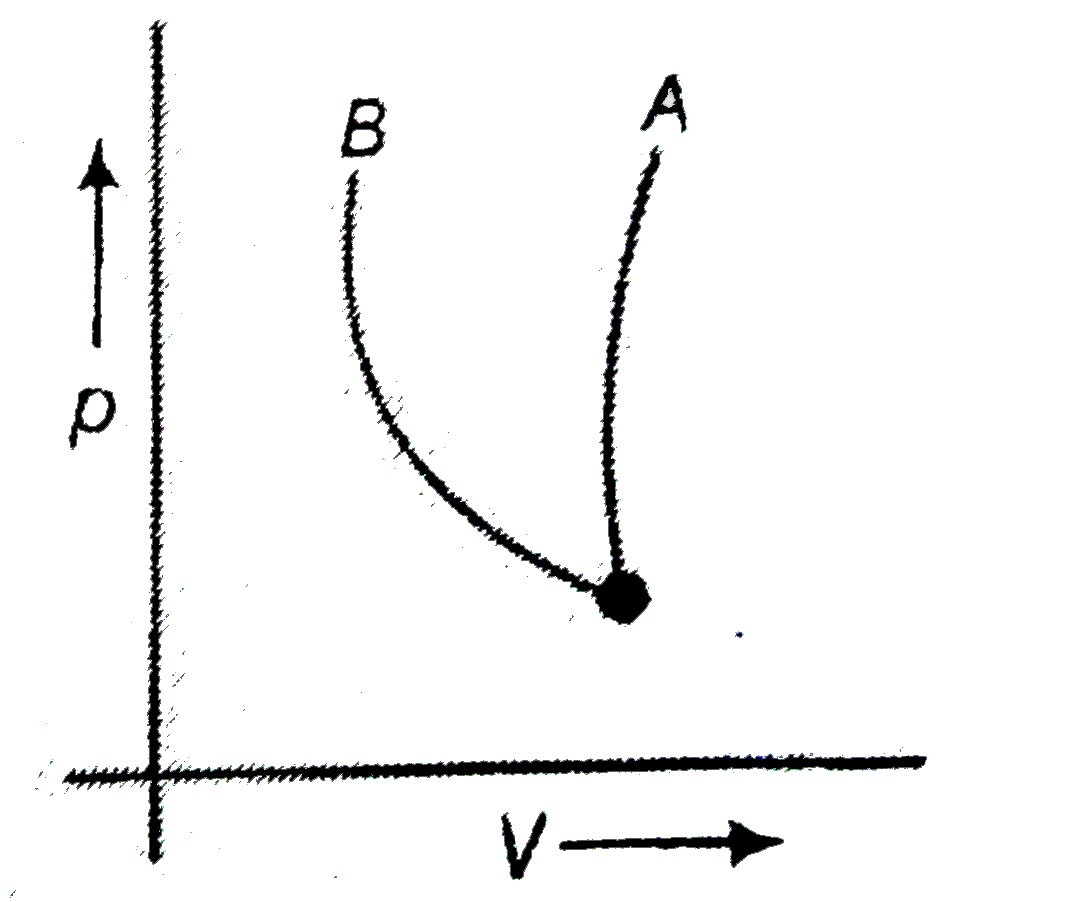
The graph ………… is known as isothermal.
A
p→V
B
pV→V
C
V→1p
D
p→1V
Text Solution
The correct Answer is:C
|
Topper's Solved these Questions
- STATES OF MATTER BOOK - KUMAR PRAKASHANCHAPTER - STATES OF MATTER EXERCISE - SECTION - D SOLUTION OF NCERT EXEMPLAR PROBLEMS (Multiple Choice Questions)
17 Videos
- STATES OF MATTER BOOK - KUMAR PRAKASHANCHAPTER - STATES OF MATTER EXERCISE - SECTION - D SOLUTION OF NCERT EXEMPLAR PROBLEMS (Short Answer Type Questions)
23 Videos
- STATES OF MATTER BOOK - KUMAR PRAKASHANCHAPTER - STATES OF MATTER EXERCISE - SECTION - B OBJECTIVE QUESTIONS
165 Videos
- SOME BASIC CONCEPTS OF CHEMISTRYBOOK - KUMAR PRAKASHANCHAPTER - SOME BASIC CONCEPTS OF CHEMISTRYEXERCISE - Section - D (Solutions of NCERT Exemplar Problems) (Long Answer Type Questions)
4 Videos
- STRUCTURE OF ATOMBOOK - KUMAR PRAKASHANCHAPTER - STRUCTURE OF ATOMEXERCISE - QUESTINS PAPER FROM MODULE (SECTION -D)
2 Videos
Similar Questions
Knowledge Check
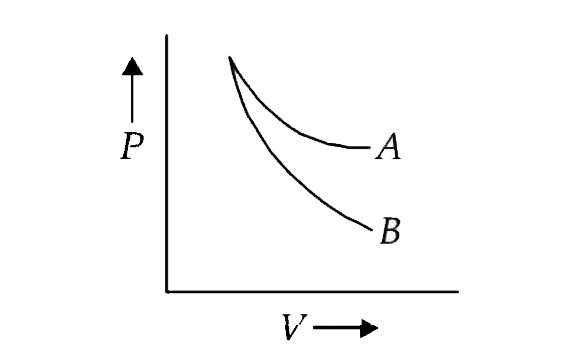
In the given graph, adiabatic and isothermal curves are shown. Then,
 Athe curve A is isothermalBthe curve B is isothermalCthe curve A is adiabaticDthe curve B is adiabatic
Assertion Molar heat capacity cannot be defined for isothermal process.
Reason In isothermal prcess p-V versus T graph is a dot.ABoth assertion and reson are true and reason is the correct explanation of assertionBBoth assetion and reason are true but reason is not the correct explanation of assertionCAssertion is true but reason is falseDBoth assetion and reason are flaseArithmetic line-graphs are also known as:
Alinear graphsBnon-linear graphsCtime series graphsDnone of these
The curves A and B in the figure shown P-V graphs for an isothermal and an adiabatic process for an idea gas. The isothermal process is represented by the curve A.

View SolutionThe curves A and B in the figure shown P-V graphs for an isothermal and an adiabatic process for an idea gas. The isothermal process is represented by the curve A.

View SolutionAssertion Molar heat capacity cannot be defined for isothermal process.
Reason In isothermal prcess p-V versus T graph is a dot.
View SolutionFor a given mass of a gas, what is the shape of (pV) versus (T) graph on isothermal process ?
View SolutionFor a given mass of a gas, what is the shape of (pV) versus (T) graph on isothermal process ?
View Solution
