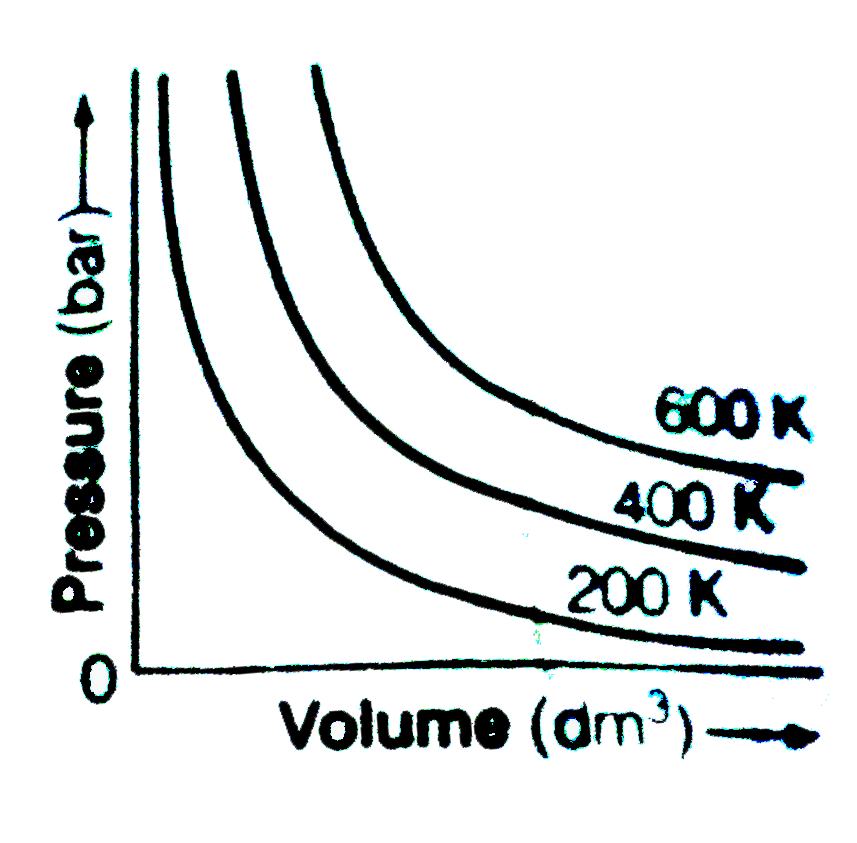
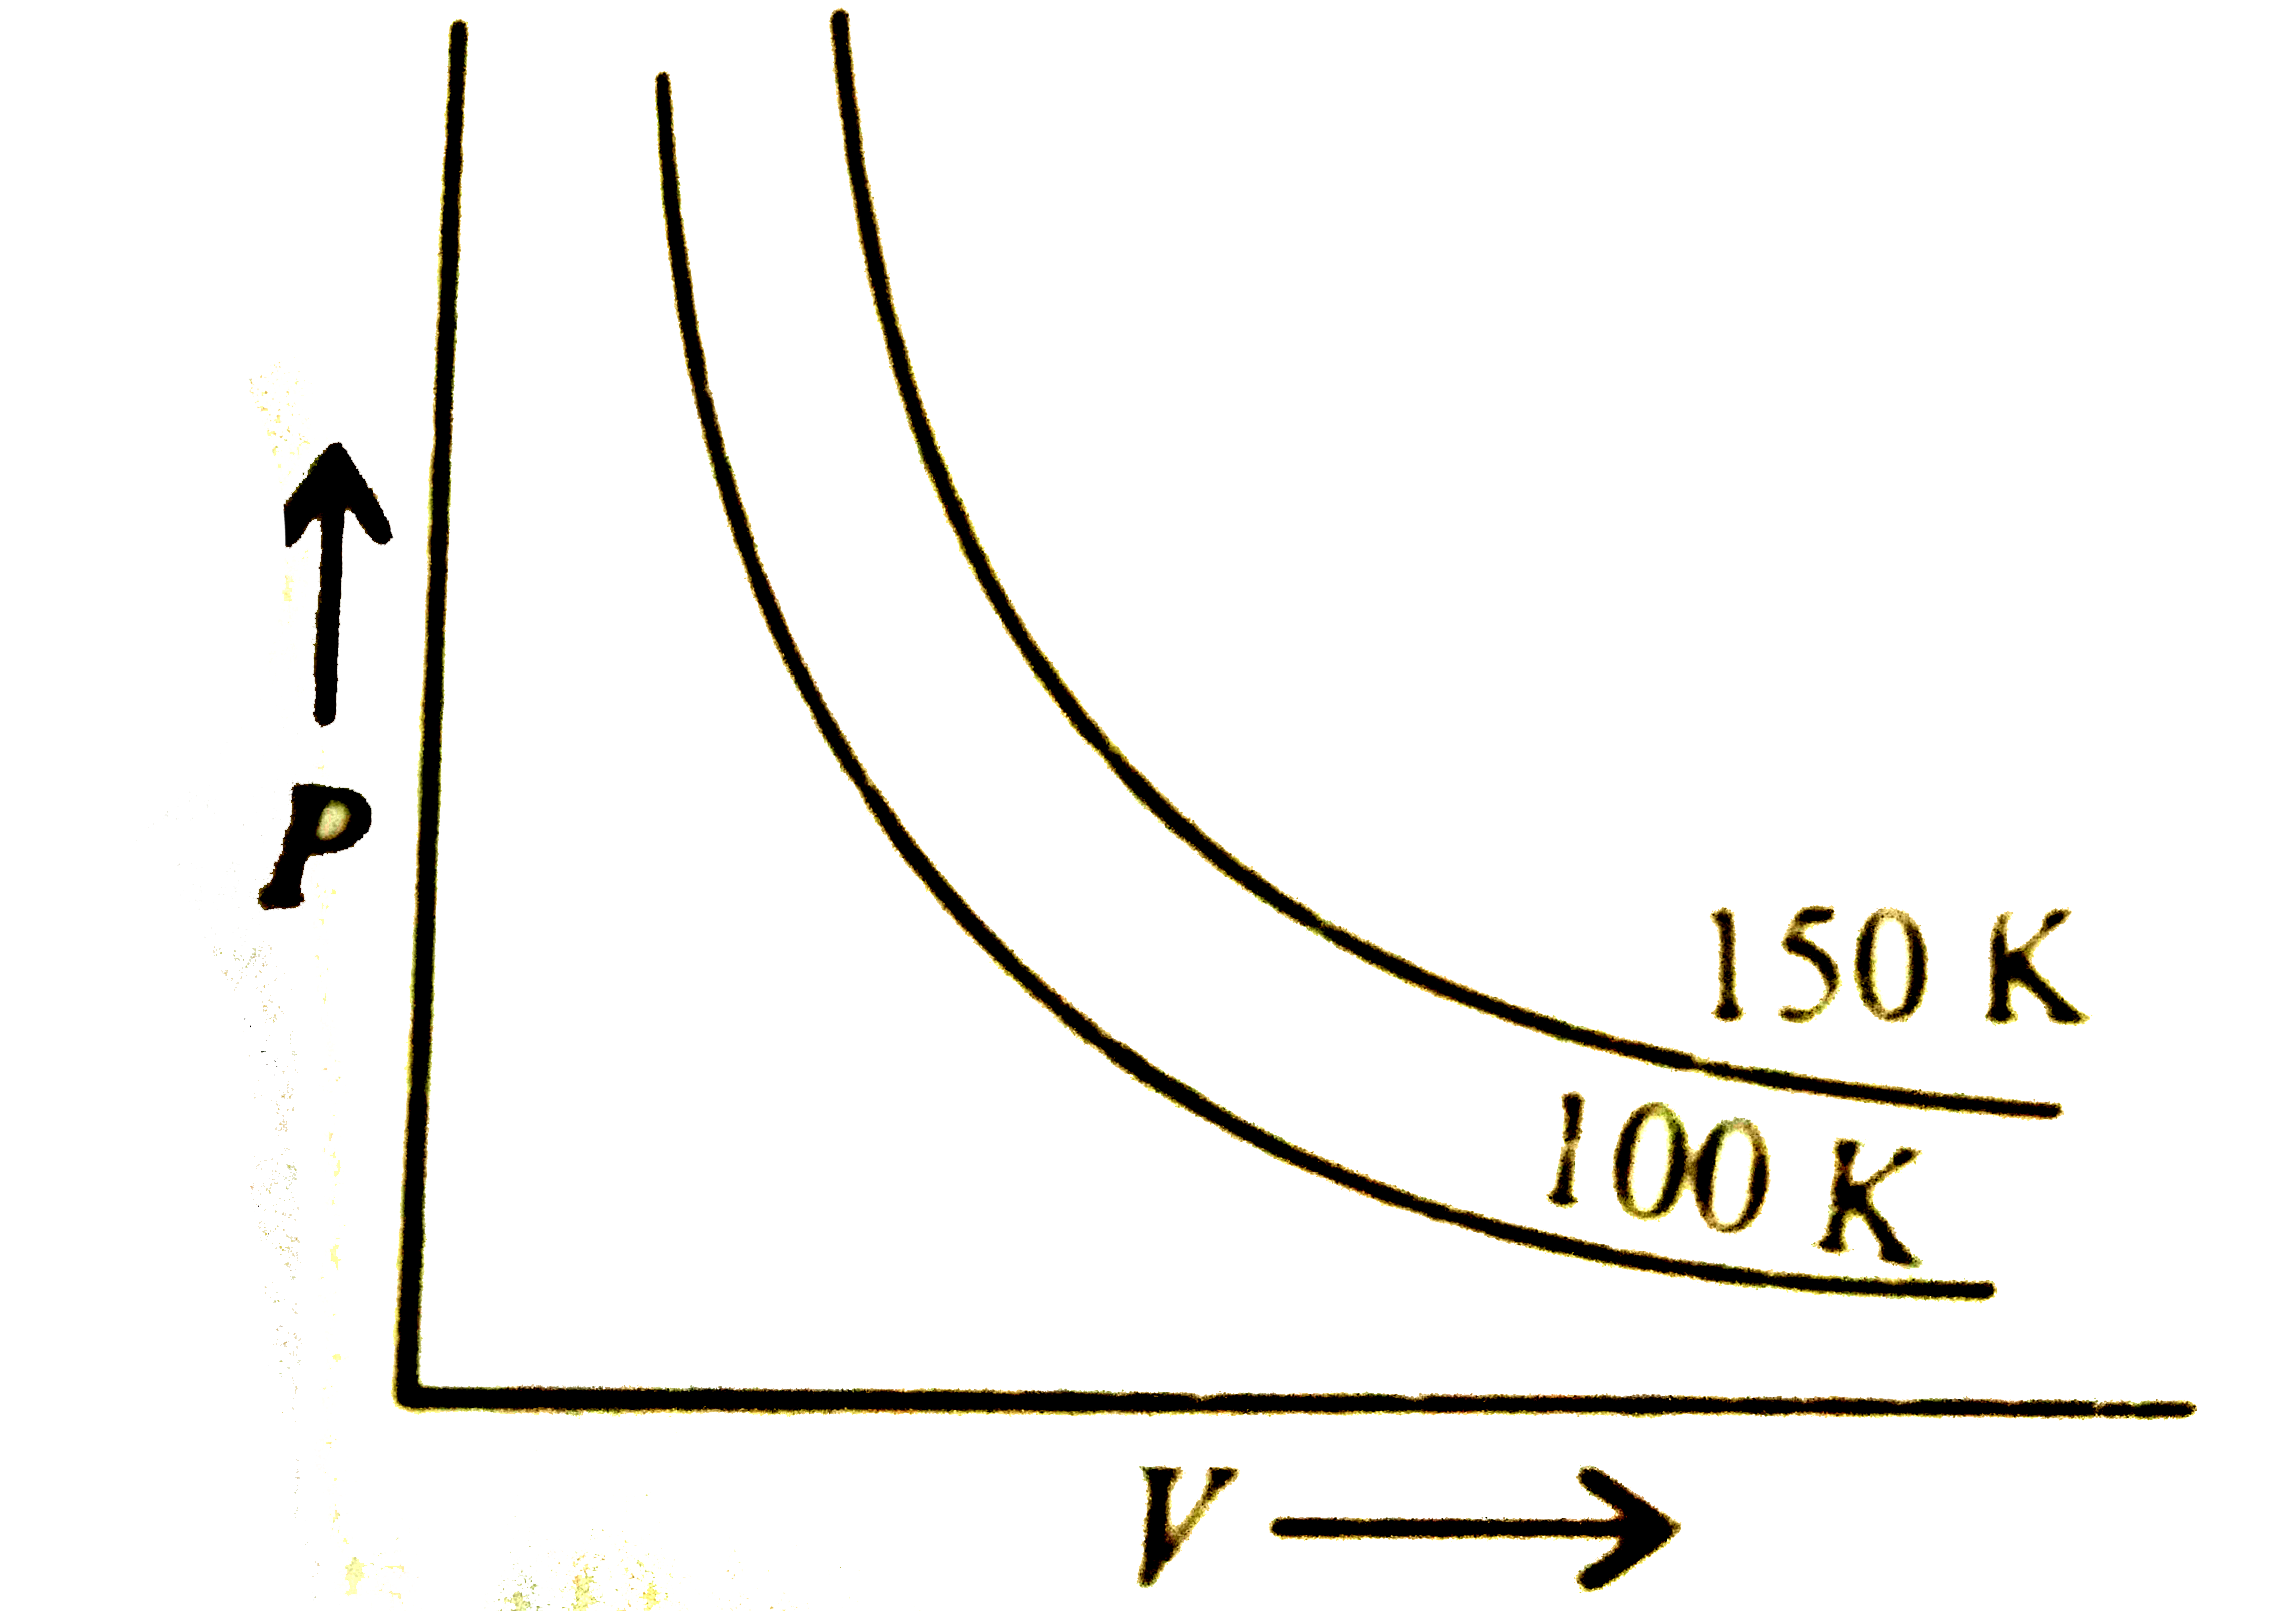
The variation of pressure with volume of the gas at different temperatures can be graphically represented as shown in Fig. On the basis of this graph answer the following questions.
(i) How will the volume of a gas change if its pressure is increased at constant temperature ?
(ii) At a constant pressure, how will the volume of a gas change if the temperature is increased from 200 K to 400 K ?

(i) According to Boyle.s law, pressure of a gas is inversely proportional to its volume if temperature is kept constasnt. Thus, the volume of the gas decrease, if the pressure on the gas increases keeping the temperature constant. e.g., at 200 K when pressure is increased from p1 to p2, volume of the gas decreases, V2<V1
(ii) According to Iharles law, volume of a gas is directly proportional to its temperature if pressure is kept constant.
Thus on increasing temperature, the volume of a gas will increase if pressure is kept constant.

At constant p when we increase the temperature from 200 K to 400 K, the volume of the gas increases, V4>V3.
Topper's Solved these Questions
- STATES OF MATTER BOOK - KUMAR PRAKASHANCHAPTER - STATES OF MATTER EXERCISE - SECTION - D SOLUTION OF NCERT EXEMPLAR PROBLEMS (Matching The Columns)
3 Videos
- STATES OF MATTER BOOK - KUMAR PRAKASHANCHAPTER - STATES OF MATTER EXERCISE - SECTION - D SOLUTION OF NCERT EXEMPLAR PROBLEMS (Assertion and Reason)
6 Videos
- STATES OF MATTER BOOK - KUMAR PRAKASHANCHAPTER - STATES OF MATTER EXERCISE - SECTION - D SOLUTION OF NCERT EXEMPLAR PROBLEMS (Multiple Choice Questions)
17 Videos
- SOME BASIC CONCEPTS OF CHEMISTRYBOOK - KUMAR PRAKASHANCHAPTER - SOME BASIC CONCEPTS OF CHEMISTRYEXERCISE - Section - D (Solutions of NCERT Exemplar Problems) (Long Answer Type Questions)
4 Videos
- STRUCTURE OF ATOMBOOK - KUMAR PRAKASHANCHAPTER - STRUCTURE OF ATOMEXERCISE - QUESTINS PAPER FROM MODULE (SECTION -D)
2 Videos
Similar Questions
The variation of pressure with volume of the gas at different temperatures can be graphically represented as shown in figure. On the basis of this graph answer the following question.
(i) How will the volume of a gas change if its pressure is increased at constant temperature ?
(ii) At a constant pressure, how will the volume of a gas change if the temperature is increased from 200 K to 400 K ?
View SolutionThe variation of pressure with volume of the gas at different temperatures can be graphically represented as shown in figure. On the basis of this graph answer the following question.
(i) How will the volume of a gas change if its pressure is increased at constant temperature ?
(ii) At a constant pressure, how will the volume of a gas change if the temperature is increased from 200 K to 400 K ?

View Solution
Knowledge Check
What is the effect on the pressure of a gas if its temperature is increased at constant volume ?
AThe pressure of the gas increases.BThe pressure of the gas decreases .CThe pressure of the gas remains same .DThe pressure of the gas remains same .What is the effect on the pressure of a gas if its temperature is increased at constant volume ?
AThe pressure of the gas increases.BThe pressure of the gas decreases .CThe pressure of the gas remains same .DThe pressure of the gas becomes half.A constant temperature , the volume of a gas is to be decreased by 4 % The pressure must be increased by
A0.04B0.0416C0.08D0.0386
The variation of pressure with volume of the gas at different temperatures can be graphically represented as shown in figure. On the basis of this graph answer the following questions.
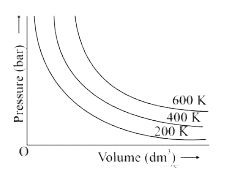
How will the volume of a gas change if its pressure is increased at constant temperature?
View SolutionThe variation of pressure with volume of the gas at different temperatures can be graphically represented as shown in figure. On the basis of this graph answer the following questions.
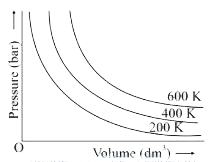
At a constant pressure, how will the volume of a gas change if the temperature is increased from 200 K to 400 K?
View SolutionName the gas law which relates volume and pressure of gas at constant temperature.
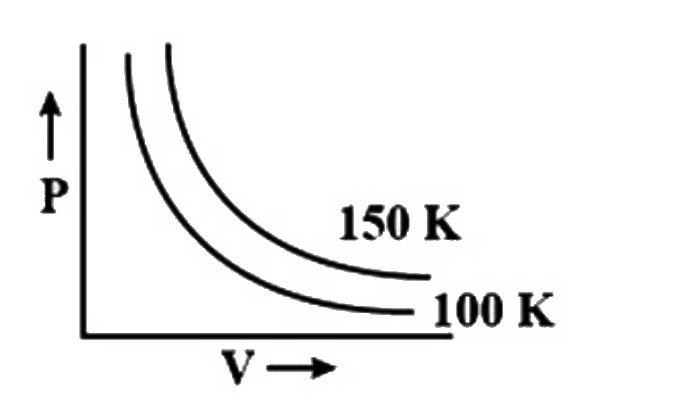
View SolutionA graph is plotted between pressure and volume at different temperature. On the basis of the graph what changes will you observe in the volume if
(i) the pressure is increased at constant temperature
(ii) the temperature is decreased at constant pressure
View SolutionA graph is plotted between pressure and volume at different temperatures . On the basis of the graph what changes will you observe in the volume if
(i) the pressure is increased at constant temperature .
(ii) the temperature is decreased at constant pressure .
View Solution
