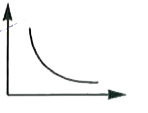
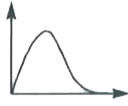
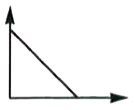
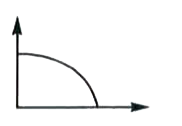
The graph of the total number of α -particles scattered at different angles in a given interval of time for α-particles scattering in the Geiger-marsden experiment is given by (Number of scattered particles taken on y-axis and scattering angle θ taken on x-axis)
A

B

C

D

Text Solution
The correct Answer is:A
|
Topper's Solved these Questions
- ATOMSBOOK - AAKASH SERIESCHAPTER - ATOMSEXERCISE - EXERCISE -IB
44 Videos
- ATOMSBOOK - AAKASH SERIESCHAPTER - ATOMSEXERCISE - EXERCISE -II
35 Videos
- ATOMSBOOK - AAKASH SERIESCHAPTER - ATOMSEXERCISE - PRACTICE EXERCISE
21 Videos
- APPENDICES (REVISION EXERCISE)BOOK - AAKASH SERIESCHAPTER - APPENDICES (REVISION EXERCISE)EXERCISE - LAW OF MOTION
91 Videos
- CAPACITORS BOOK - AAKASH SERIESCHAPTER - CAPACITORS EXERCISE - PRACTICE SHEET (ADVANCED) (Integer Type Questions)
2 Videos
Similar Questions
Knowledge Check
α particles are scattered due to
Aattraction of electronsBrepulsion by the nucleusCboth 1 and 2Dgravitational pull of neutronsSource of α-particles used in scattering experiment was
A.82Bi216B.81Bi216C.81Bi214D.21483Biα-particles is scattering is a consequence of
Anuclear force.Bcoulomb forceCgravitational forceDmagnetic force.
Draw graph of number of scattered particles to scattering angle in Ratherford's experiment.
View SolutionThe path of the scattered α – particles is
View Solutionα-particles is scattering is a consequence of
View SolutionIn the geiger -marsden scattering experiment the number of scattered detected are maximum and minimum at the scattering angles respectively at
View SolutionIn the geiger -marsden scattering experiment the number of scattered detected are maximum and minimum at the scattering angles respectively at
View Solution
