Which of the diagrams shown below most closely shows the variation in kinetic energy of the earth as it moves once around the sun in its elliptical orbit ?
A

B

C

D

Text Solution
The correct Answer is:D
|
Topper's Solved these Questions
- WORK POWER ENERGYBOOK - AAKASH SERIESCHAPTER - WORK POWER ENERGYEXERCISE - EXERCISE - 1B
39 Videos
- WORK POWER ENERGYBOOK - AAKASH SERIESCHAPTER - WORK POWER ENERGYEXERCISE - EXERCISE - 2
107 Videos
- WORK POWER ENERGYBOOK - AAKASH SERIESCHAPTER - WORK POWER ENERGYEXERCISE - EXERCISE - 3
61 Videos
- WORK -POWER-ENERGYBOOK - AAKASH SERIESCHAPTER - WORK -POWER-ENERGYEXERCISE - PRACTICE SHEET (ADVANCED) (STRAIGHT OBJECTIVE TYPE QUESTIONS)
36 Videos
- WORK, POWER & ENERGY BOOK - AAKASH SERIESCHAPTER - WORK, POWER & ENERGY EXERCISE - PRACTICE EXERCISE (PERFECTLY INELASTIC COLLISIONS)
5 Videos
Similar Questions
Knowledge Check
Which of the diagrams shown in figure. Most closely shows the variation in kinetic energy of the earth as it moves once around the sun in its elliptical orbit ?
A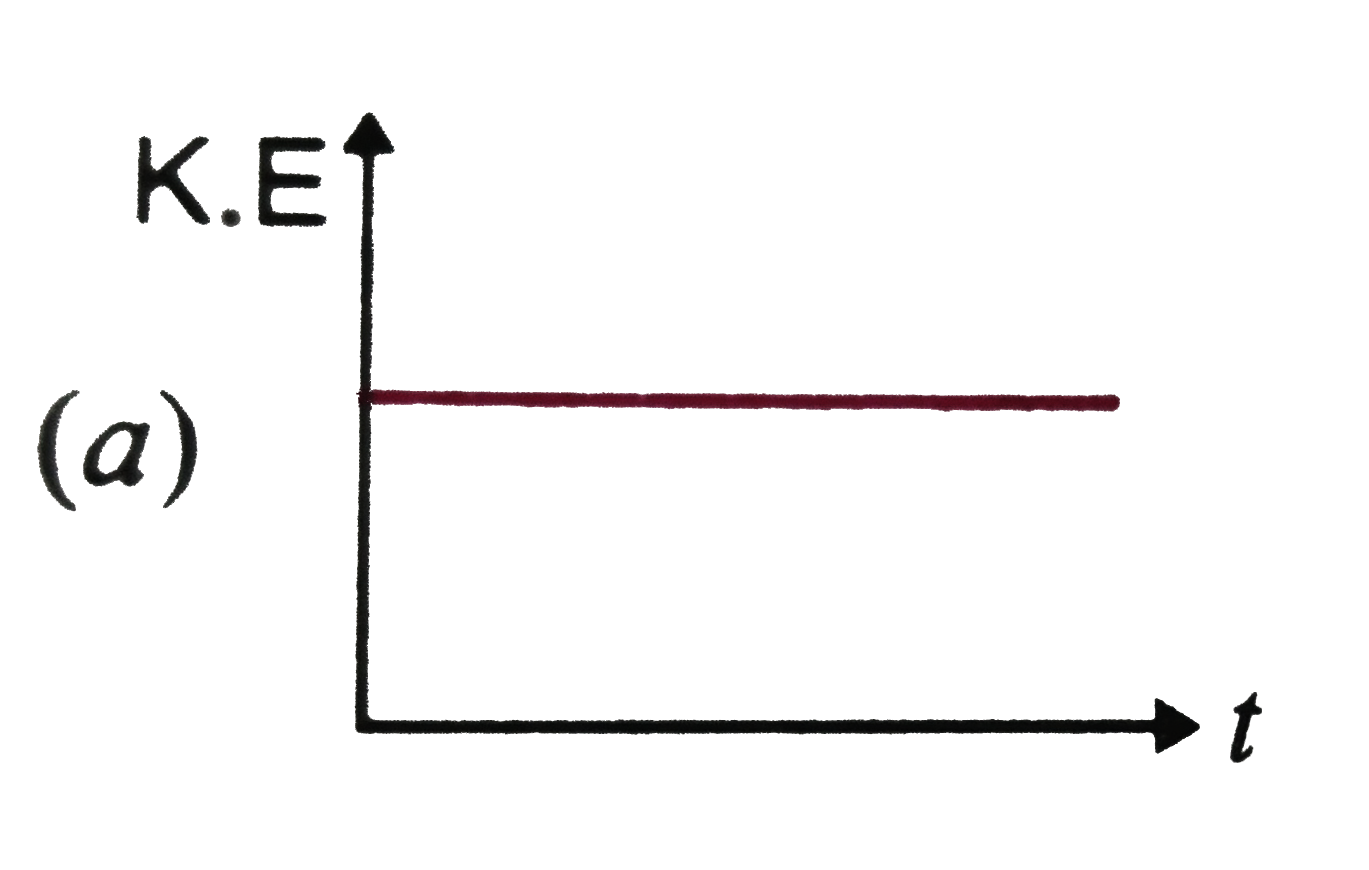 B
B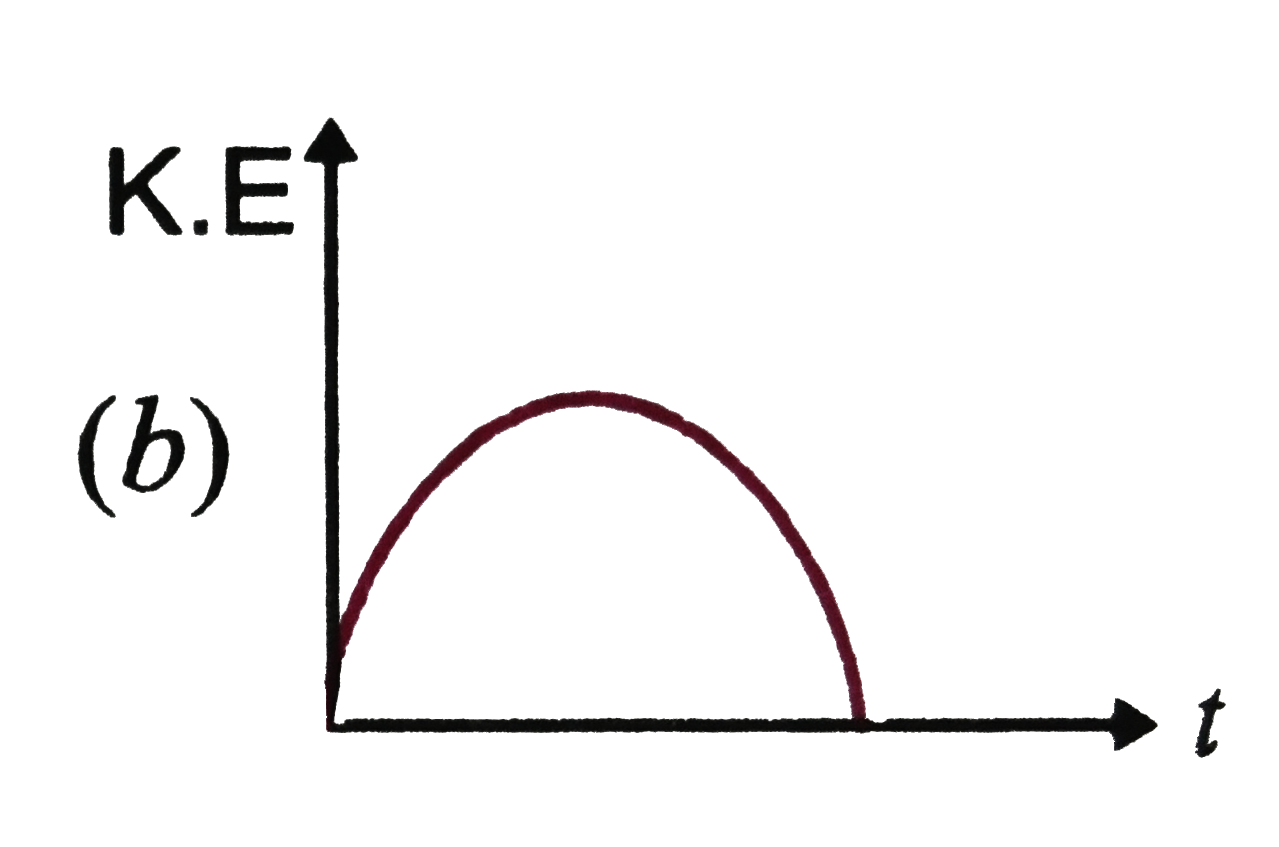 C
C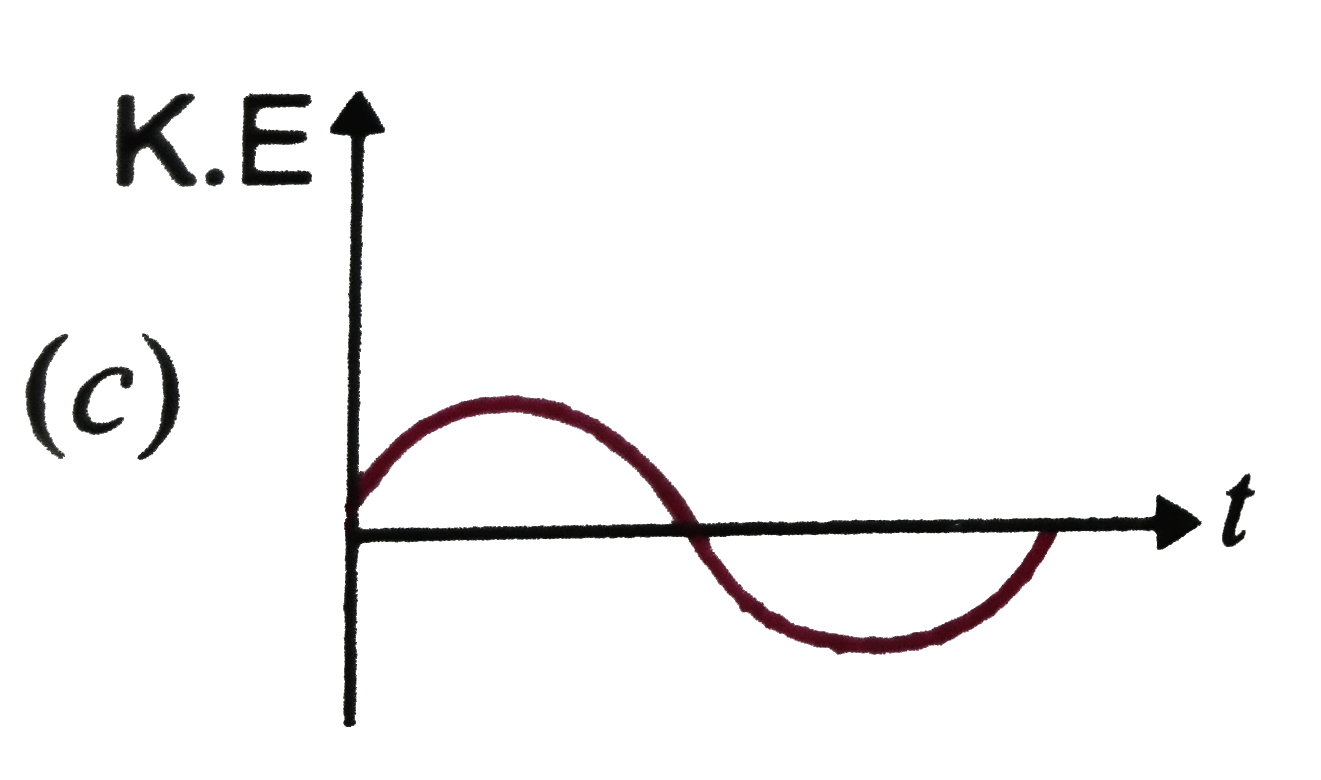 D
D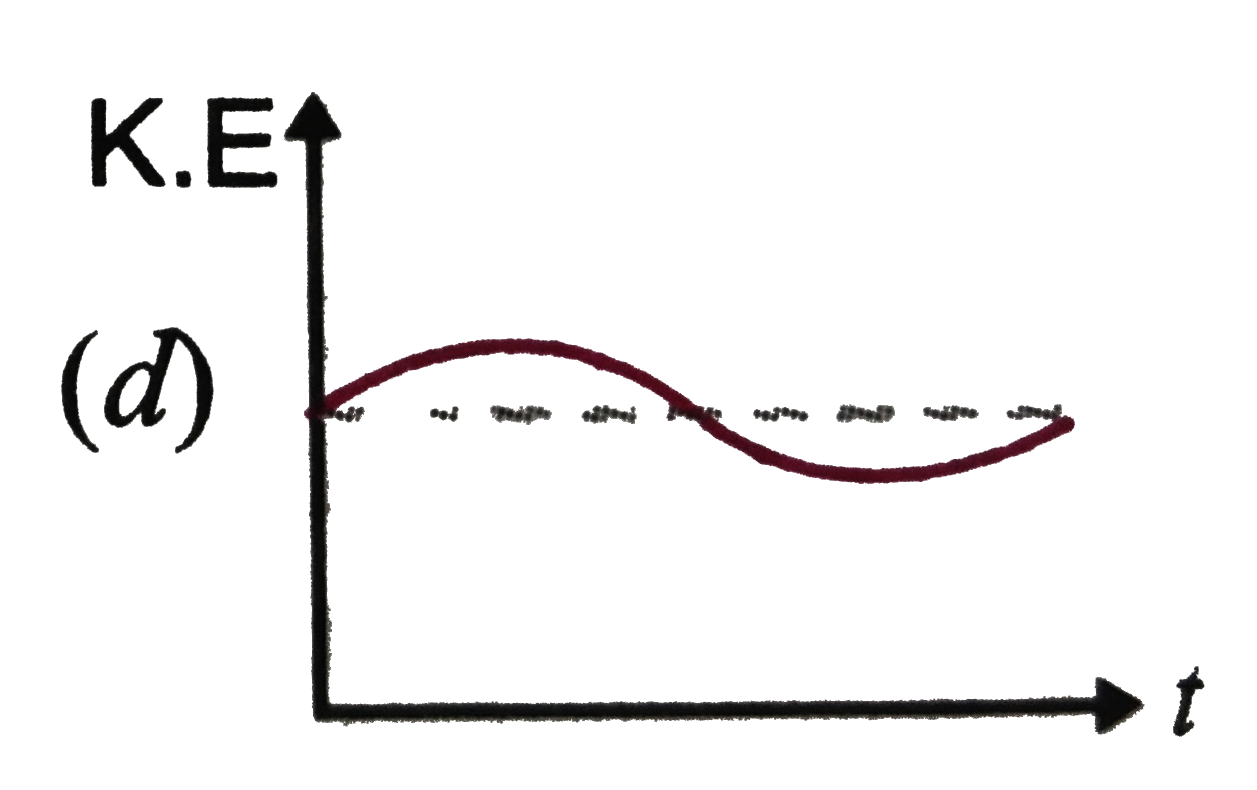
Which of the diagrams shown in figure. Most closely shows the variation inkinetic energy of the earth as it moves once around the sun in its elliptical orbit ?
A B
B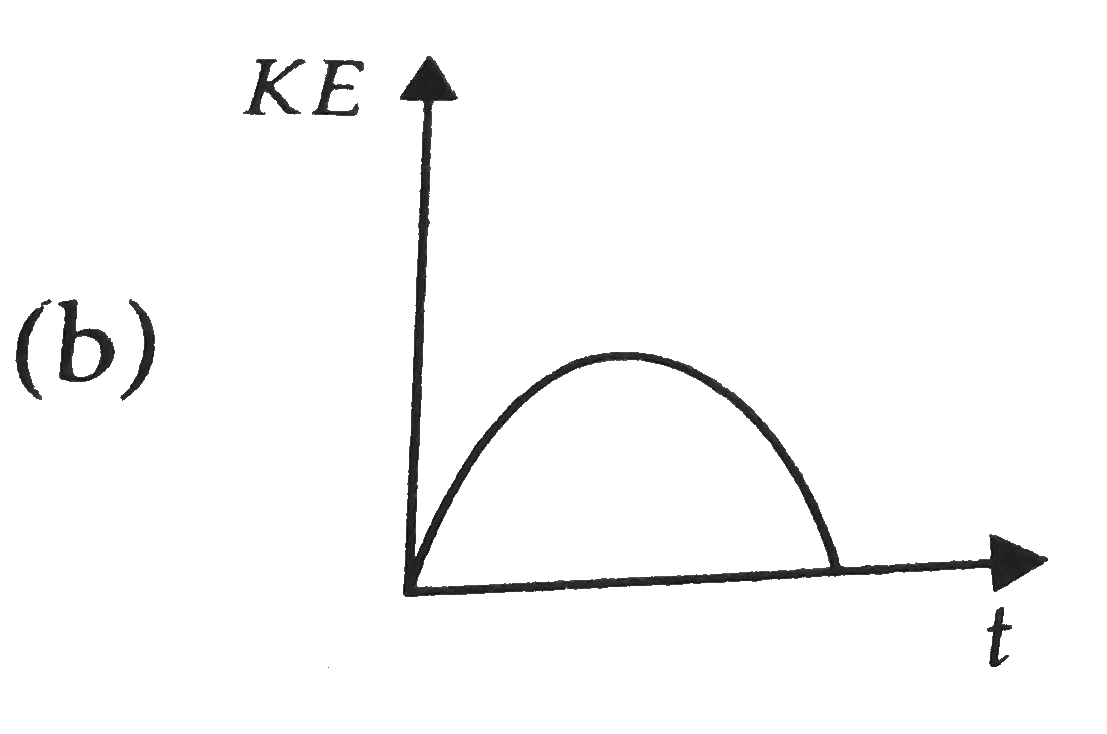 C
C D
D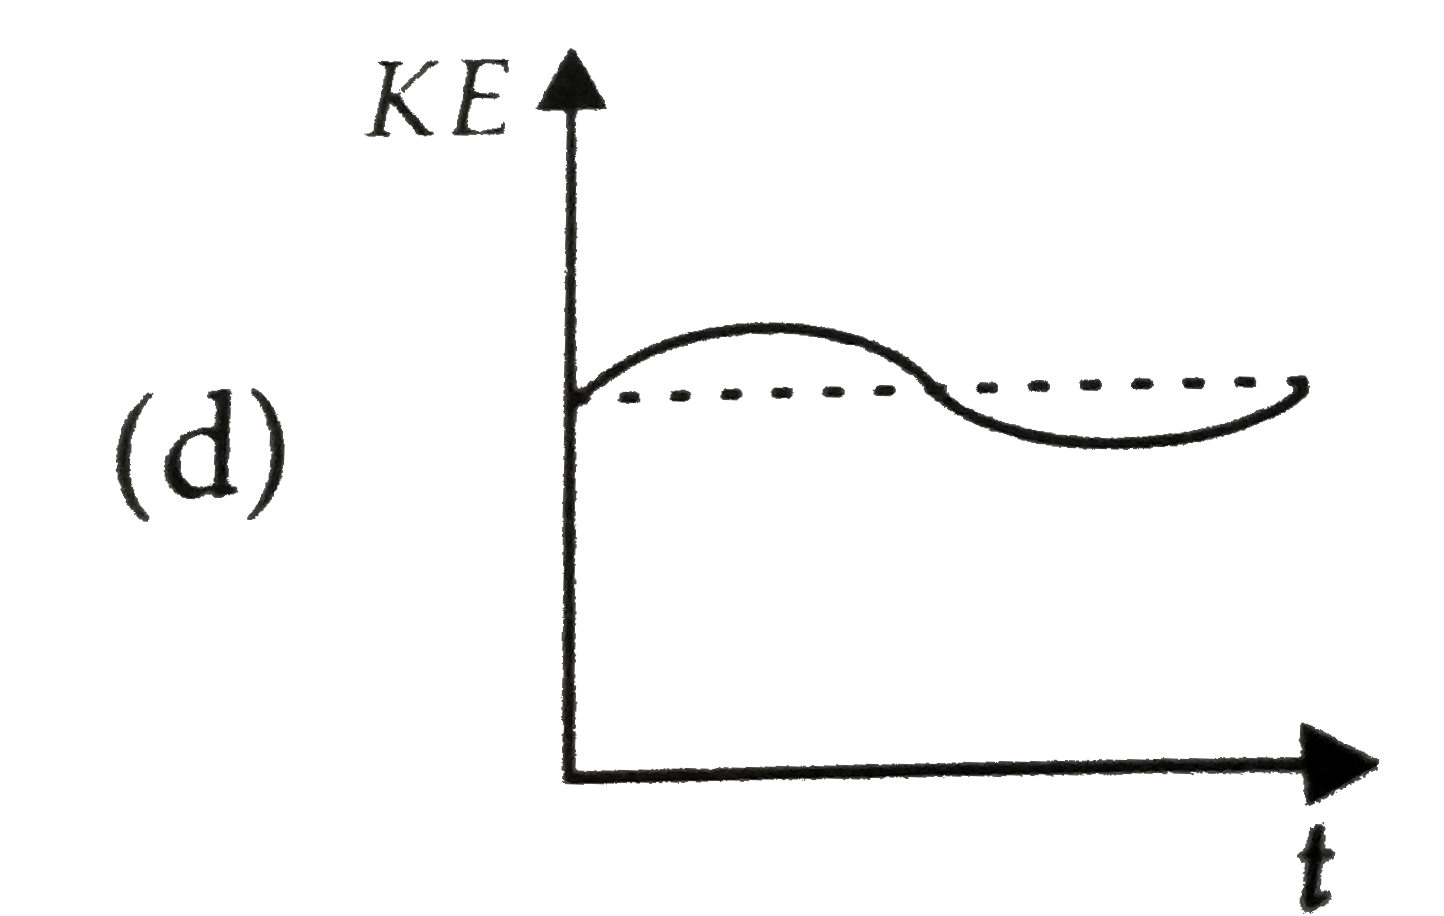
The earth revolves round the sun in an elliptical orbit. Its speed
Agoes on decreasing continuouslyBgreatest when it is closest to the sunCgreatest when it is farthest from the sunDconstant at all the points on the orbit
If the kinetic energy of a satellite orbiting around the earth is doubled then
View SolutionWhen the earth revolves round the sun in an elliptical orbit, its kinetic energy is
View SolutionA satellite revolves around the earth in an elliptical orbit. Its speed is
View SolutionIf the kinetic energy of a satellite orbiting around the earth is doubled then
View SolutionA satellite revolves around the earth in elliptic orbit ,its speed is :
View Solution
