The correct graph between surface tension T and temperature q in low temperature range is
A
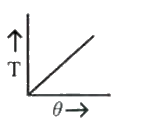
B
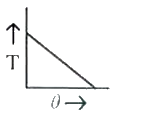
C
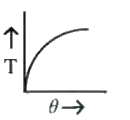
D
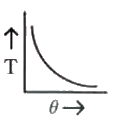
Text Solution
The correct Answer is:B
|
Topper's Solved these Questions
- MECHANICAL PROPERTIES OF FLUIDS BOOK - AAKASH SERIESCHAPTER - MECHANICAL PROPERTIES OF FLUIDS EXERCISE - EXERCISE-IB (ASSERTION & REASON)
46 Videos
- MECHANICAL PROPERTIES OF FLUIDS BOOK - AAKASH SERIESCHAPTER - MECHANICAL PROPERTIES OF FLUIDS EXERCISE - EXERCISE-2
68 Videos
- MECHANICAL PROPERTIES OF FLUIDS BOOK - AAKASH SERIESCHAPTER - MECHANICAL PROPERTIES OF FLUIDS EXERCISE - EXERCISE-3
43 Videos
- LAWS OF MOTIONBOOK - AAKASH SERIESCHAPTER - LAWS OF MOTIONEXERCISE - PRACTICE EXERCISE
108 Videos
- MECHANICAL PROPERTIES OF SOLIDSBOOK - AAKASH SERIESCHAPTER - MECHANICAL PROPERTIES OF SOLIDSEXERCISE - EXERCISE - 3
26 Videos
Similar Questions
Knowledge Check
The graph between surface tension and temperature T is
A B
B C
C D
D
Which graph represents the variation of surface tension with temperature over small temperature ranges for water?
A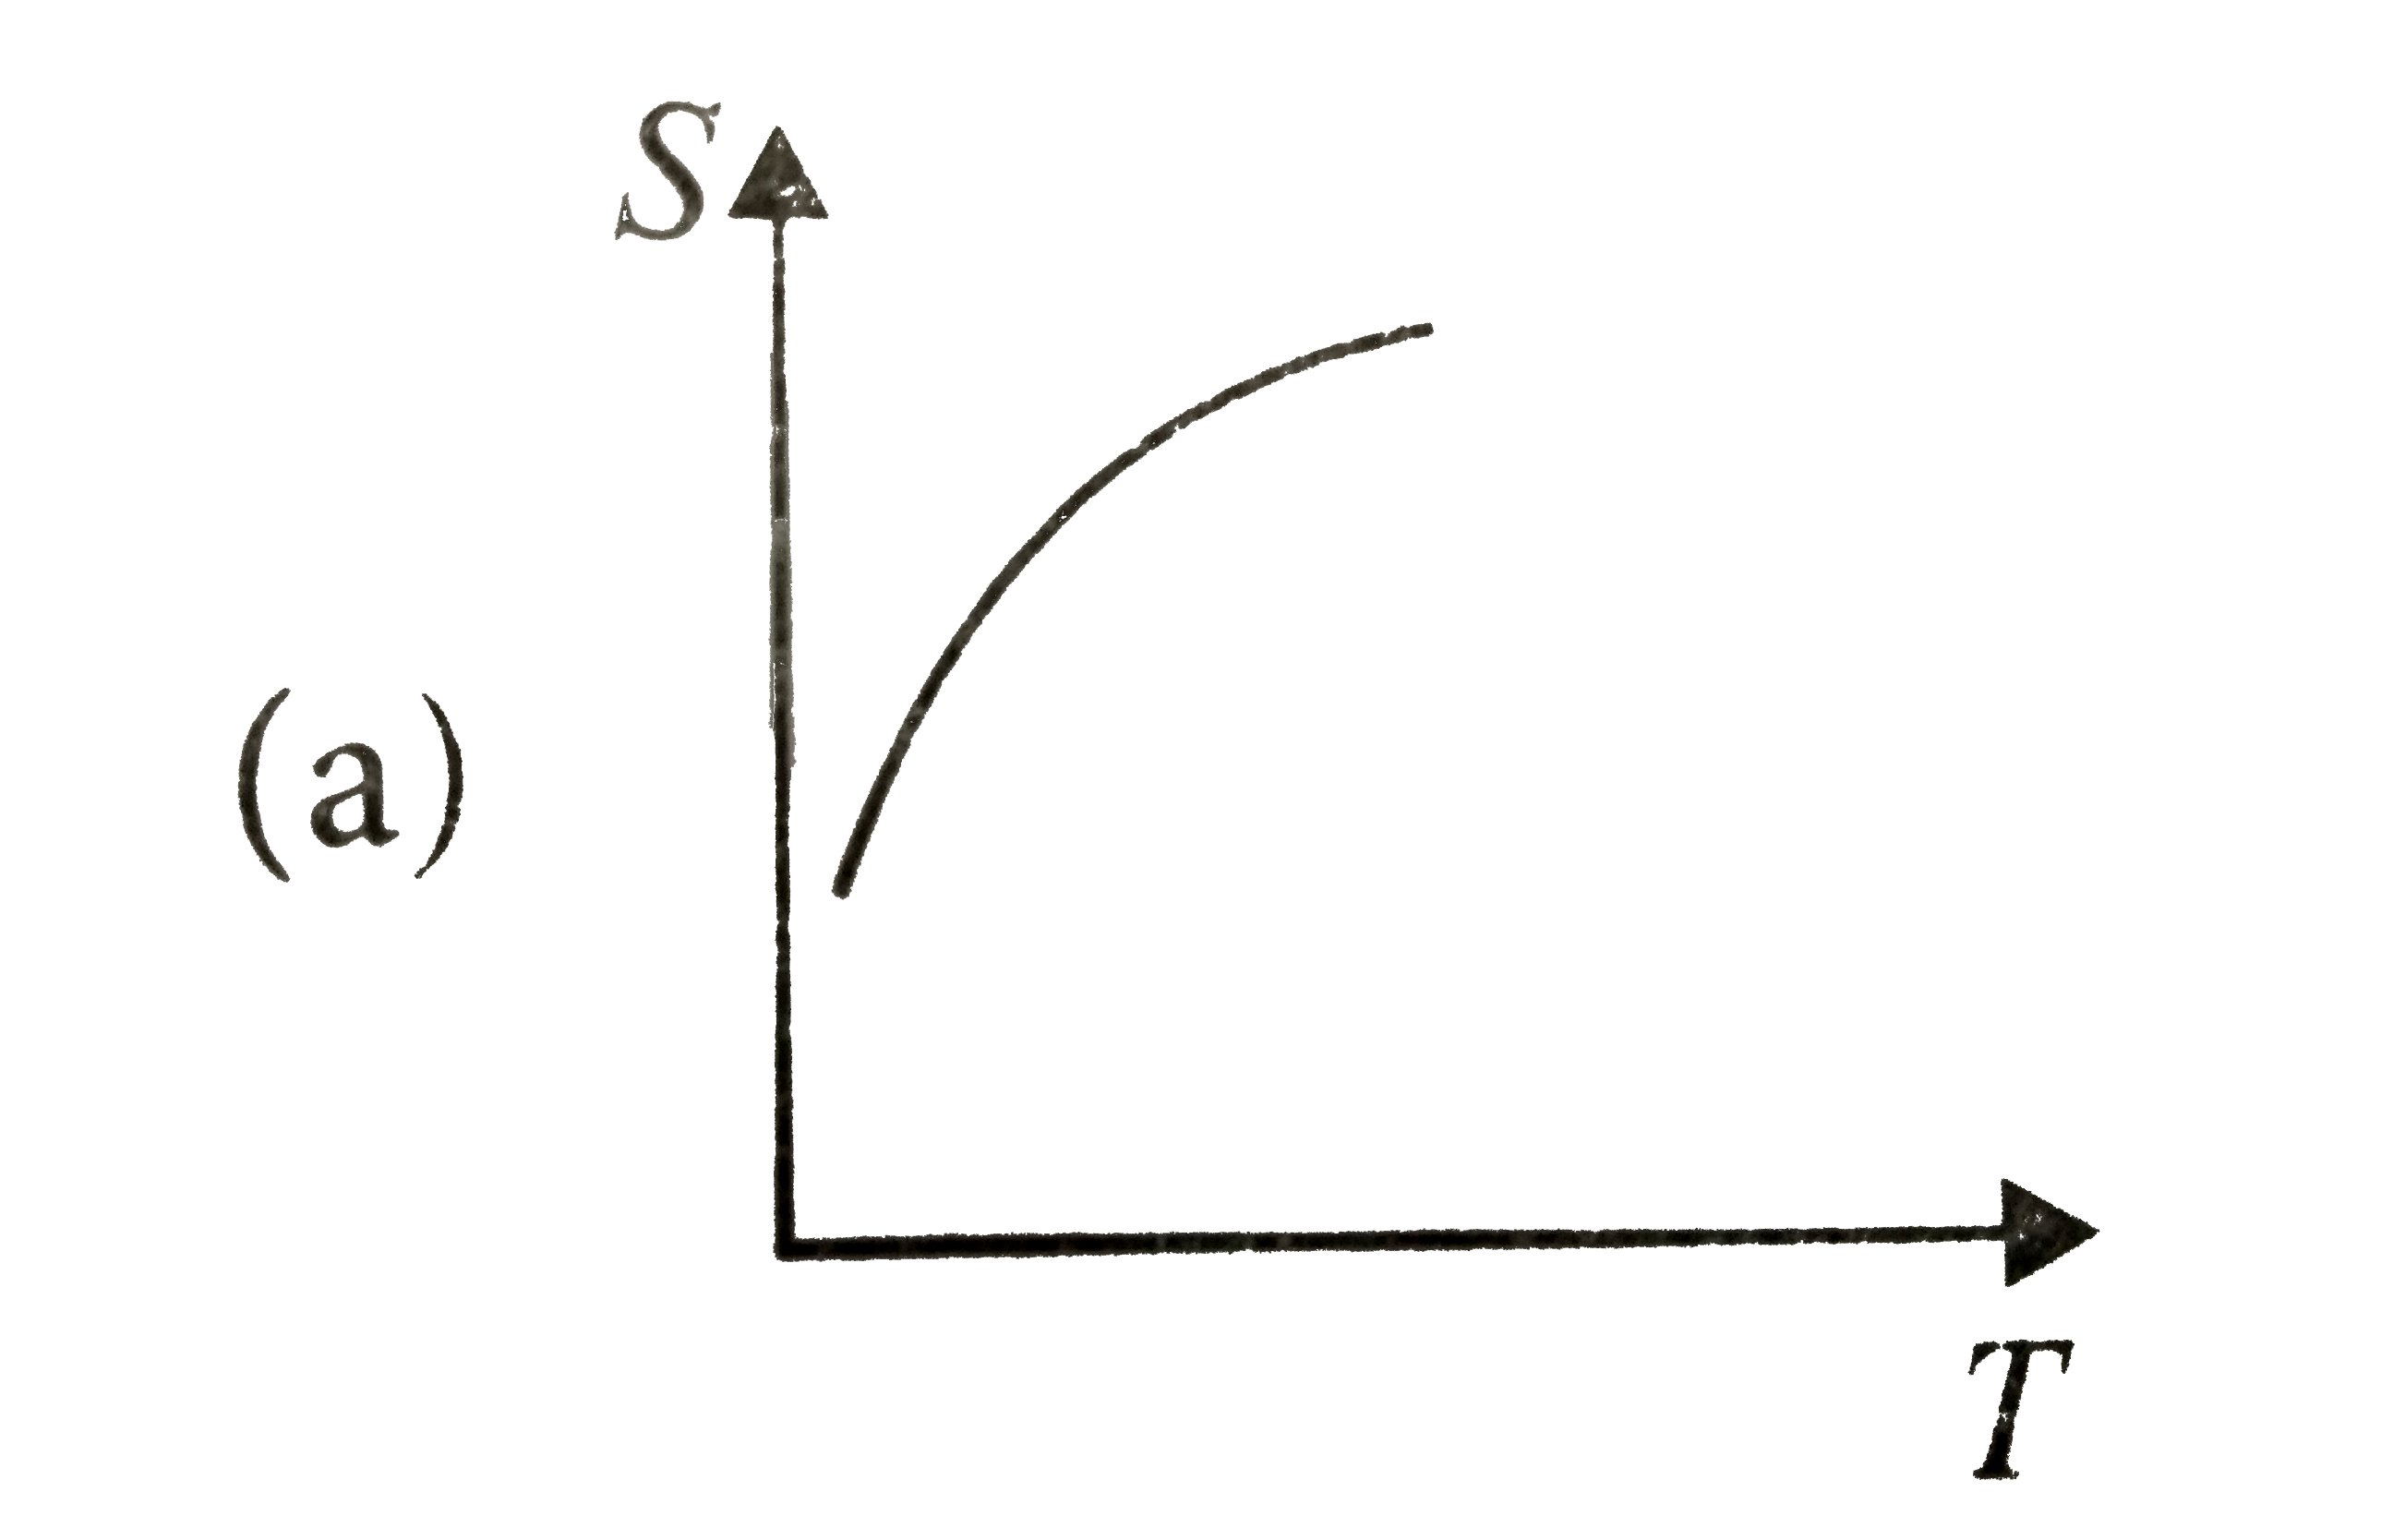 B
B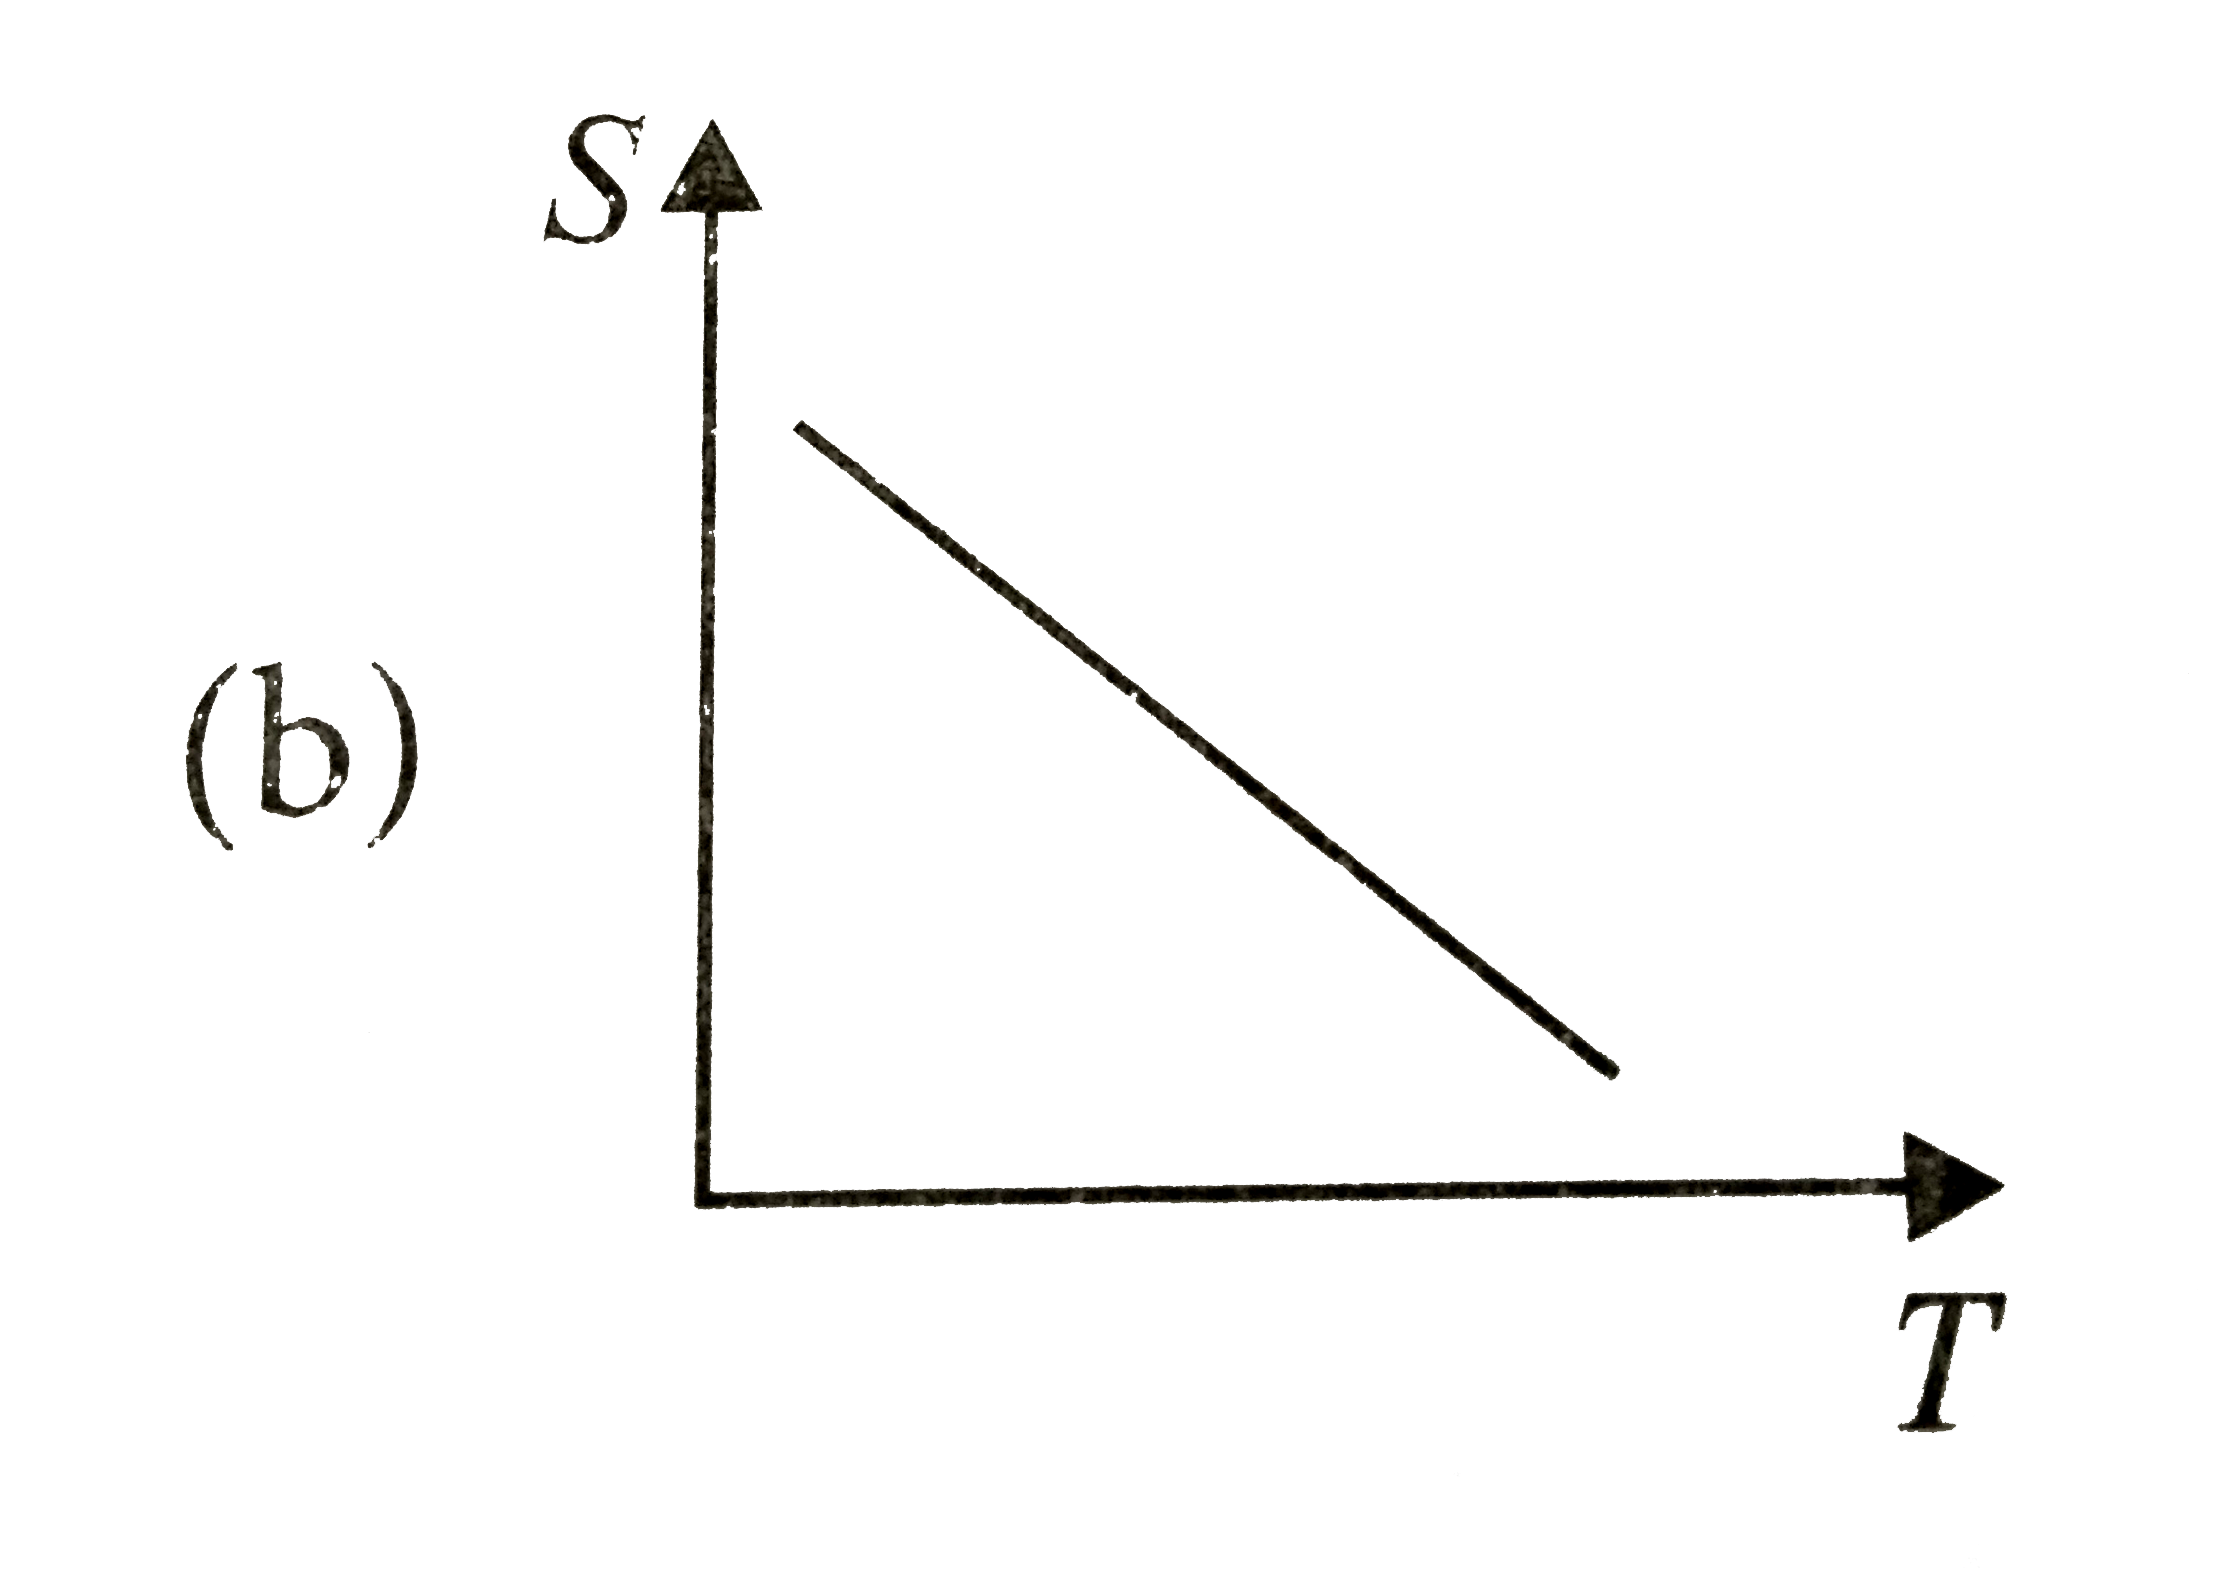 C
C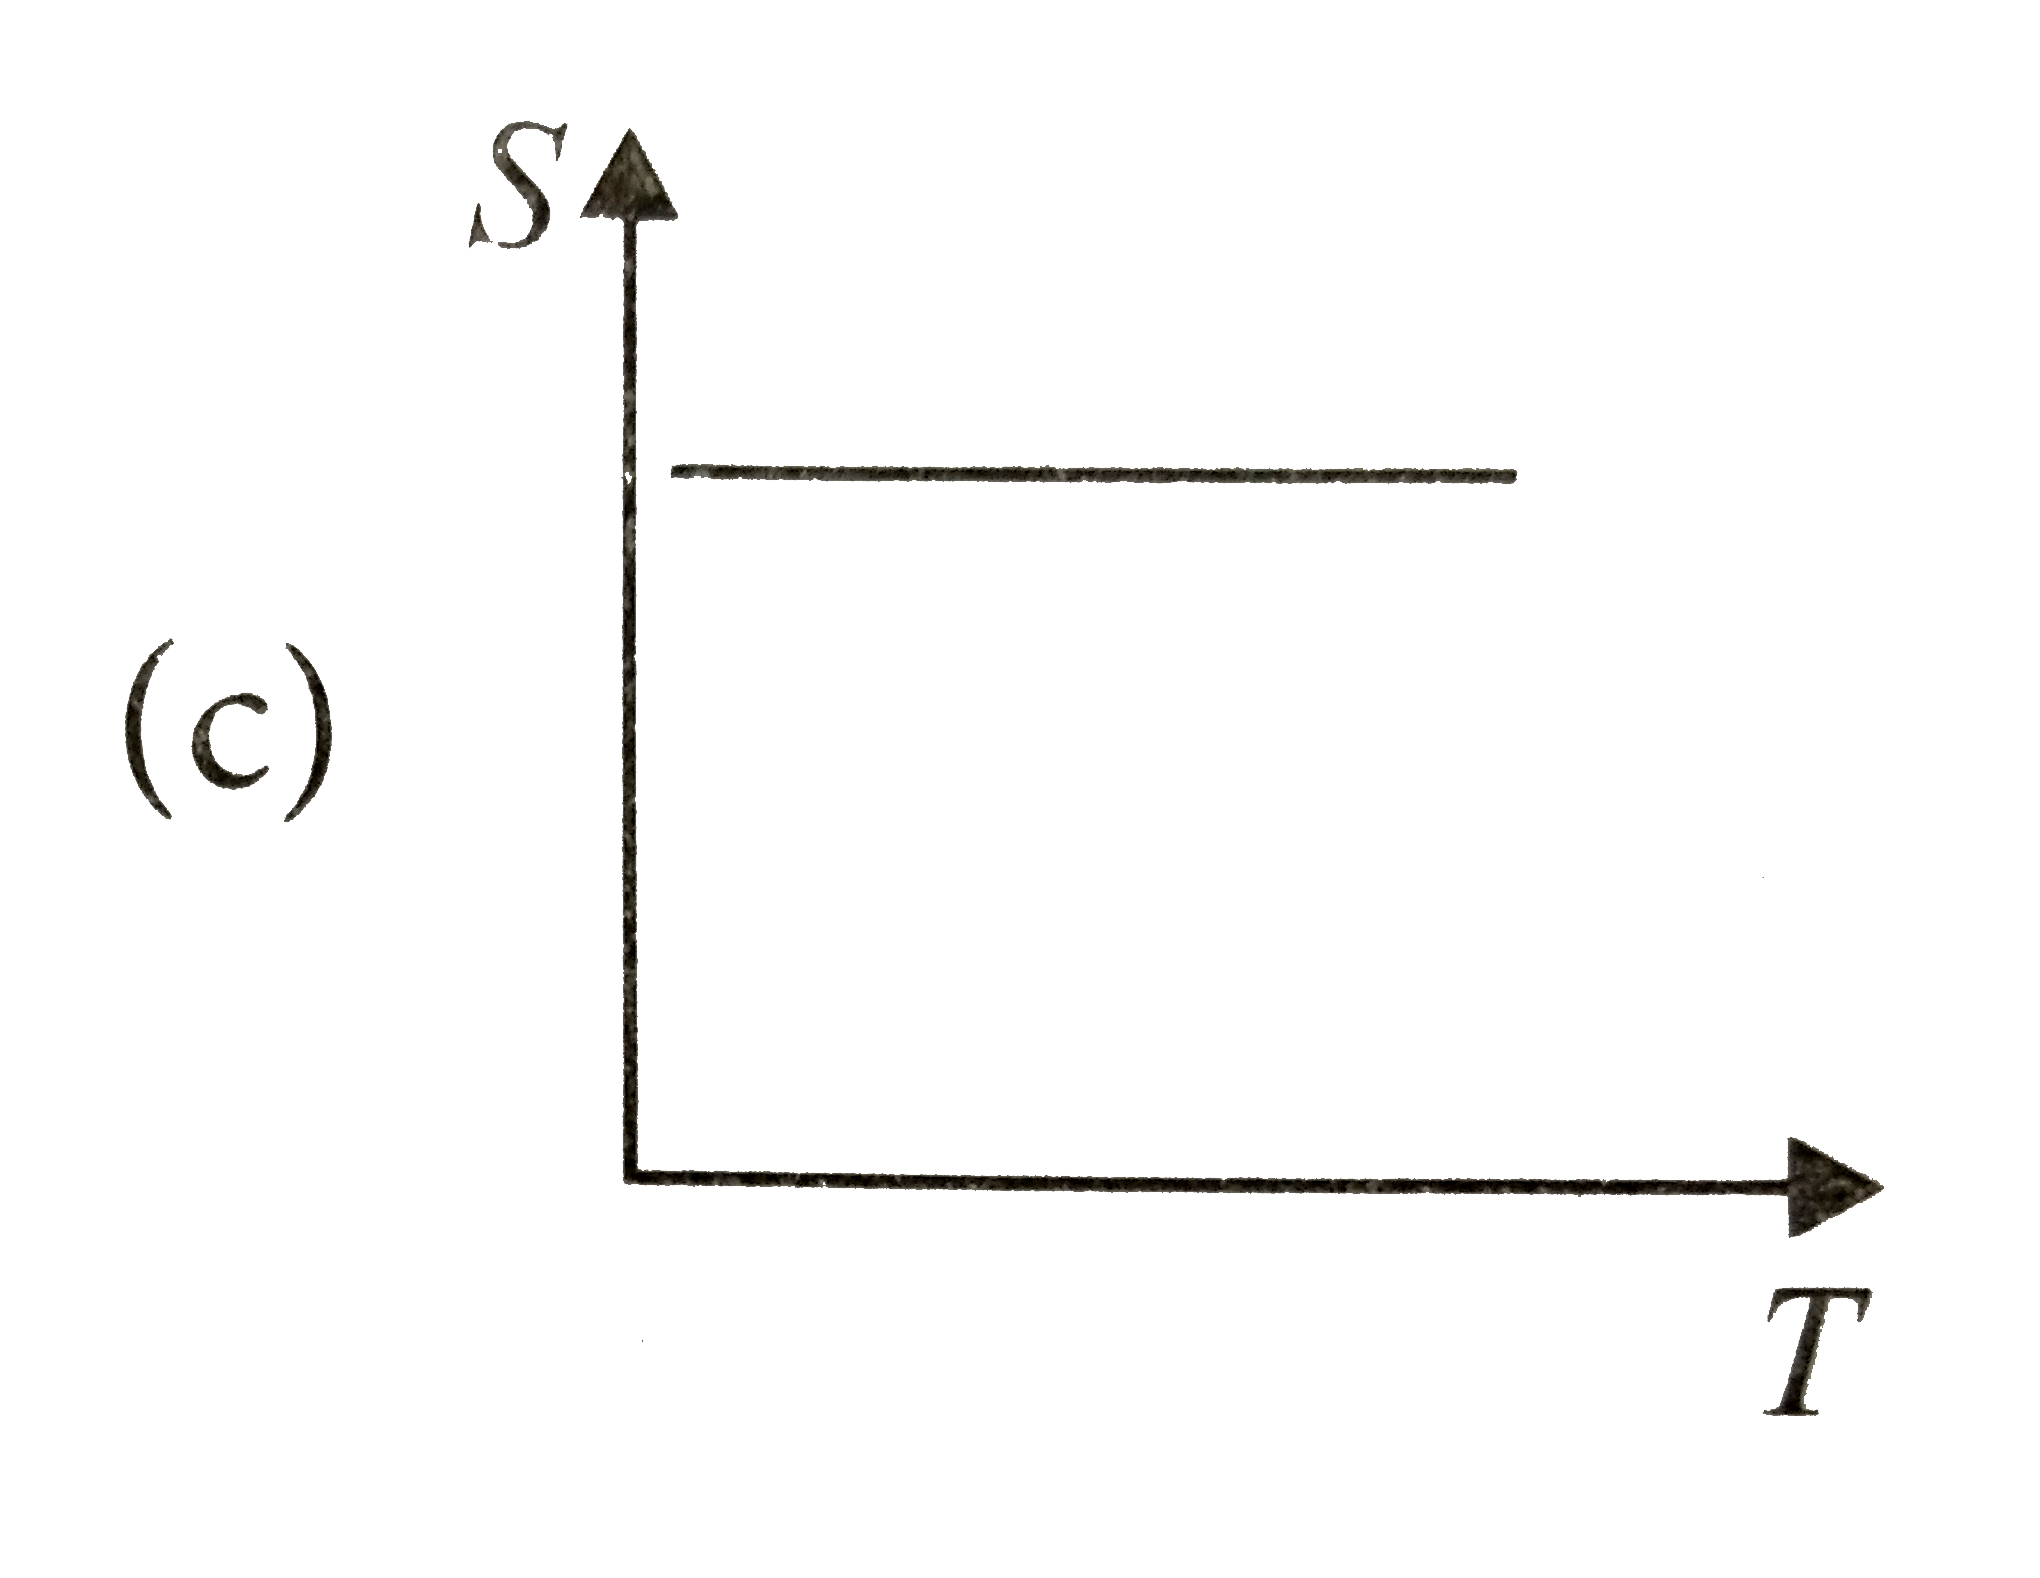 D
D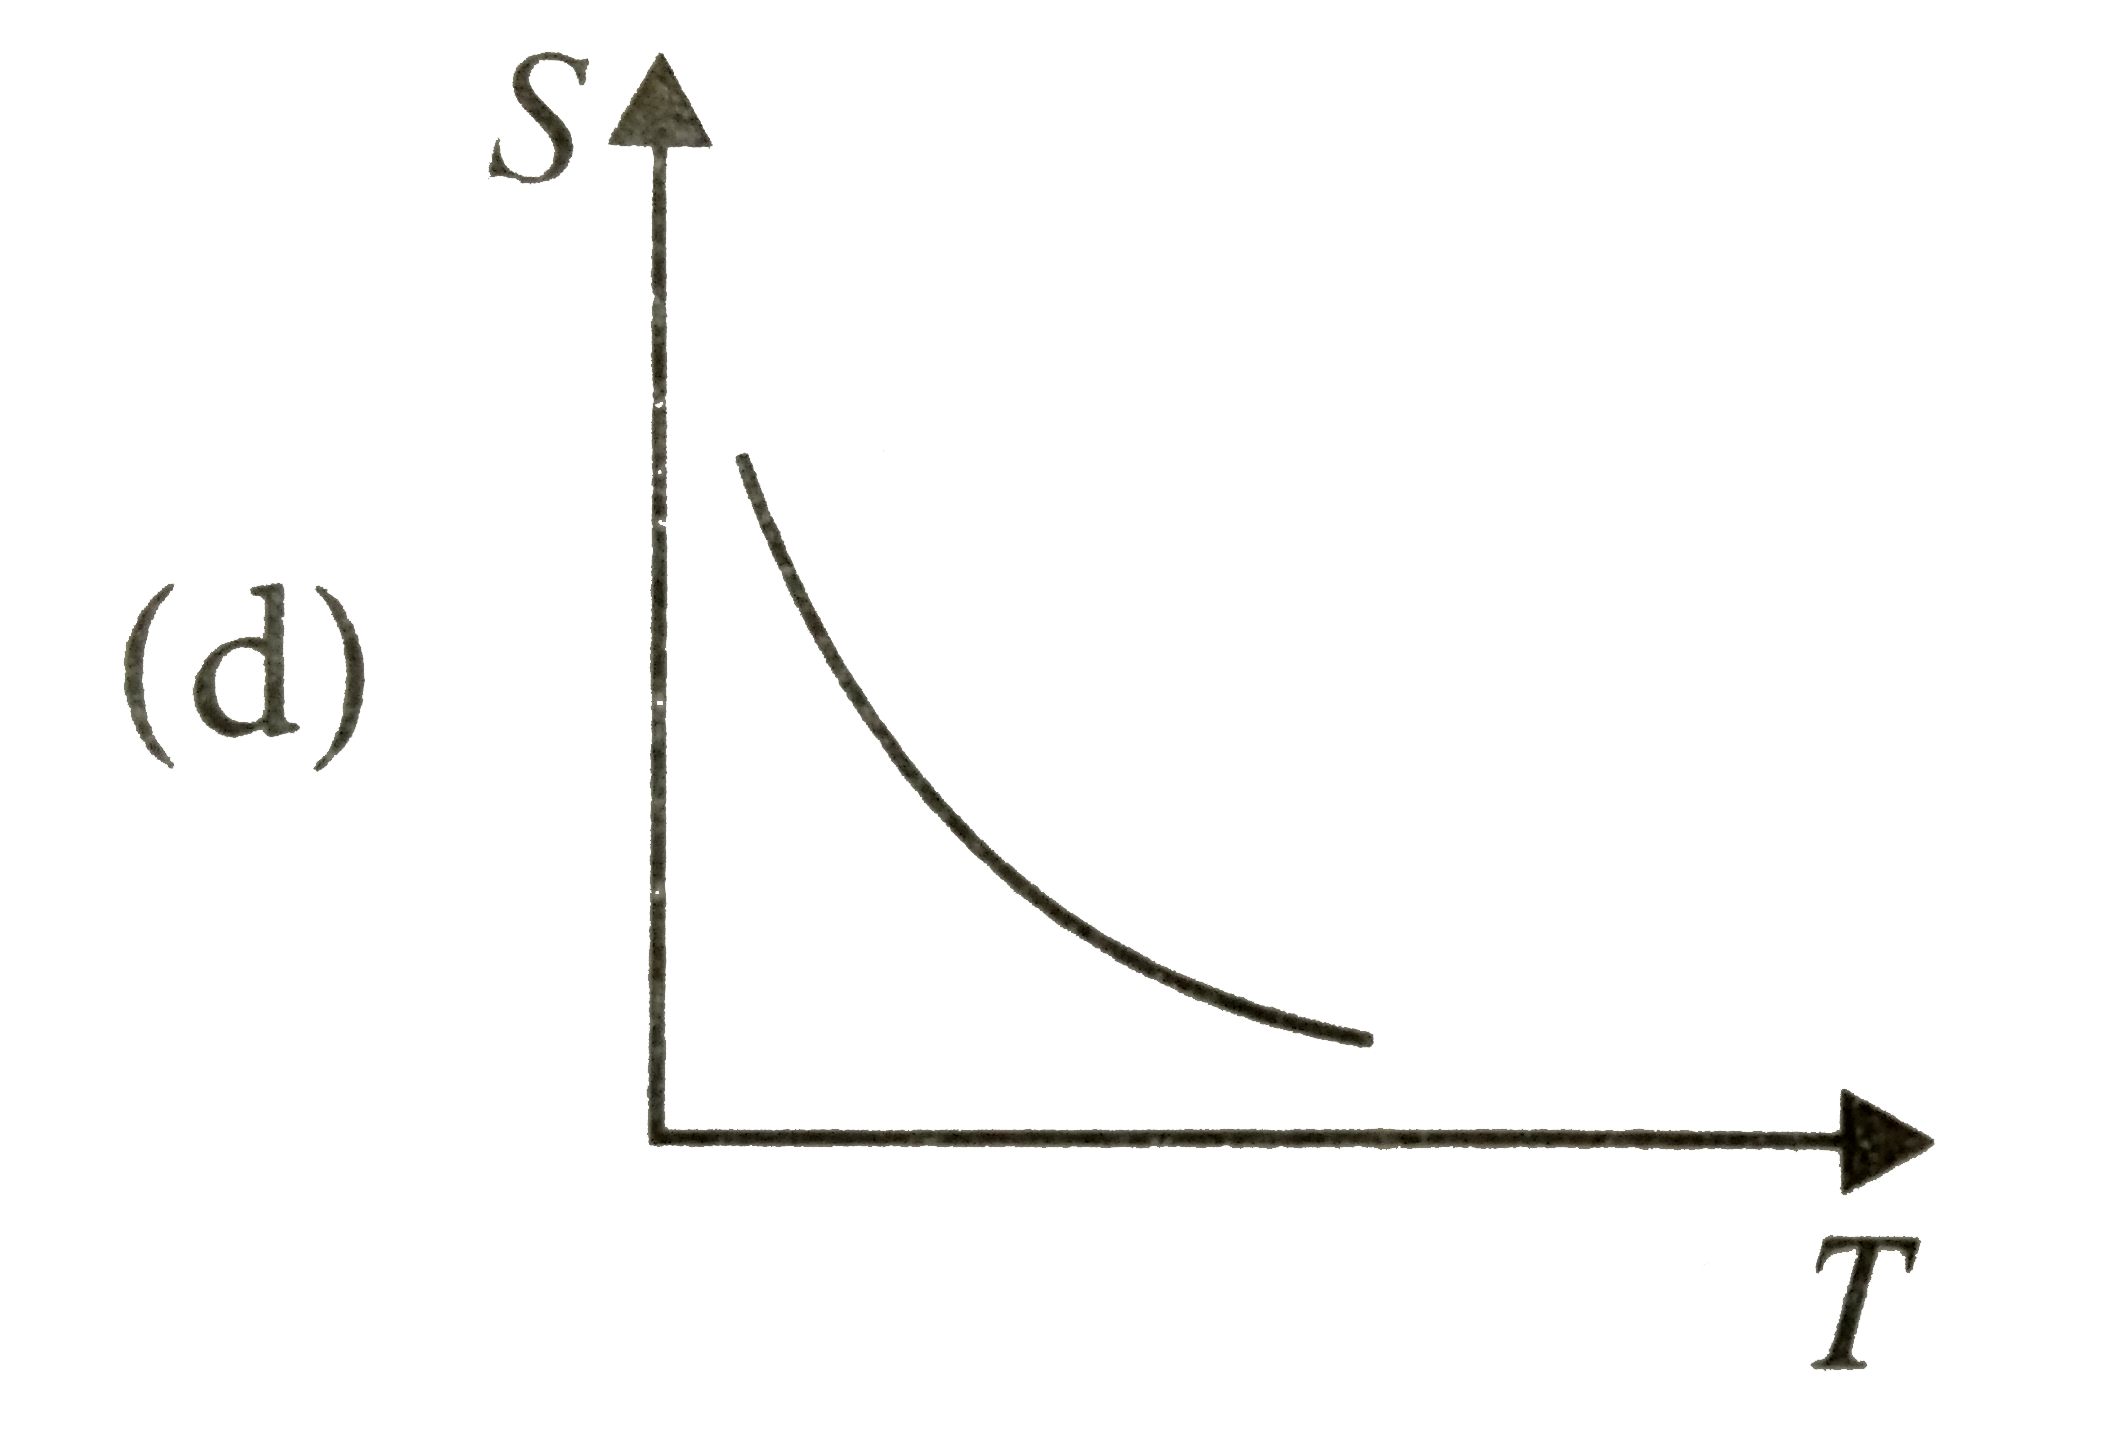
The graph between resistivity and temperature, for a limited range of temperature, is a straight line for a material like
AcopperBnichromeCsiliconDmercury
What is the correct relation between critical temperature Tc, Boyle's temperature TB and inversion temperature Ti.
View SolutionThe correct graph between v2 (square of the speed of sound) and absolute temperature T of the gas is
View SolutionThe value of surface tension of a liquid at critical temperature
View SolutionThe surface tension of a liquid ____ with rise of temperature.
View SolutionThe graph between the (velocity)2 and temperature T of a gas is
View Solution
