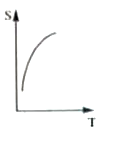
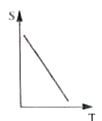
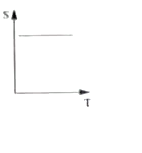
Which of the following graph shows the variation of surface tension with temperature over small temperature ranges for water?
A
B
C
D
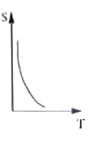
Text Solution
The correct Answer is:B
|
Topper's Solved these Questions
- MECHANICAL PROPERTIES OF FLUIDS BOOK - AAKASH SERIESCHAPTER - MECHANICAL PROPERTIES OF FLUIDS EXERCISE - EXERCISE-IB (ASSERTION & REASON)
46 Videos
- MECHANICAL PROPERTIES OF FLUIDS BOOK - AAKASH SERIESCHAPTER - MECHANICAL PROPERTIES OF FLUIDS EXERCISE - EXERCISE-2
68 Videos
- MECHANICAL PROPERTIES OF FLUIDS BOOK - AAKASH SERIESCHAPTER - MECHANICAL PROPERTIES OF FLUIDS EXERCISE - EXERCISE-3
43 Videos
- LAWS OF MOTIONBOOK - AAKASH SERIESCHAPTER - LAWS OF MOTIONEXERCISE - PRACTICE EXERCISE
108 Videos
- MECHANICAL PROPERTIES OF SOLIDSBOOK - AAKASH SERIESCHAPTER - MECHANICAL PROPERTIES OF SOLIDSEXERCISE - EXERCISE - 3
26 Videos
Similar Questions
Knowledge Check
Which graph represents the variation of surface tension with temperature over small temperature ranges for water?
A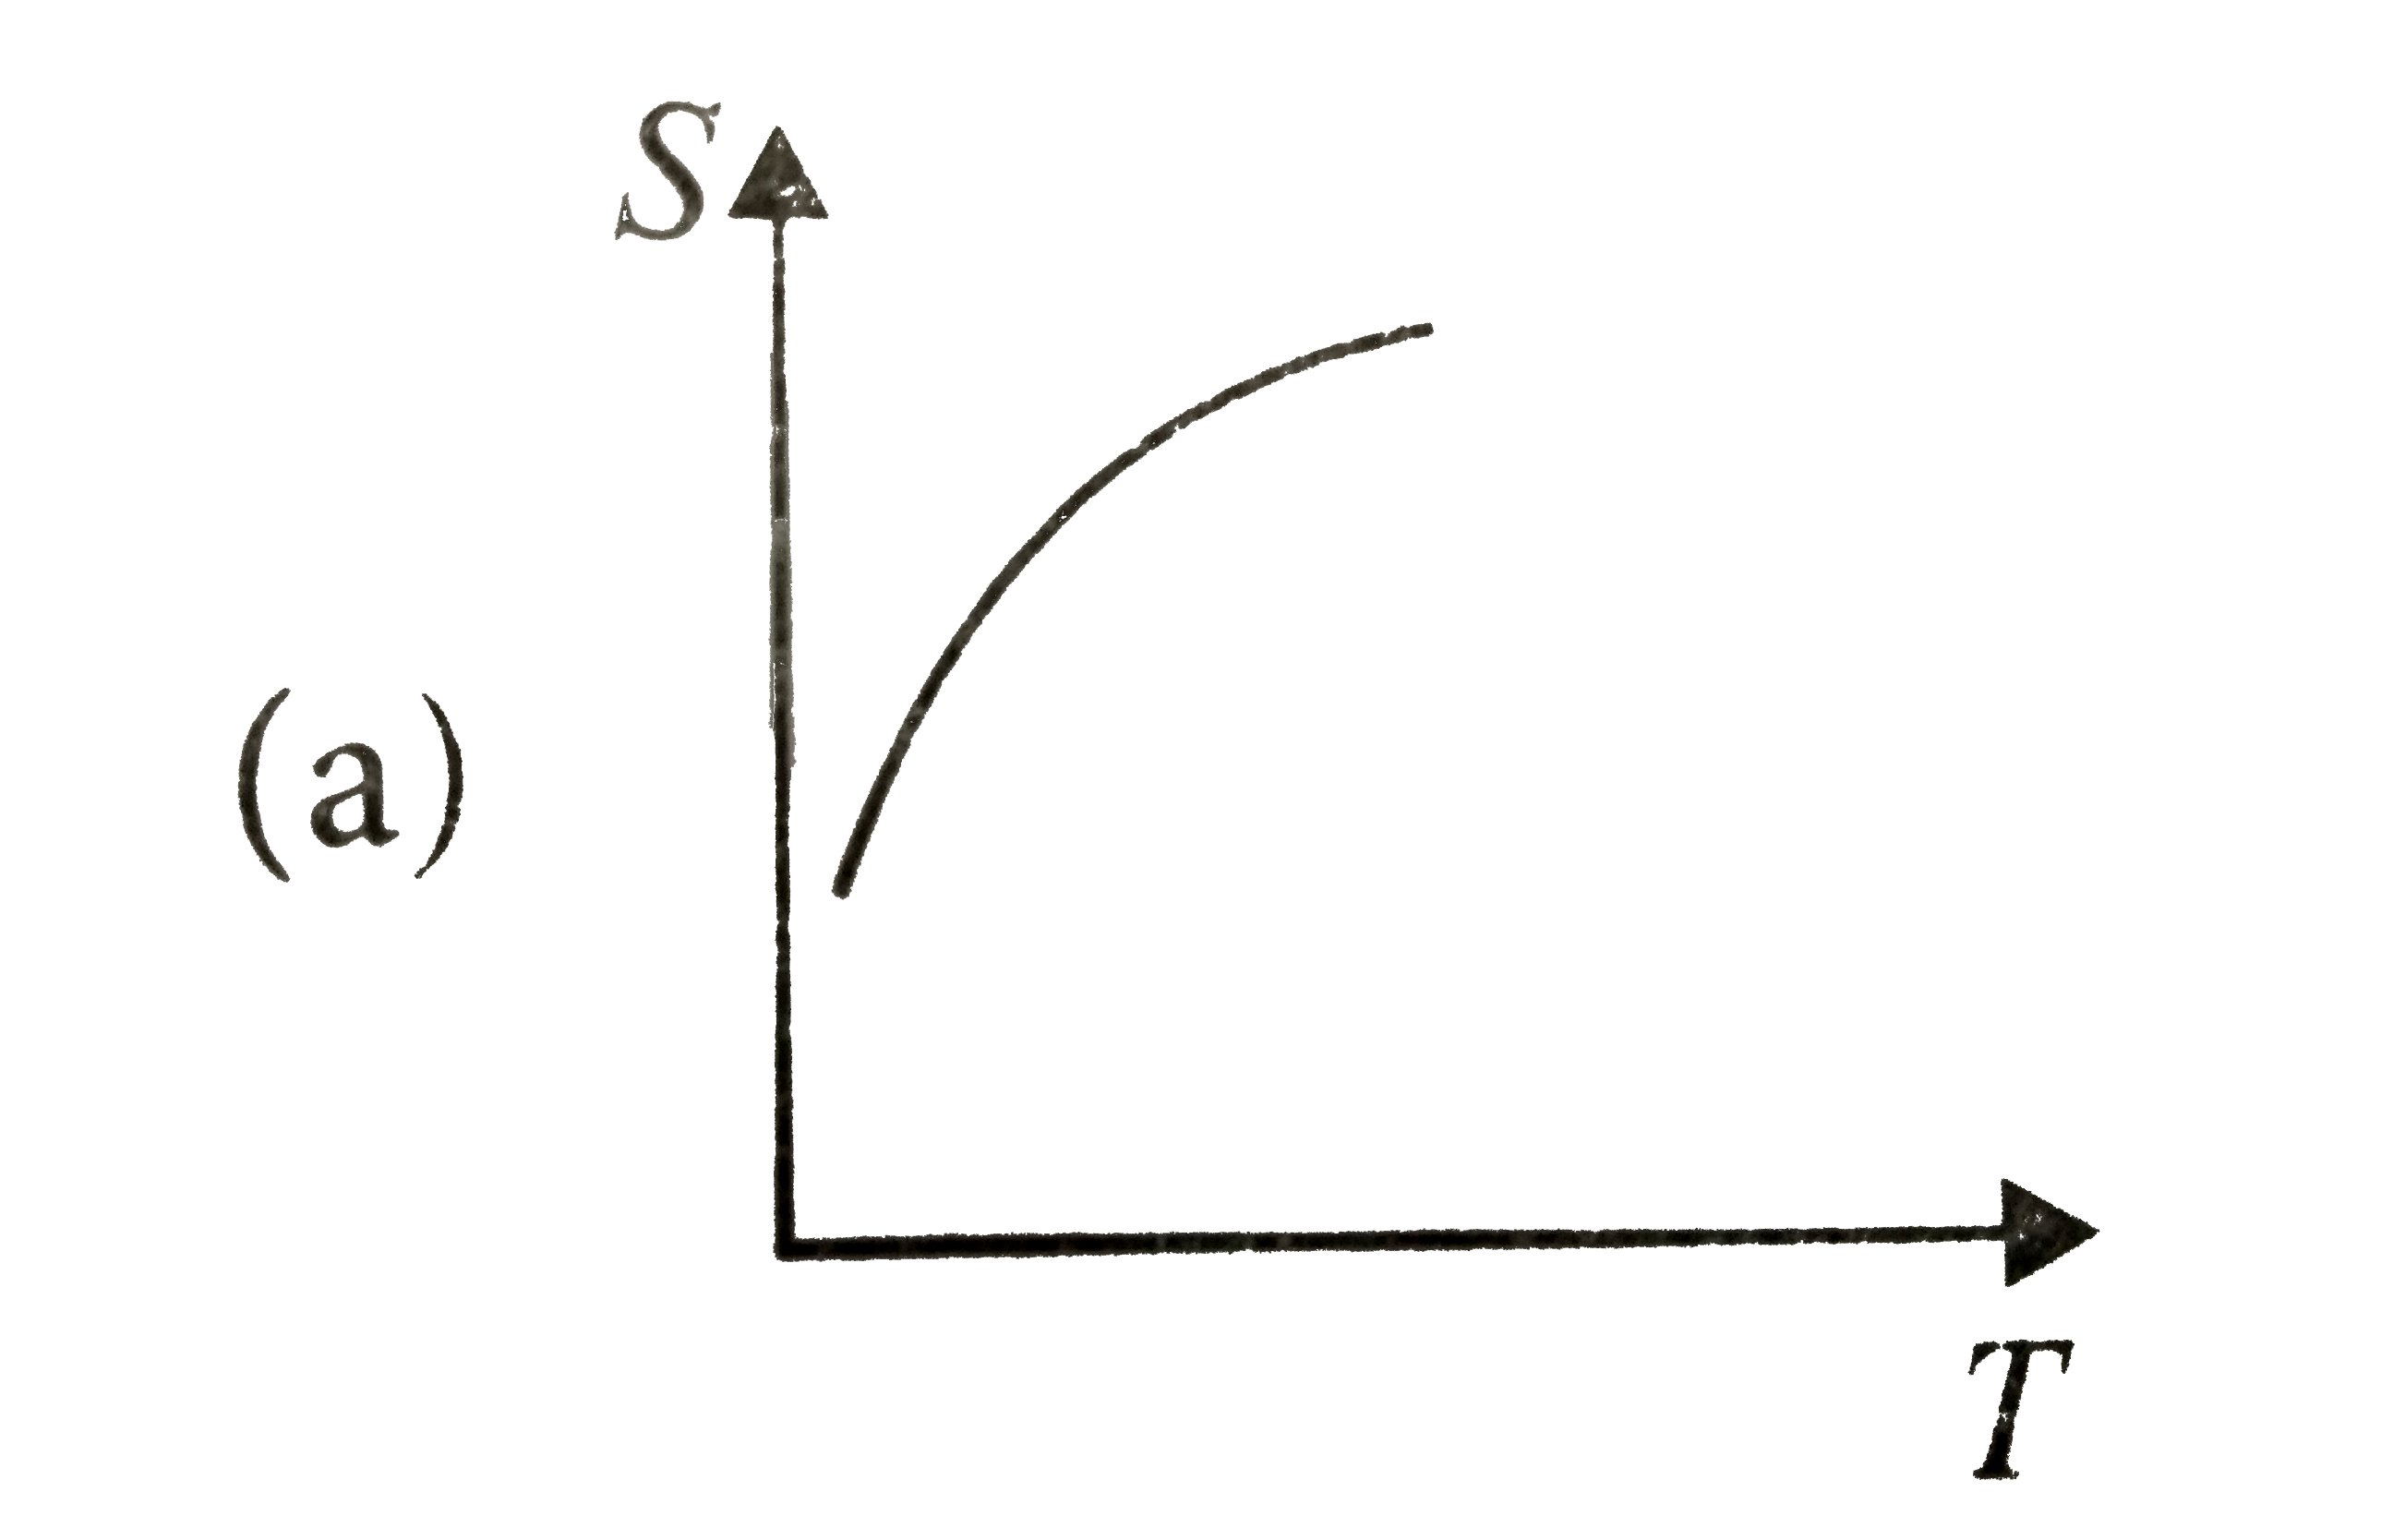 B
B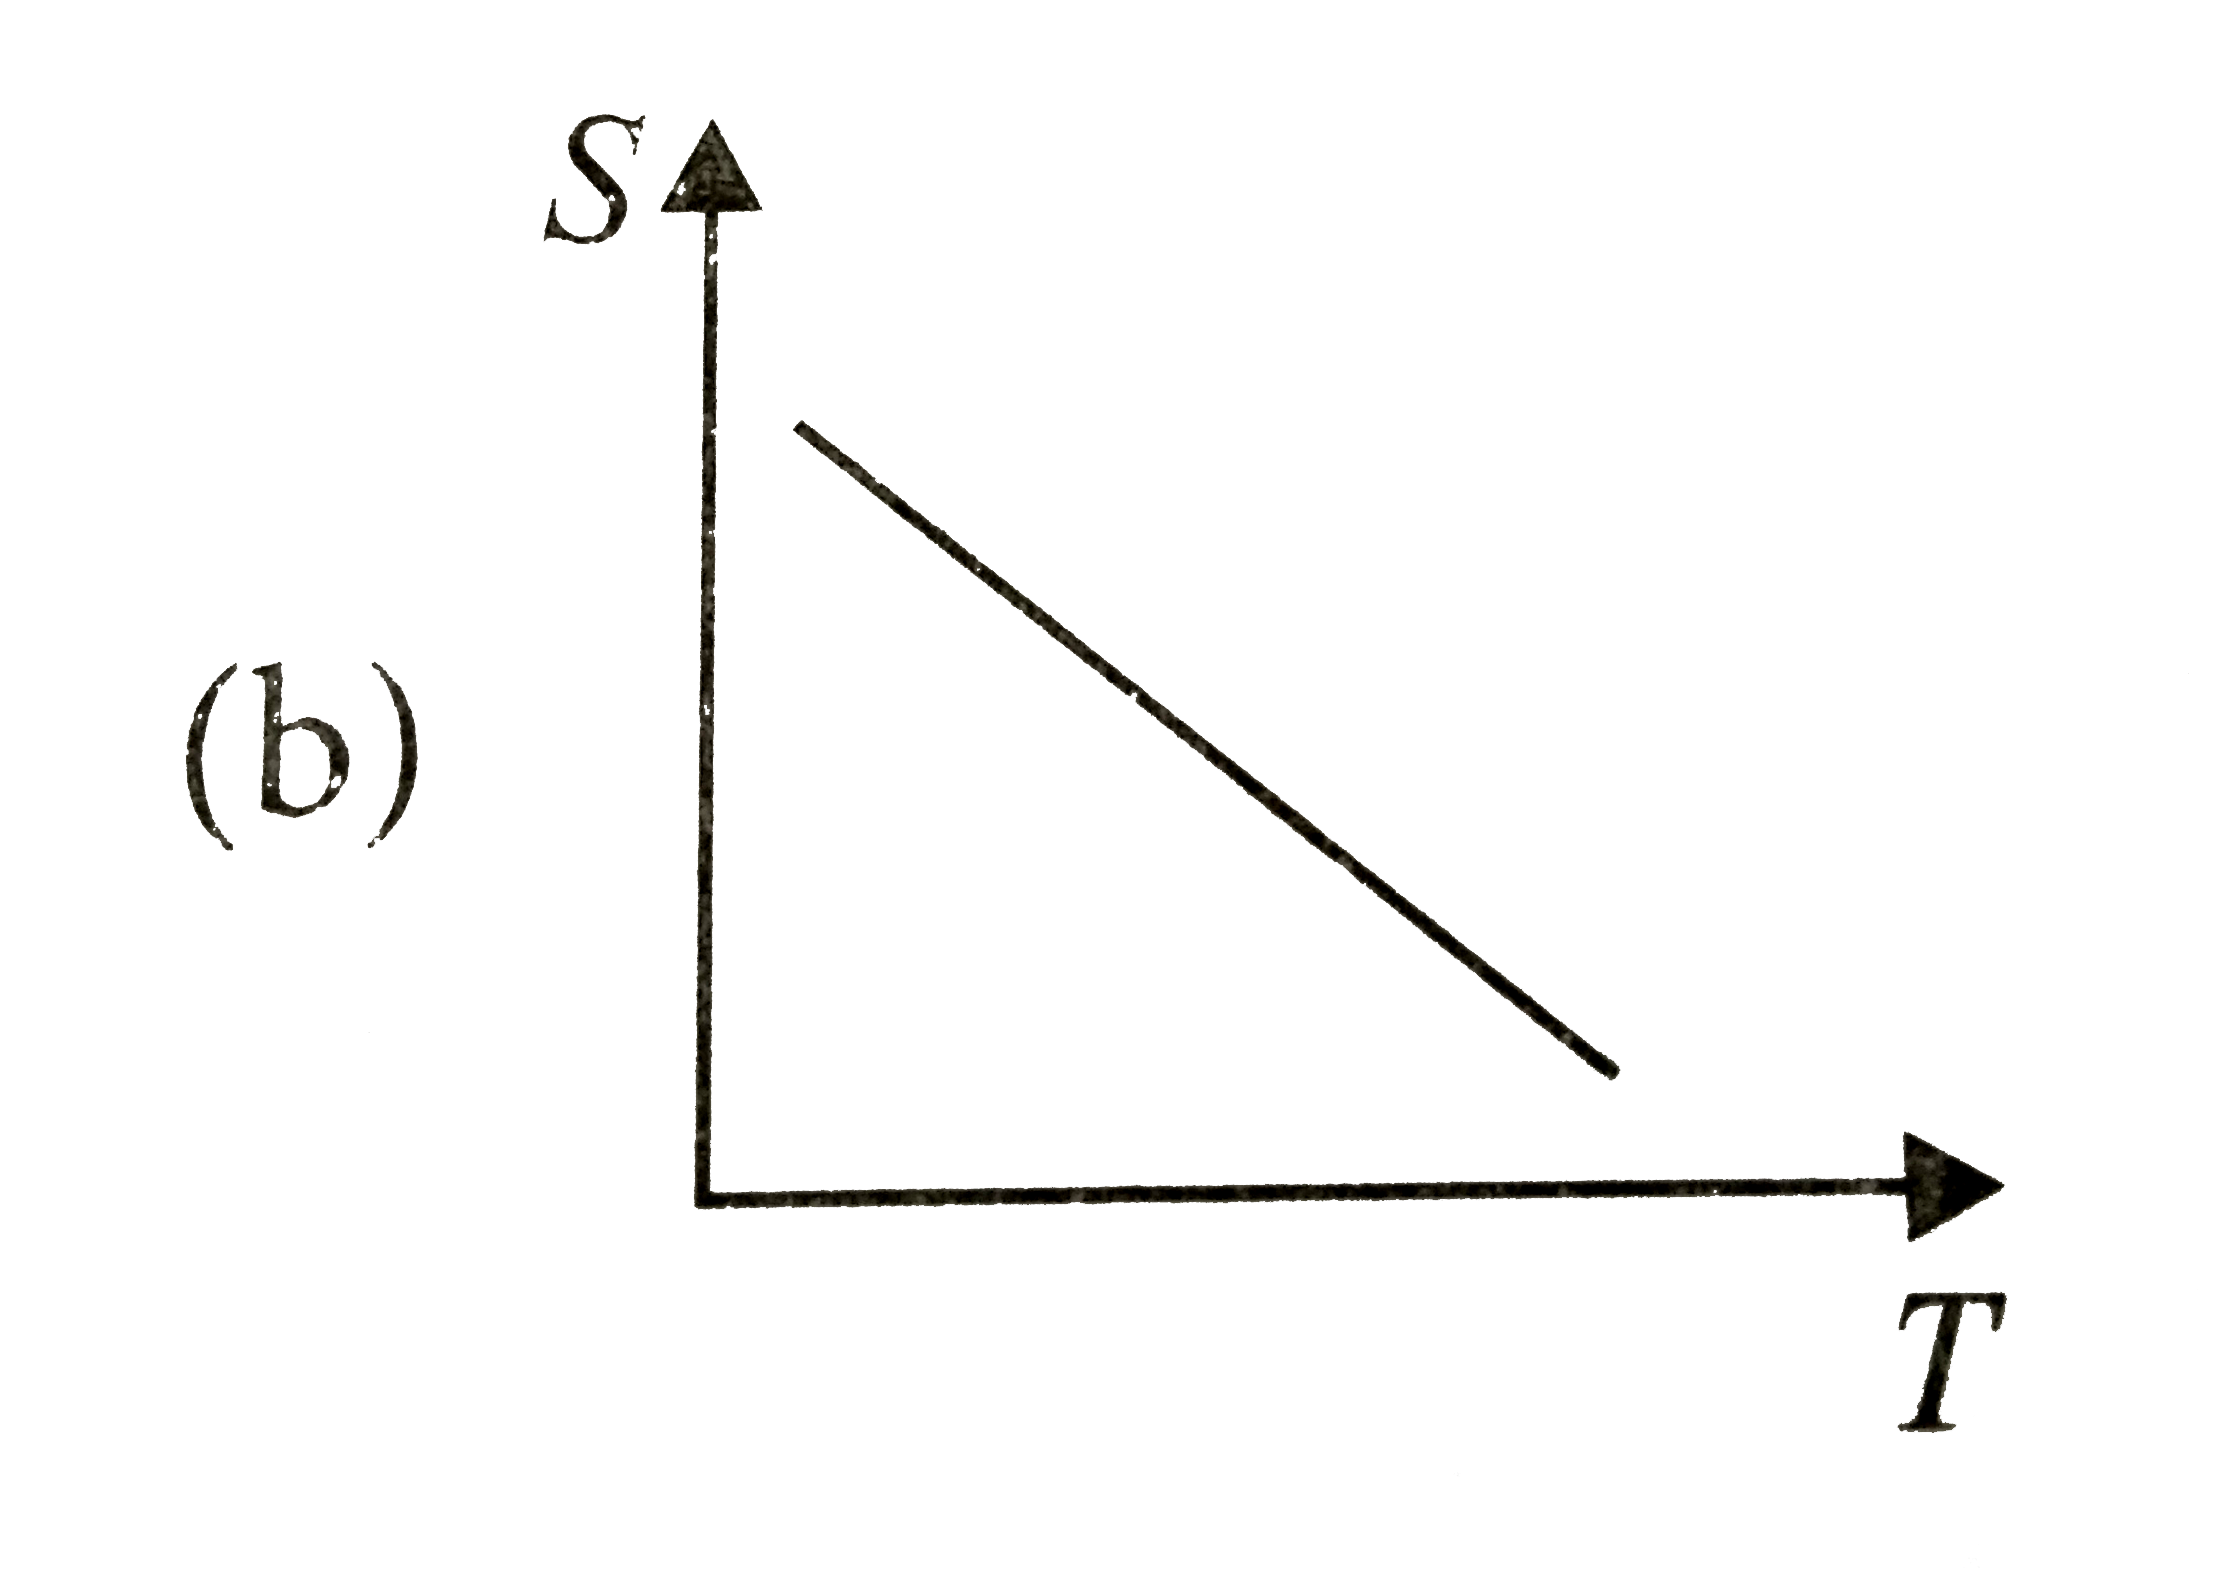 C
C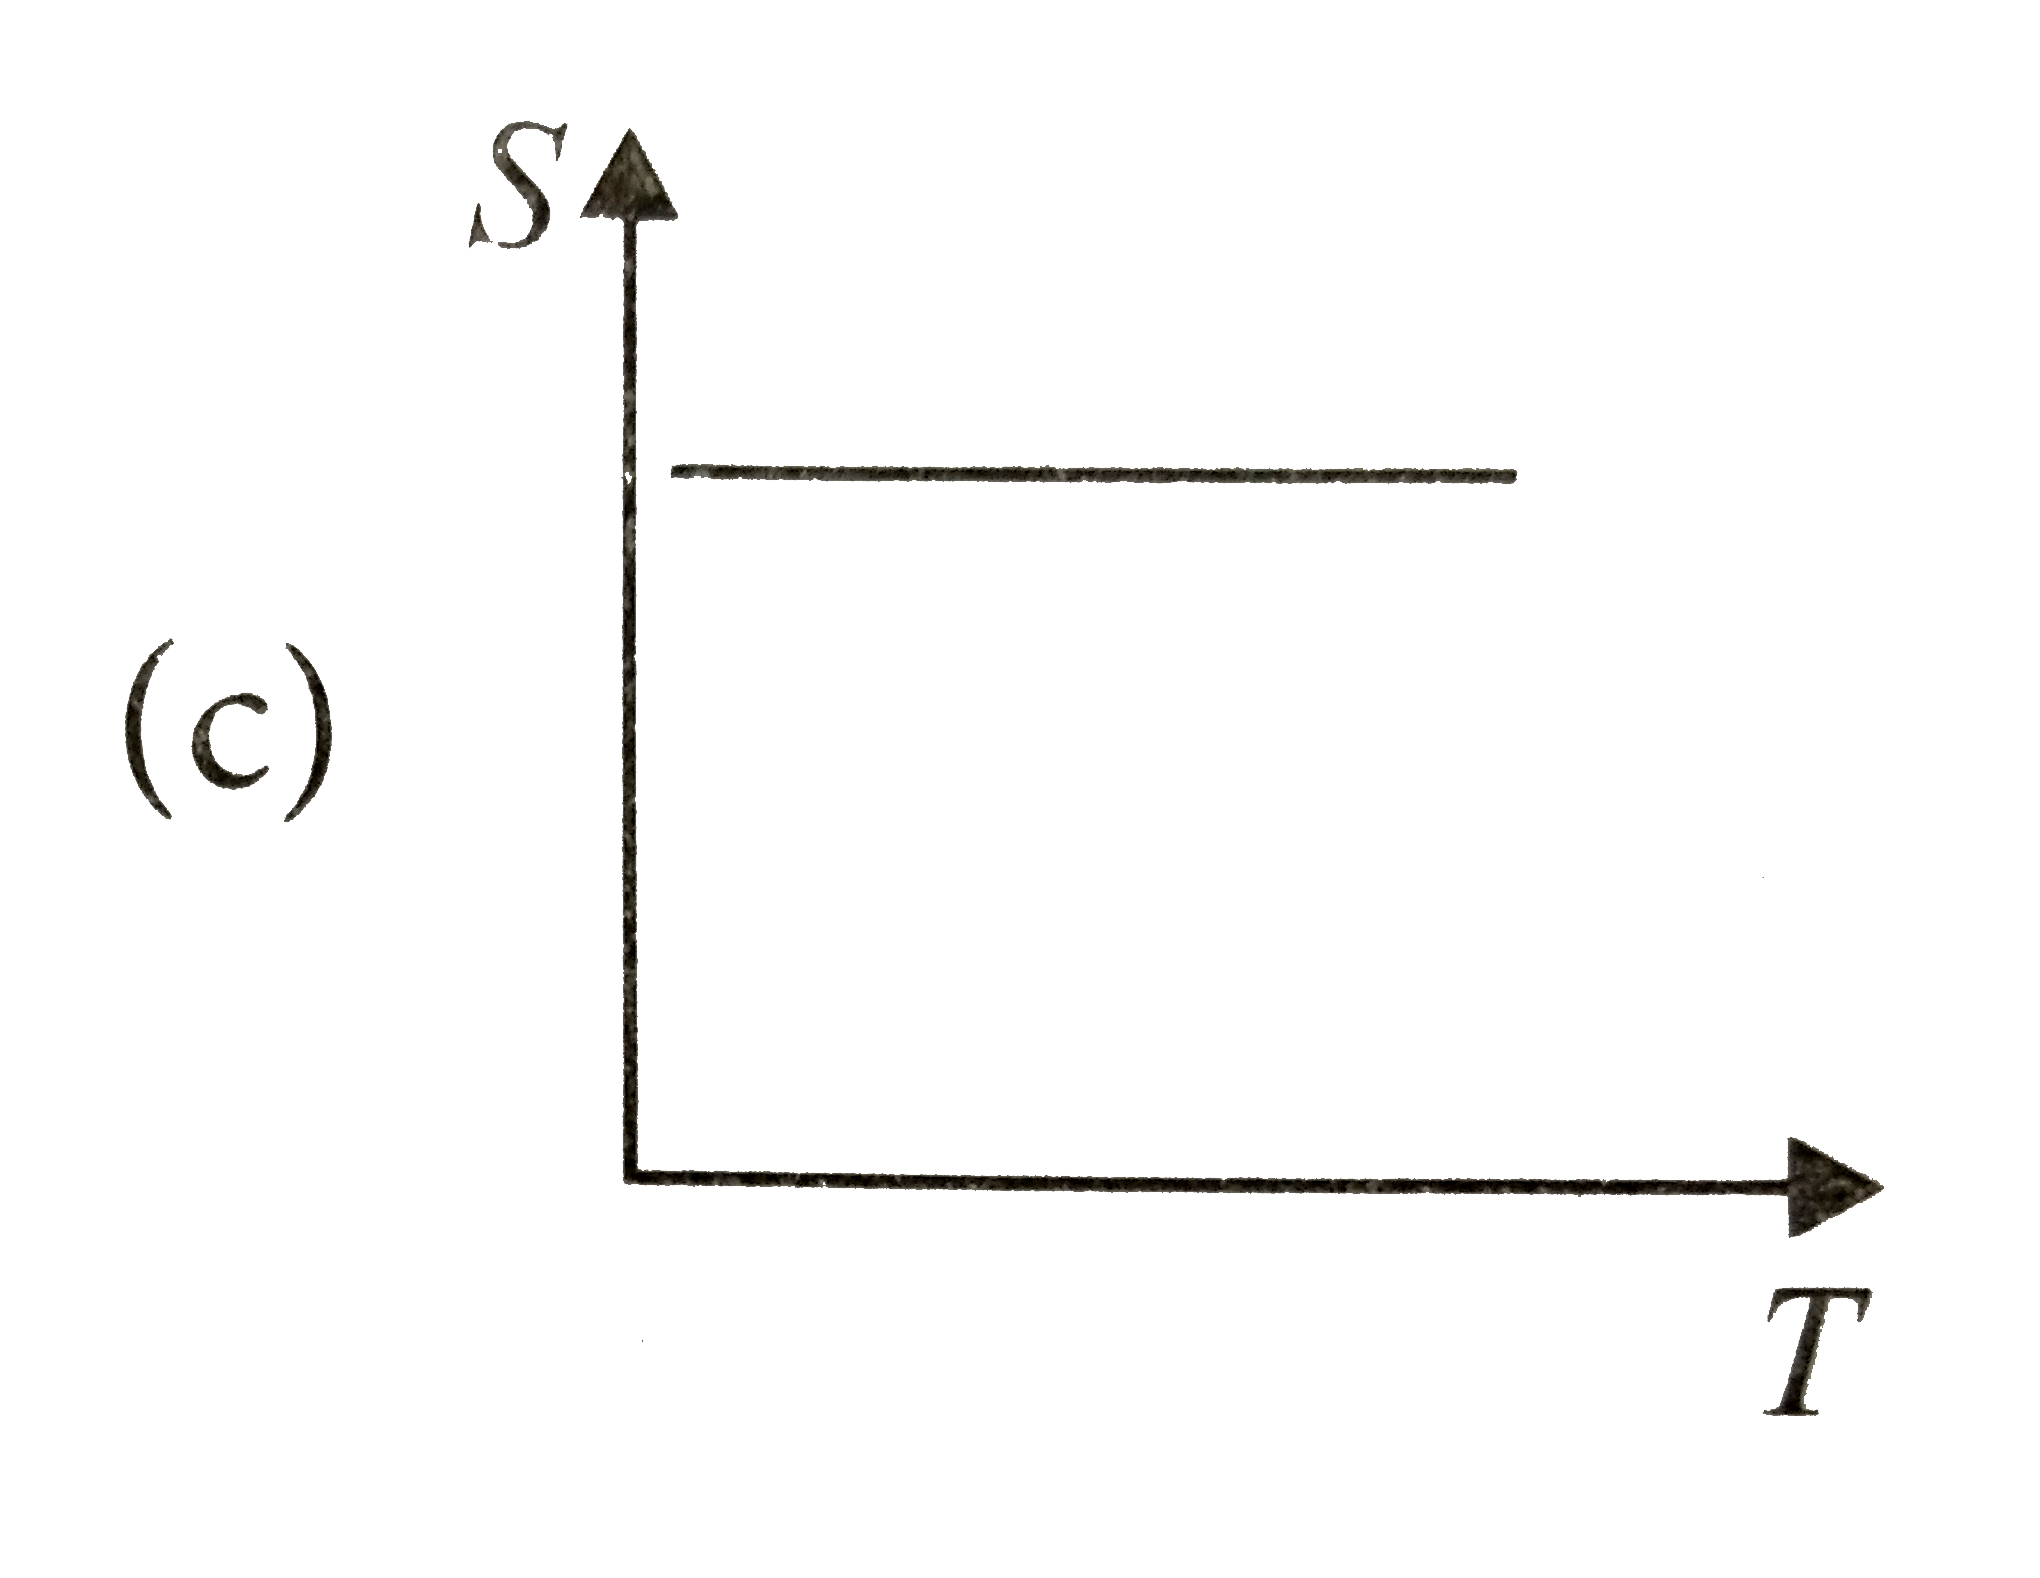 D
D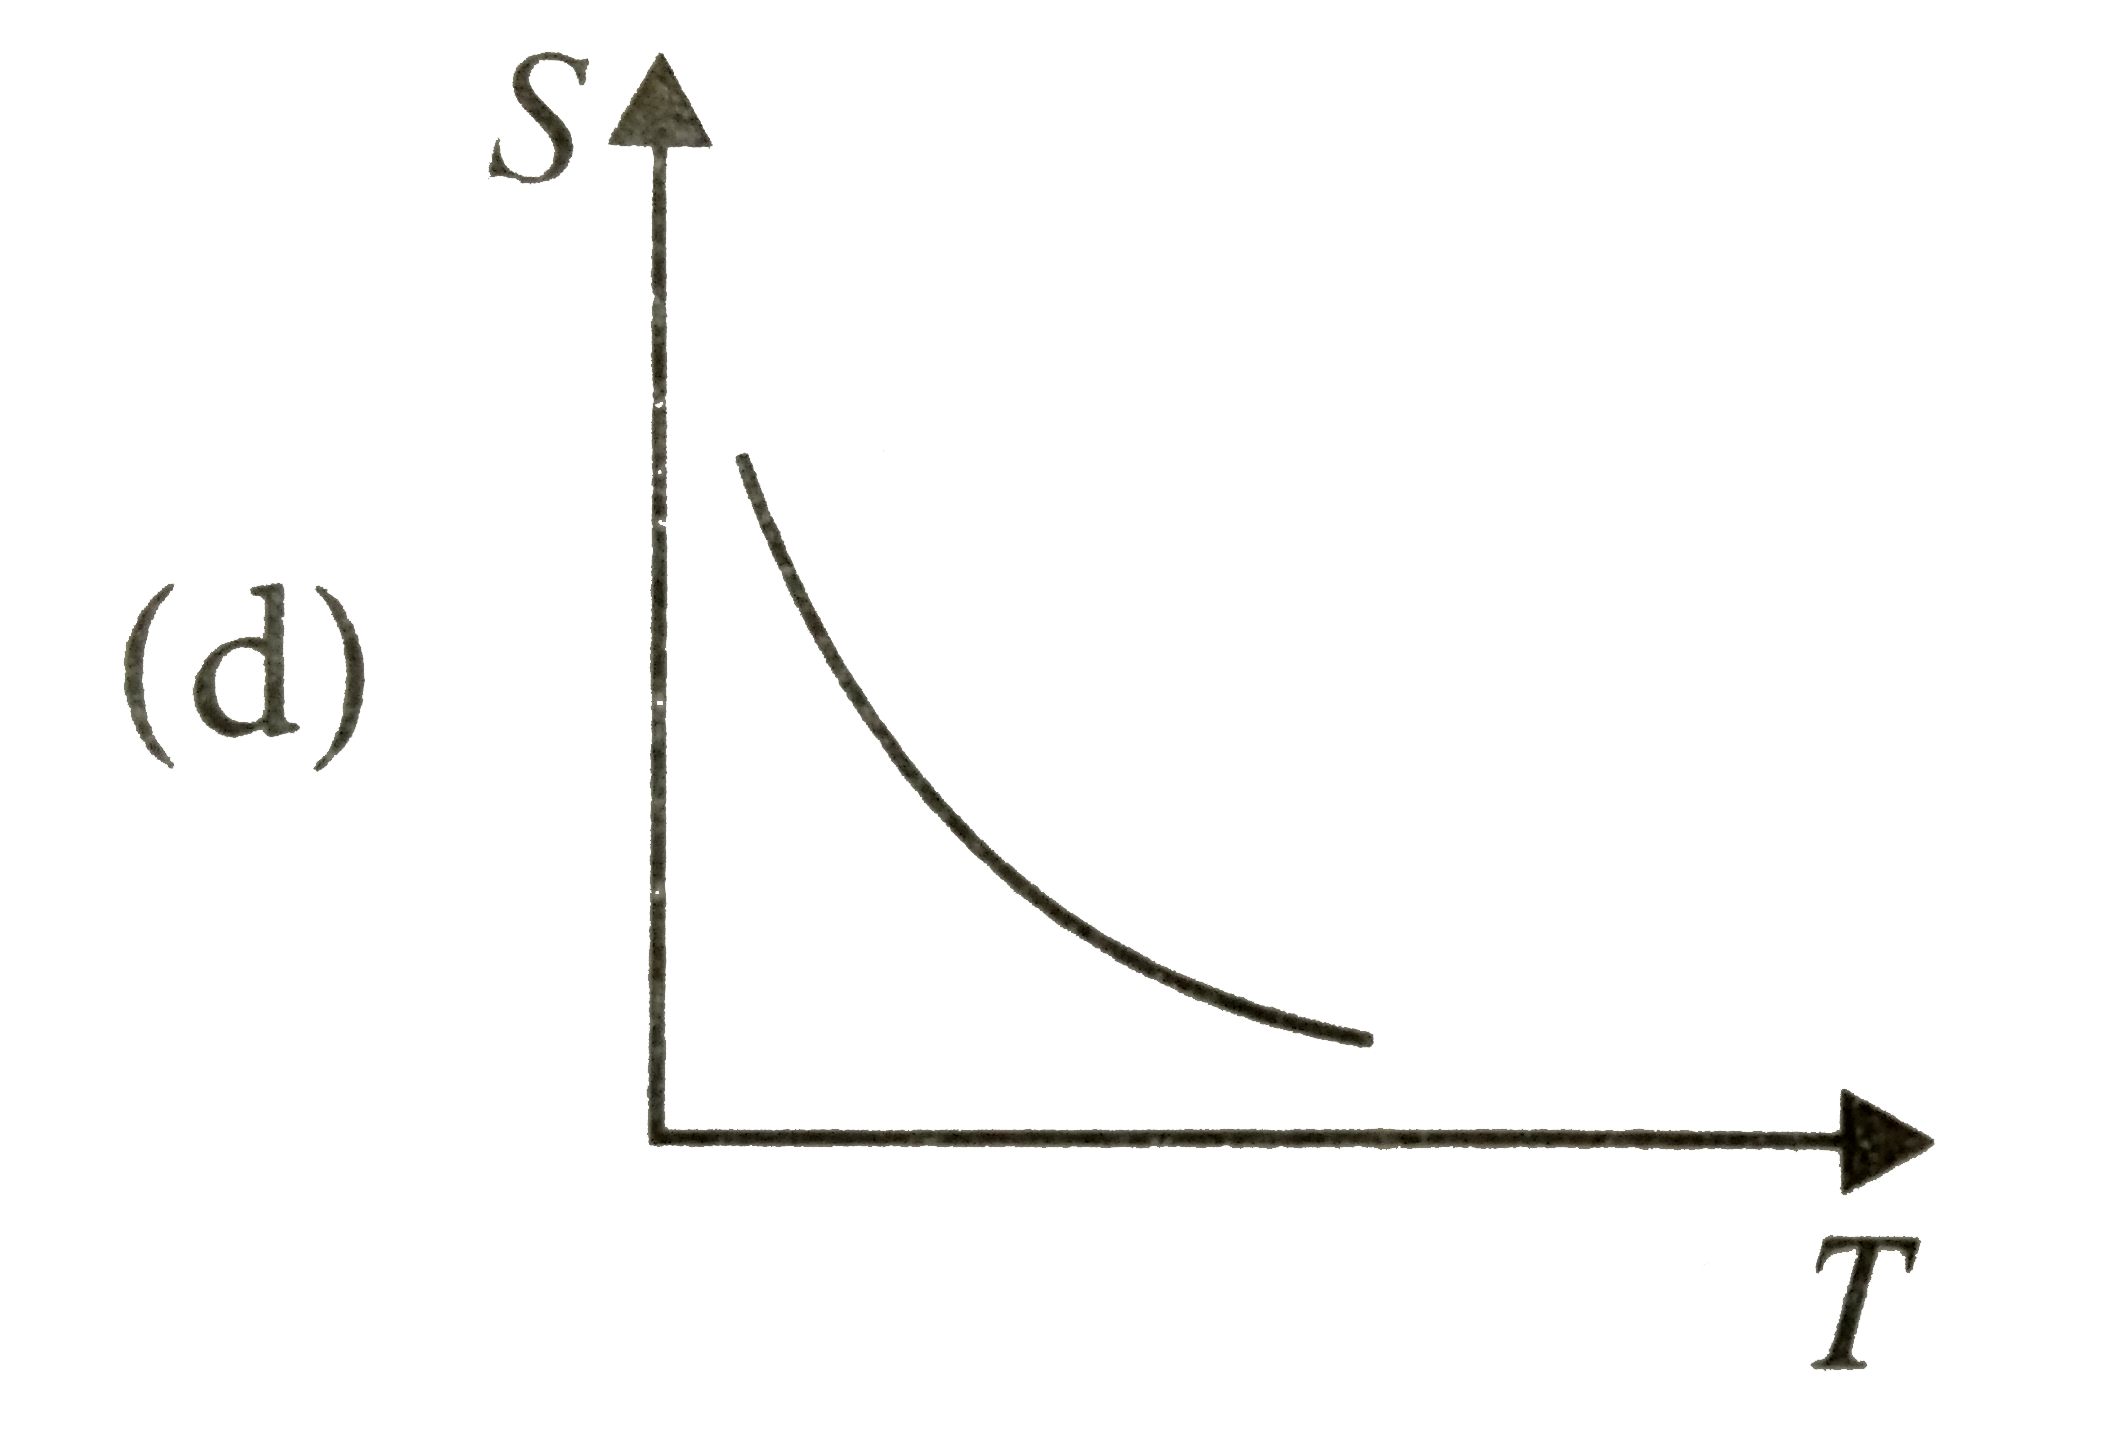
Which one of the following graphs represents the variation of surface tension of water with temperture for a small range of temperature ?
A B
B C
C D
D
Which of the following graph shows the variationi of density of water increase in temperature ?
A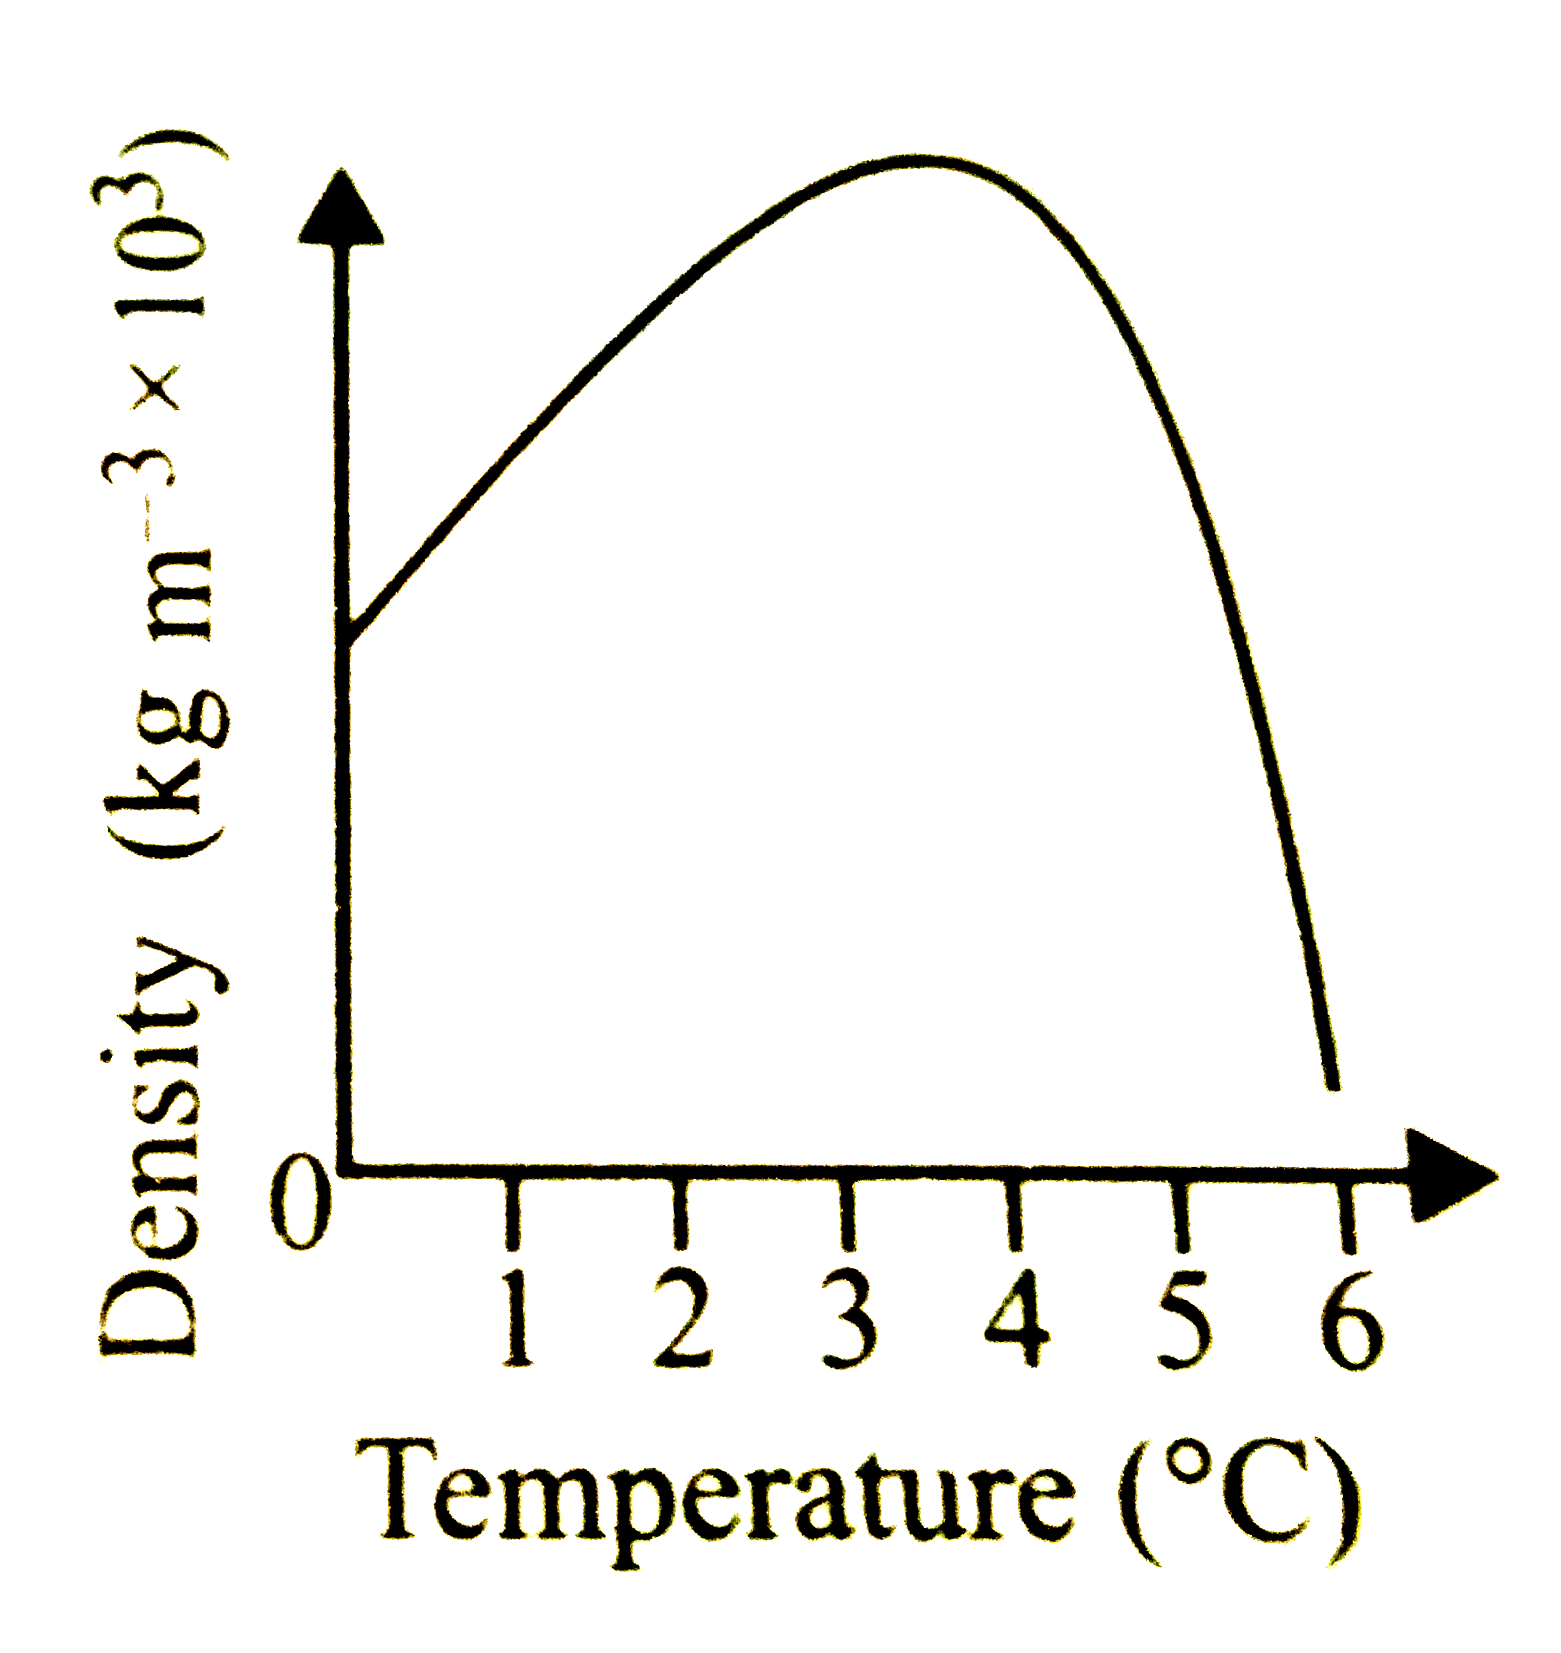 B
B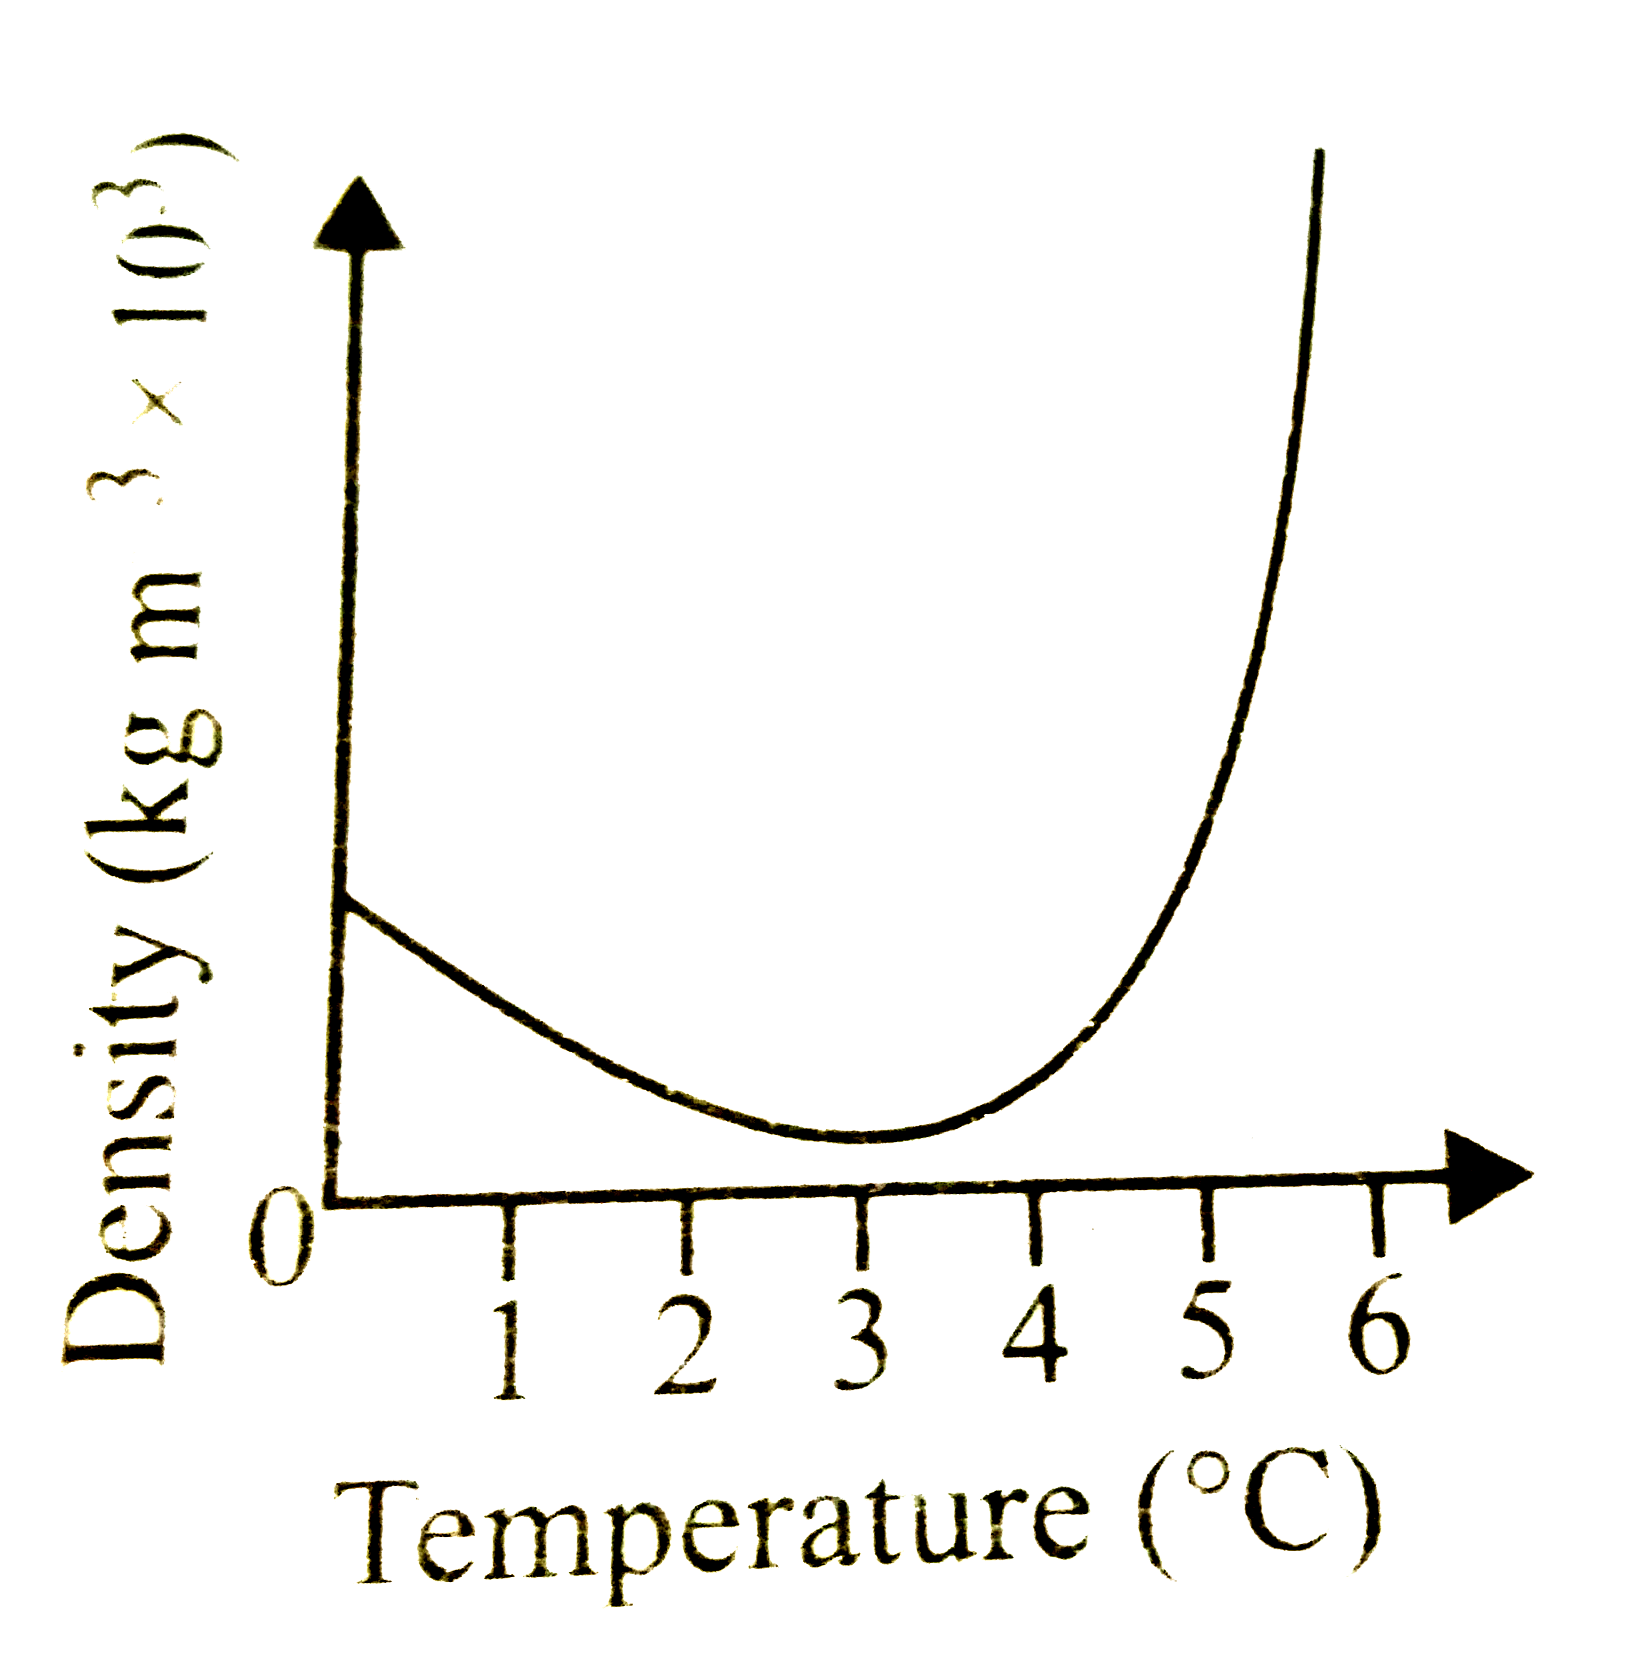 C
C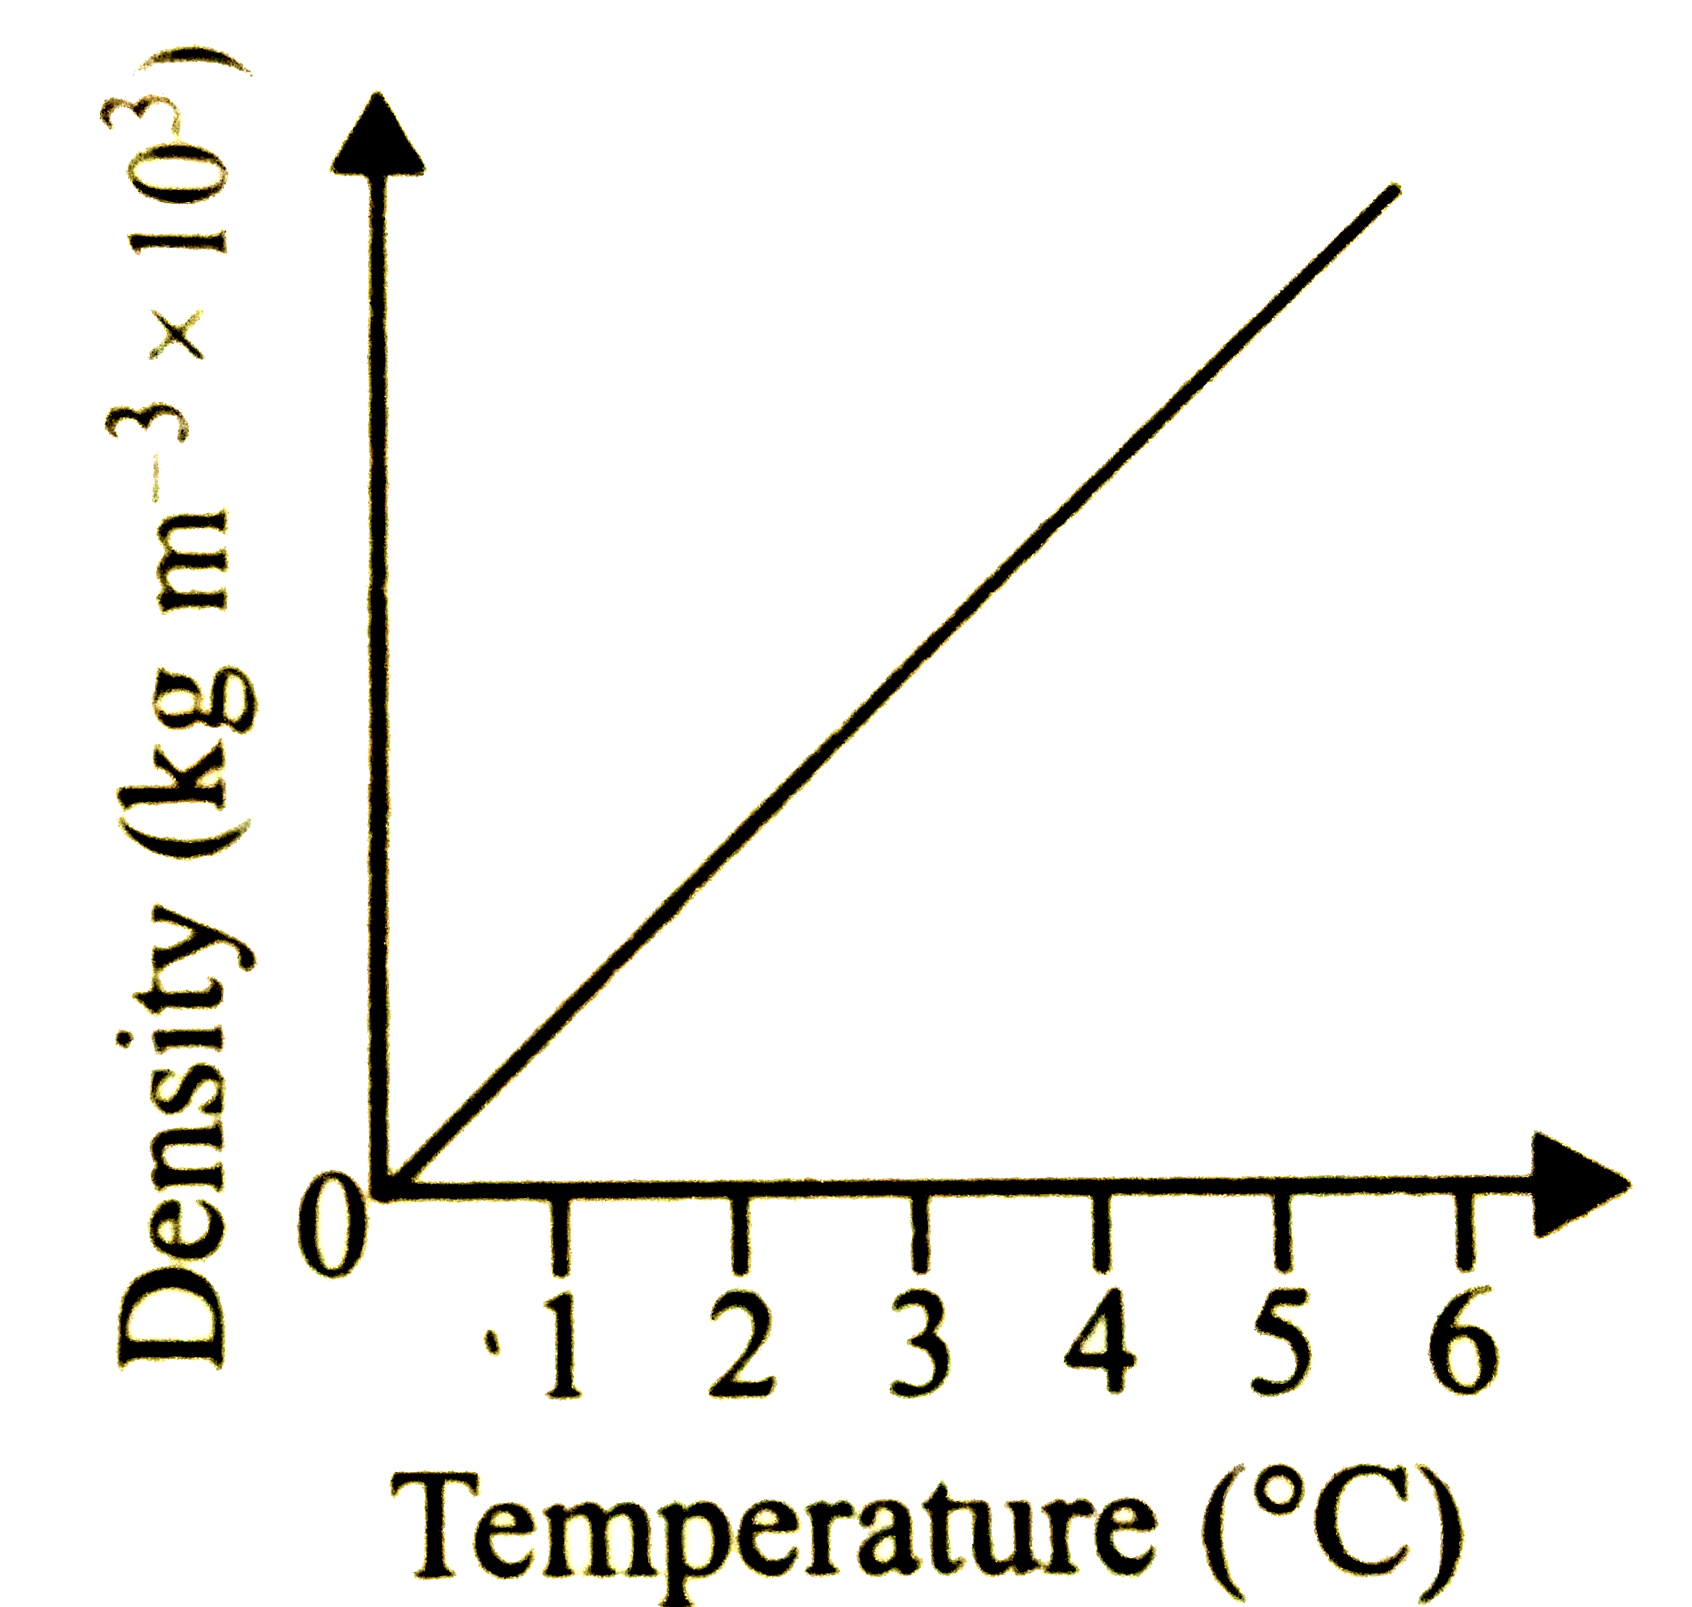 D
D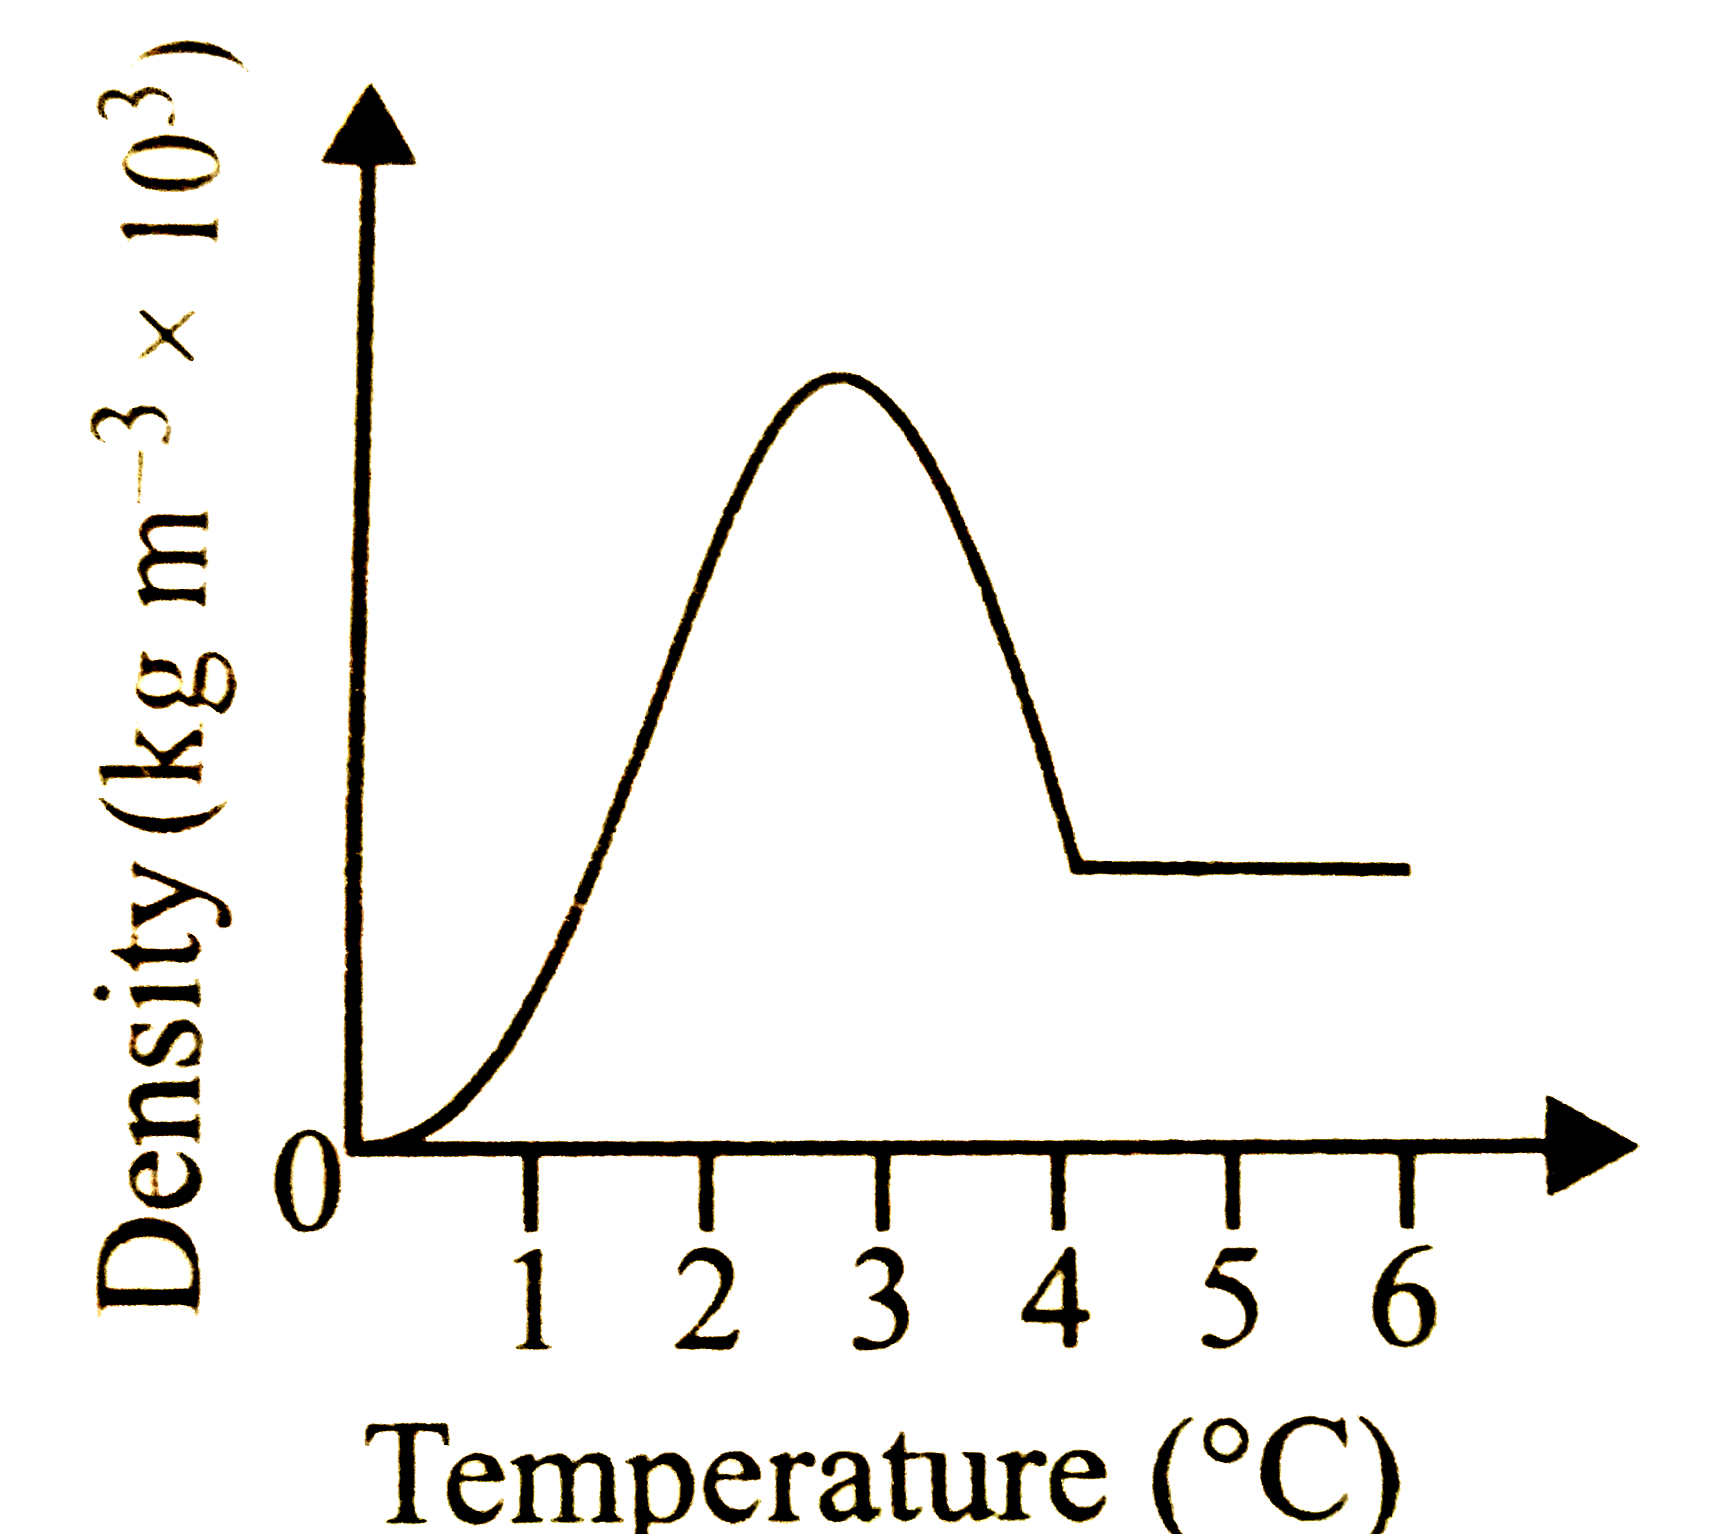
Which of the following graphs shows variation between density of water and temperature?
View SolutionWhich one of the following represents correctly the variations of surface tension with temperature θ ?
View Solutionwhich of the following graph represents the variation of resistivity (ρ) with temperature (T) for copper?
View SolutionWhich of the following liquids has the maximum surface tension at a given temperature ?
View SolutionWhich of the following curve represent variation of density of water with temperature best-
View Solution
