We plot the graph having temperature in ∘C on x - axis and in ∘F on y - axis. If the graph is straight line, then the correct statement is
the line intercepts the positive x - axis
the line intercepts the positive y - axis
the line passes through origin
the line intercepts the negative axis of both x and y - axes
The correct Answer is:B
Topper's Solved these Questions
- BOOK - AAKASH SERIESCHAPTER - THERMAL PROPERTIES OF MATTEREXERCISE - EXERCISE-IB68videos
THERMAL PROPERTIES OF MATTER
- BOOK - AAKASH SERIESCHAPTER - THERMAL PROPERTIES OF MATTEREXERCISE - EXERCISE-2106videos
THERMAL PROPERTIES OF MATTER
- BOOK - AAKASH SERIESCHAPTER - THERMAL PROPERTIES OF MATTEREXERCISE - ADDITIONAL PRACTICE EXERCISE (LEVEL - II) PRACTICE SHEET (ADVANCED) Integer/Subjective Type Questions2videos
THERMAL PROPERTIES OF MATTER
- BOOK - AAKASH SERIESCHAPTER - SYSTEM OF PARTICLES AND ROTATIONAL MOTIONEXERCISE - PRACTICE EXERCISE99videos
SYSTEM OF PARTICLES AND ROTATIONAL MOTION
- BOOK - AAKASH SERIESCHAPTER - THERMODYNAMICSEXERCISE - EXERCISE - 333videos
THERMODYNAMICS
Similar Questions
For a stretched string of given length,the tension 'T' is plotted on the X-axis and the frequency 'f' on the Y- axis.The graph is rectangular hyperbola straight line through the origin
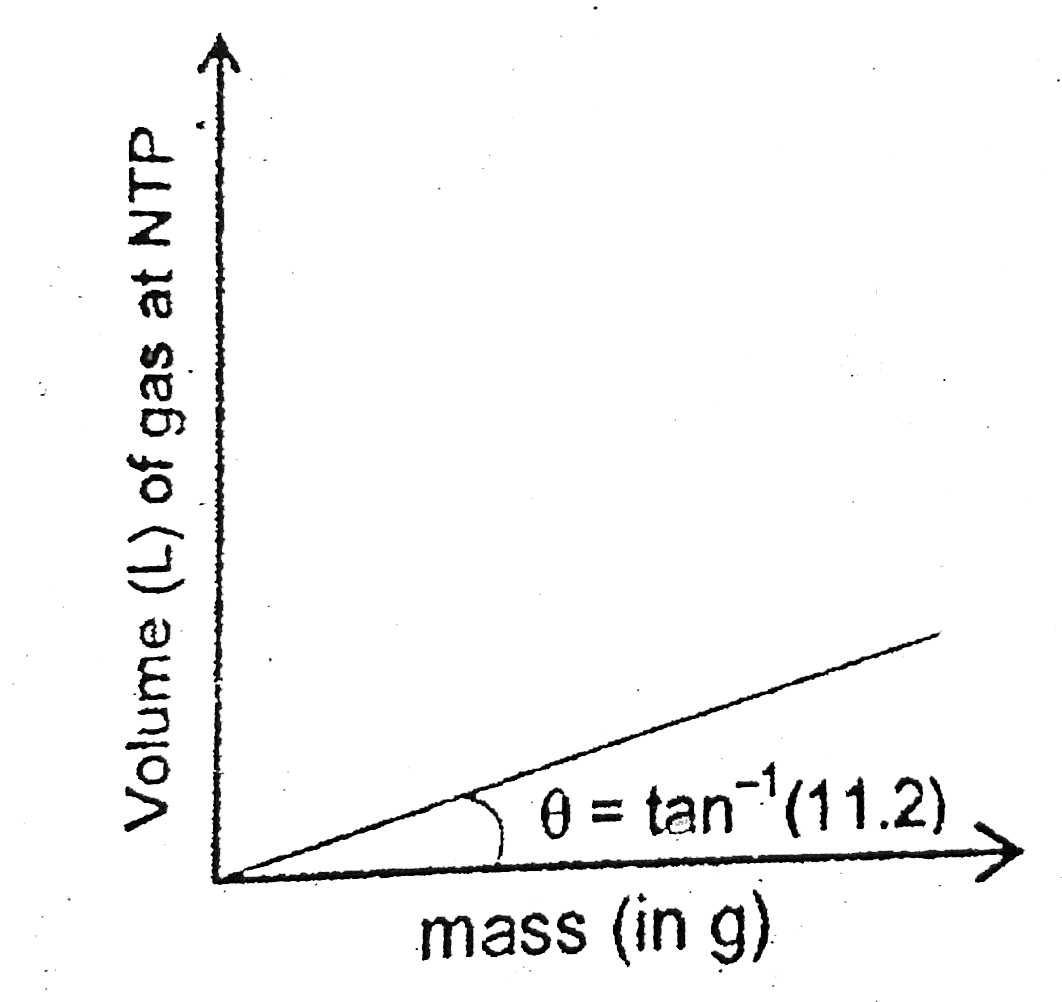
View SolutionA graph is plotted for gas 'C' , by putting its weight (in gm) on X-axis and the Volume (L) of gas at NTP on Y-axis. Select the correct statement :
 View Solution
Knowledge Check
- Question 1 - Select One
A graph is plotted taking .∘C along the Y-axis and .∘F along the X-axis. It is a/an
AparabolaBstraight lineCellipseDcircle - Question 2 - Select One
A graph is plotted taking ∘––C along the Y - axis and of along the X - axis .It is a /an
AparabolaBstraight lineCellipseDcircle - Question 3 - Select One
The pressure at a depth h in a liquid of density ρ is plotted on the Y-axis and the value of h on the X-axis the graph is a strainght line. The slope of the straight line is (g= acceleration due to gravity)
AρgB1ρgCρgDgρ
If the momentum of a particle is plotted on X−axis and its kinetic energy on the Y−axis, the graph is a
View SolutionThe velocity-time graph of a body in motion is a straight line inclined to the time axis. The correct statement is :
View SolutionA graph is plotted for gas 'C' , by putting its weight (in gm) on X-axis and the Volume (L) of gas at NTP on Y-axis. Select the correct statement :
 View Solution
Select the correct graphs
A) the P−1/V graph at constant temperature is a rectangular hyperbola.
B) the PV−V graph is a straight line parallel to the Y− axis.
C) V−T graph at constant pressure is a straight line passing through the origin.View SolutionA graph was plotted taking the temperature in .∘C along the X-axis and the corresponding temperature in Kelvin along the Y-axis. Which of the curves in Fig, 6.1 most correctly represents this behaviour?
View Solution

