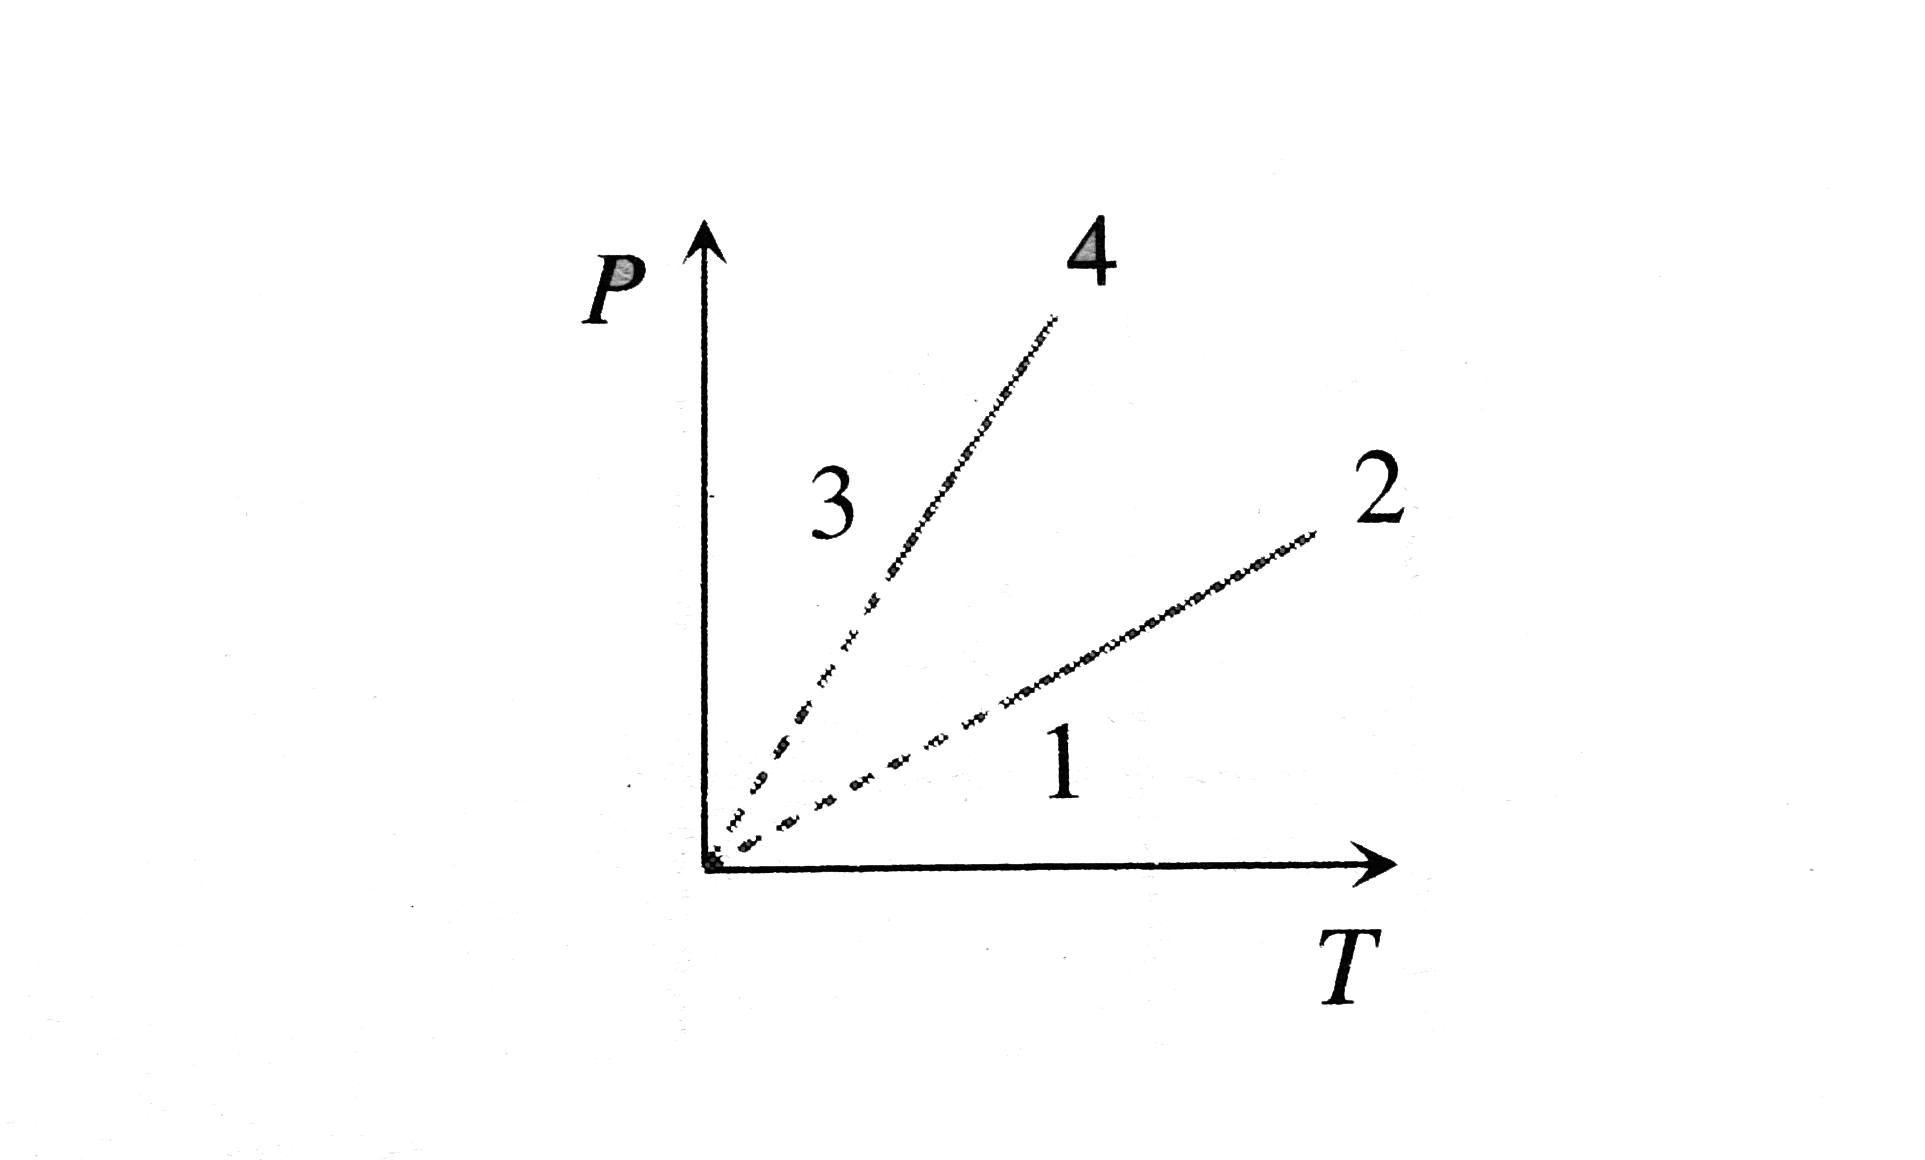
A plot of pressure versus temperature and extrapolation of lines for low density gases


none
The correct Answer is:B
Topper's Solved these Questions
- THERMAL PROPERTIES OF MATTERBOOK - AAKASH SERIESCHAPTER - THERMAL PROPERTIES OF MATTEREXERCISE - EXERCISE-IB
68 Videos
- THERMAL PROPERTIES OF MATTERBOOK - AAKASH SERIESCHAPTER - THERMAL PROPERTIES OF MATTEREXERCISE - EXERCISE-2
106 Videos
- THERMAL PROPERTIES OF MATTERBOOK - AAKASH SERIESCHAPTER - THERMAL PROPERTIES OF MATTEREXERCISE - ADDITIONAL PRACTICE EXERCISE (LEVEL - II) PRACTICE SHEET (ADVANCED) Integer/Subjective Type Questions
2 Videos
- SYSTEM OF PARTICLES AND ROTATIONAL MOTIONBOOK - AAKASH SERIESCHAPTER - SYSTEM OF PARTICLES AND ROTATIONAL MOTIONEXERCISE - PRACTICE EXERCISE
99 Videos
- THERMODYNAMICSBOOK - AAKASH SERIESCHAPTER - THERMODYNAMICSEXERCISE - EXERCISE - 3
33 Videos
Similar Questions
Knowledge Check
The plot of ΔG versus temperature for the formation of oxides of elements is called
AEllingham diagramBFree energy curveCEntropy curveDIsobarIn an experiment to verify the value of absolute zero, a student is instructed to measure the volume of He in a 10mL syrings at 10∘C. She is told to plot the volume versus temperature and to extrapolate this graph to zero volume and read the resulting temperature. Which modification of the experimental procedure will give the best value for absolute zero?
ACorrecting each measured volume to one atmosphere pressure before plotting.BDoubling the number of temperature-volume value between 0∘C and 100∘C.Cusing a thermometer that can measure temperature to ±O∘C between O∘C and 100∘C.DMeasuring the volume of He in the syringe at −40∘C and 80∘C.Pressure versus temperature graph of an ideal gas is shown in figure. Density of the gas at point A is P0. Density at B will be
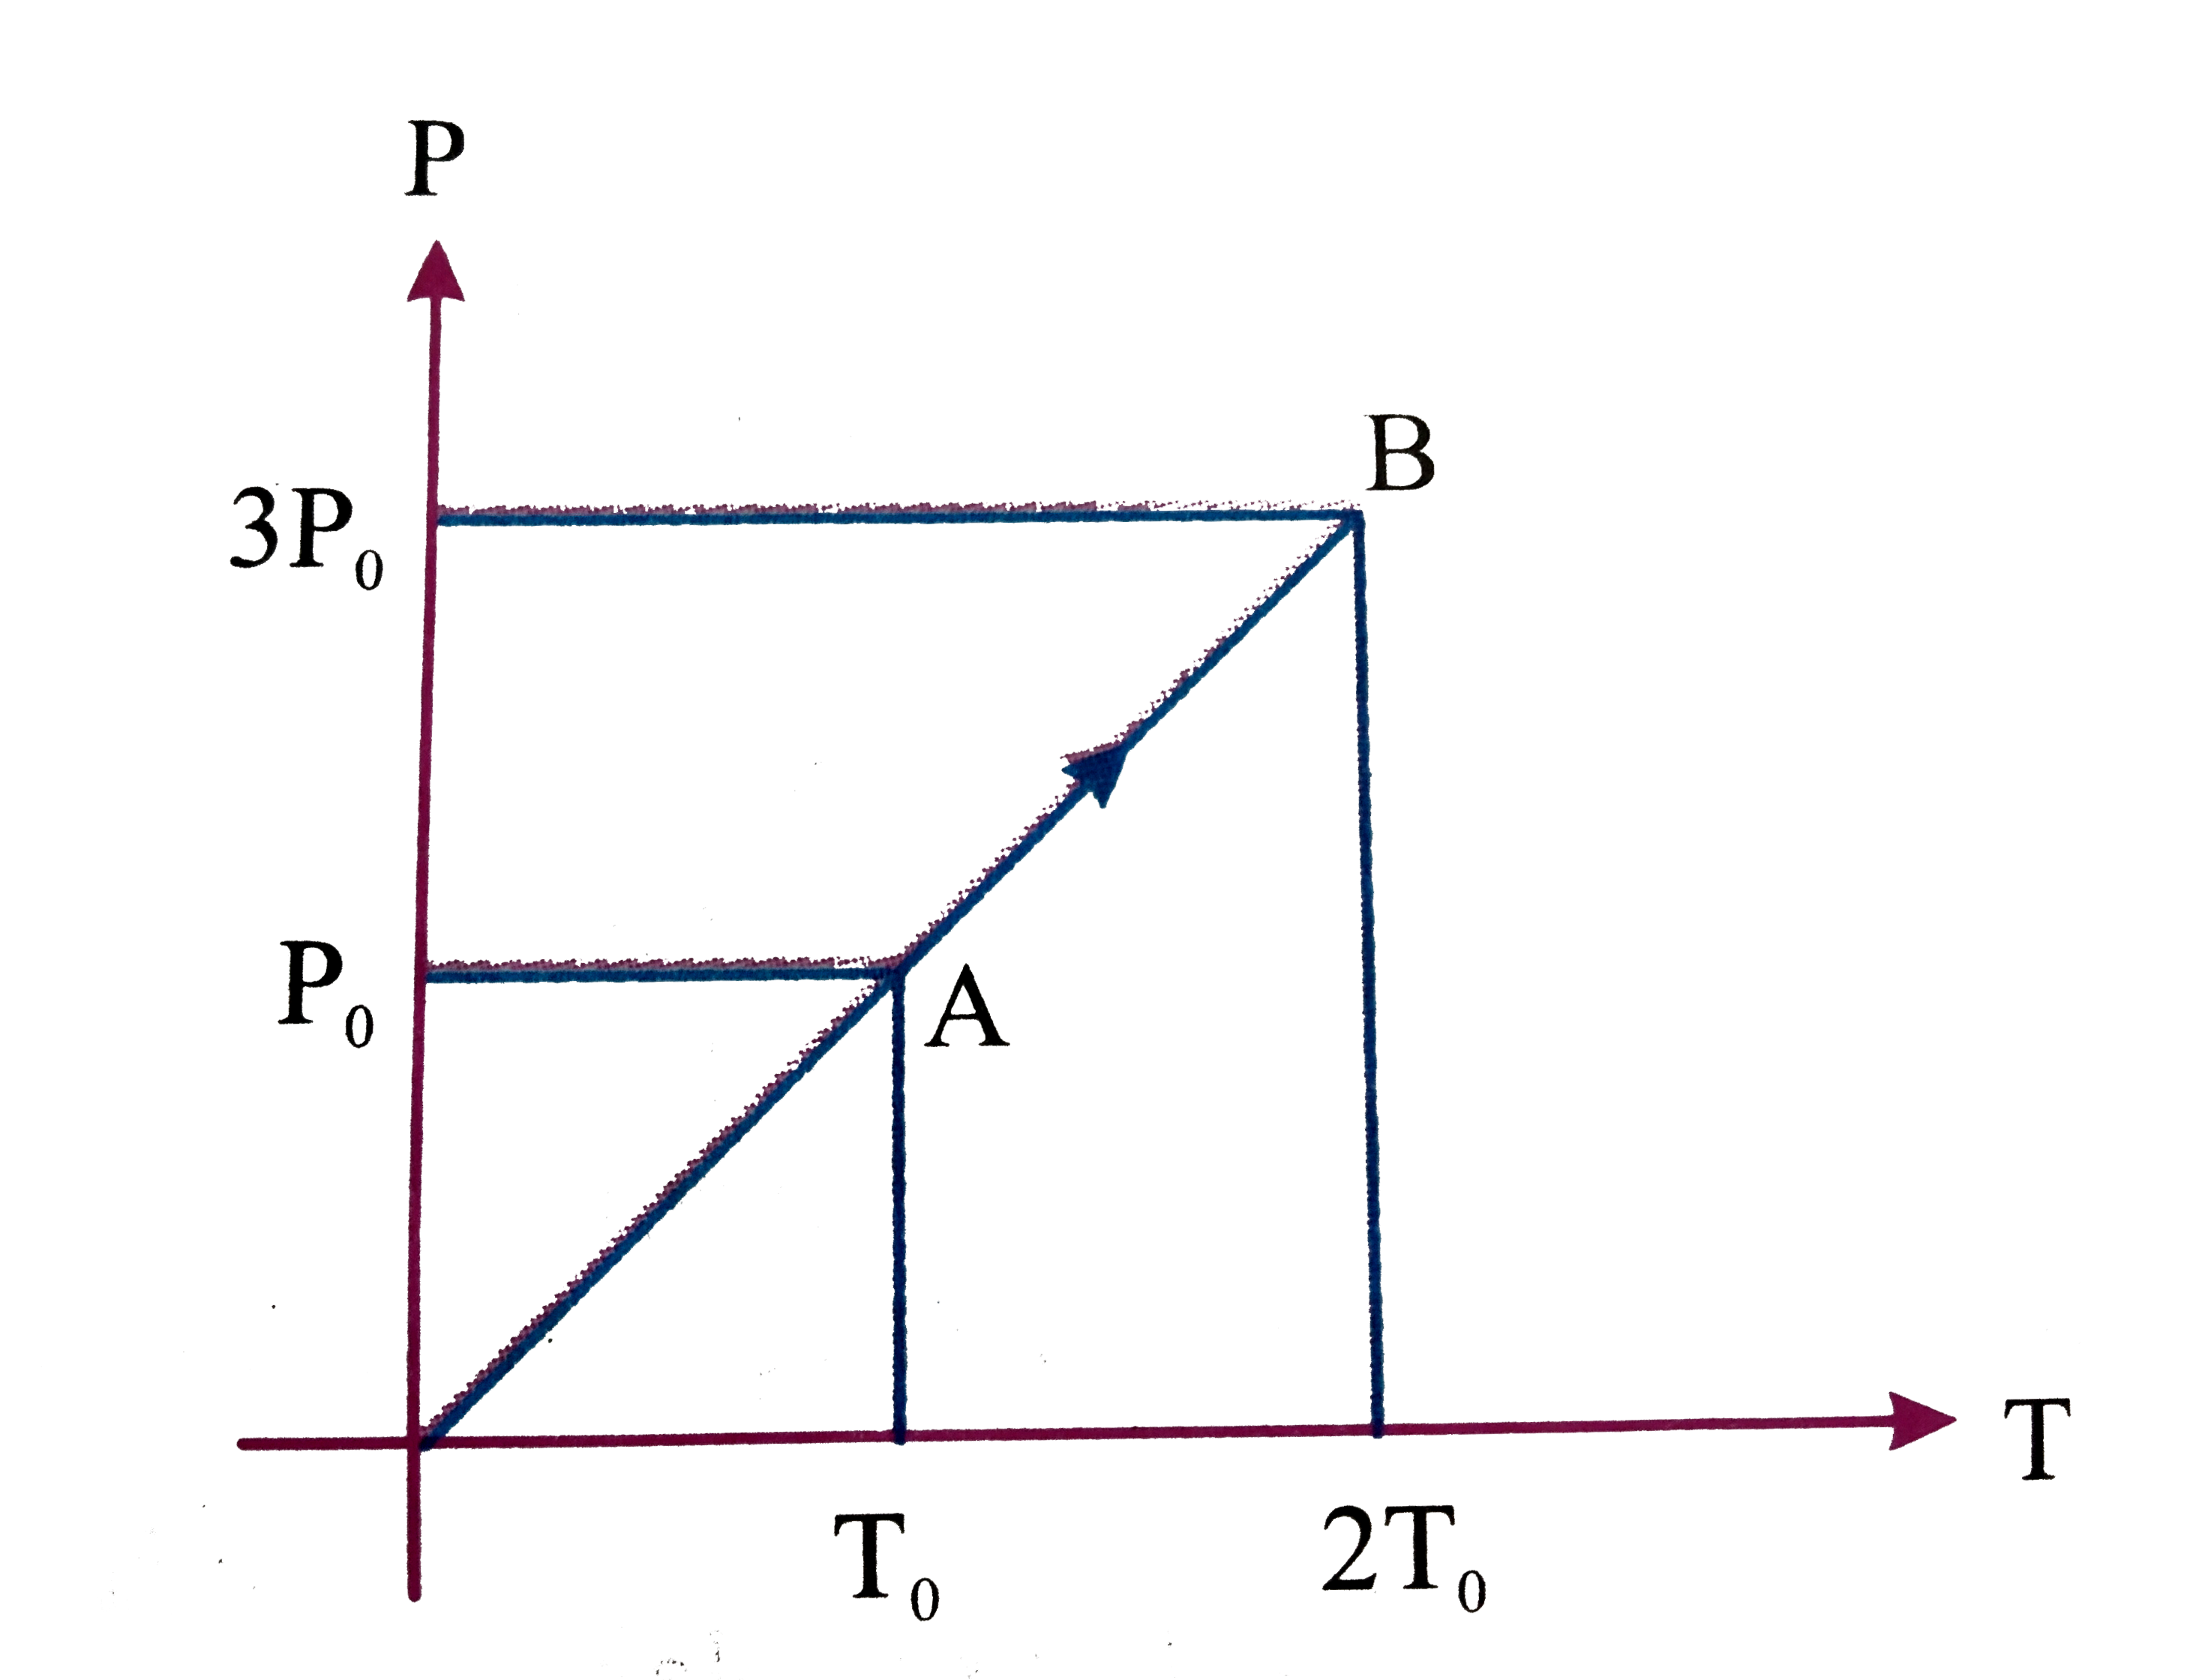 A34ρ0B32ρ0C43ρ0D2ρ0
In figure shown,Pressure versus temperature graph of an ideal gas is as . Density of the gas at point A is ρ0 . Density at point B will be ____
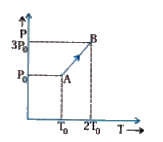
View SolutionPressure versus temperature graph of an ideal gas is as shown in figure. Density of the gas at point A is ρ0. Density at point B will be :-
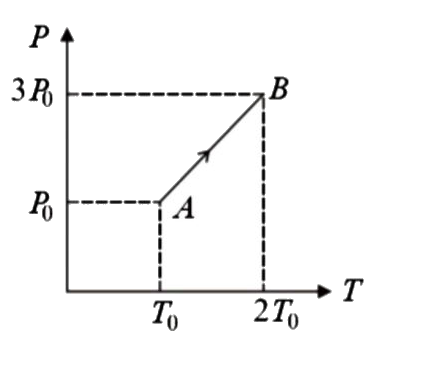
View SolutionPressure versus temperature graph of an ideal gas is shown in figure. Density of the gas at point A is ρ0. Density at B will be

View SolutionPressure versus temperature graph of an ideal gas of equal number of moles of different volumes is plotted as shown in figure. Choose the correct alternatives.
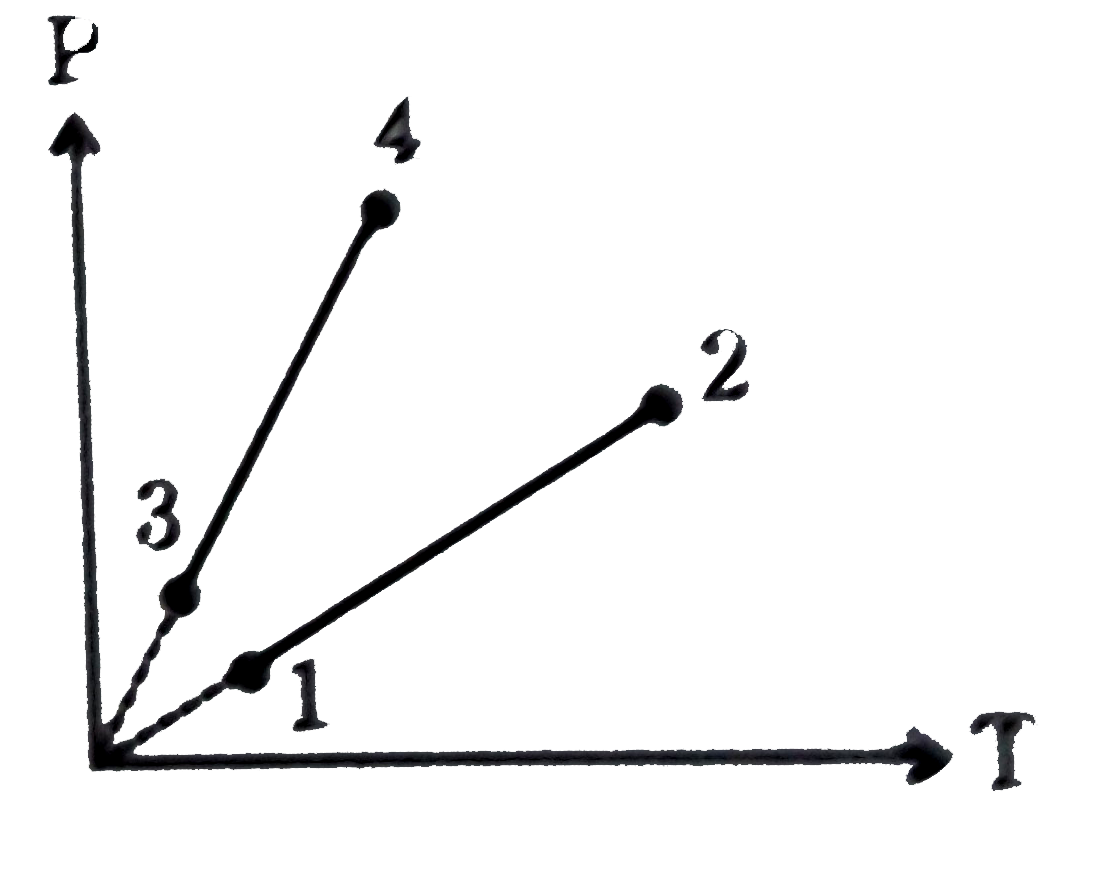
View SolutionPressure versus temperature graph of an ideal gas of equal number of moles of different volumes is plotted as shown in Fig. Choose the correct alternative.
View Solution
