If the rate of emission of radiation by a body at temperature T Kelvin is E then the graph between log E and log T will be


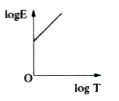
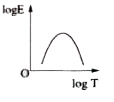
The correct Answer is:C
Topper's Solved these Questions
- TRANSMISSION OF HEATBOOK - AAKASH SERIESCHAPTER - TRANSMISSION OF HEATEXERCISE - ADDITIONAL PRACTICE EXERCISE (PRACTICE SHEET (ADVANCED)) (More than One correct answer Type Questions)
12 Videos
- TRANSMISSION OF HEATBOOK - AAKASH SERIESCHAPTER - TRANSMISSION OF HEATEXERCISE - ADDITIONAL PRACTICE EXERCISE (PRACTICE SHEET (ADVANCED)) (Linked Comprehension Type Questions) Passage-I
3 Videos
- TRANSMISSION OF HEATBOOK - AAKASH SERIESCHAPTER - TRANSMISSION OF HEATEXERCISE - ADDITIONAL PRACTICE EXERCISE (LEVEL-II (LECTURE SHEET (ADVANCED)) Matrix Matching Type Questions
5 Videos
- TRANSMISSION OF HEAT BOOK - AAKASH SERIESCHAPTER - TRANSMISSION OF HEAT EXERCISE - QUESTION FOR DESCRIPTIVE ANSWER
4 Videos
- UNITS AND MEASUREMENTBOOK - AAKASH SERIESCHAPTER - UNITS AND MEASUREMENTEXERCISE - Practice Exercise
45 Videos
Similar Questions
Knowledge Check
If the rate of emission of radiation by a body at temperature TK is E then graph between log E and log T will be .
A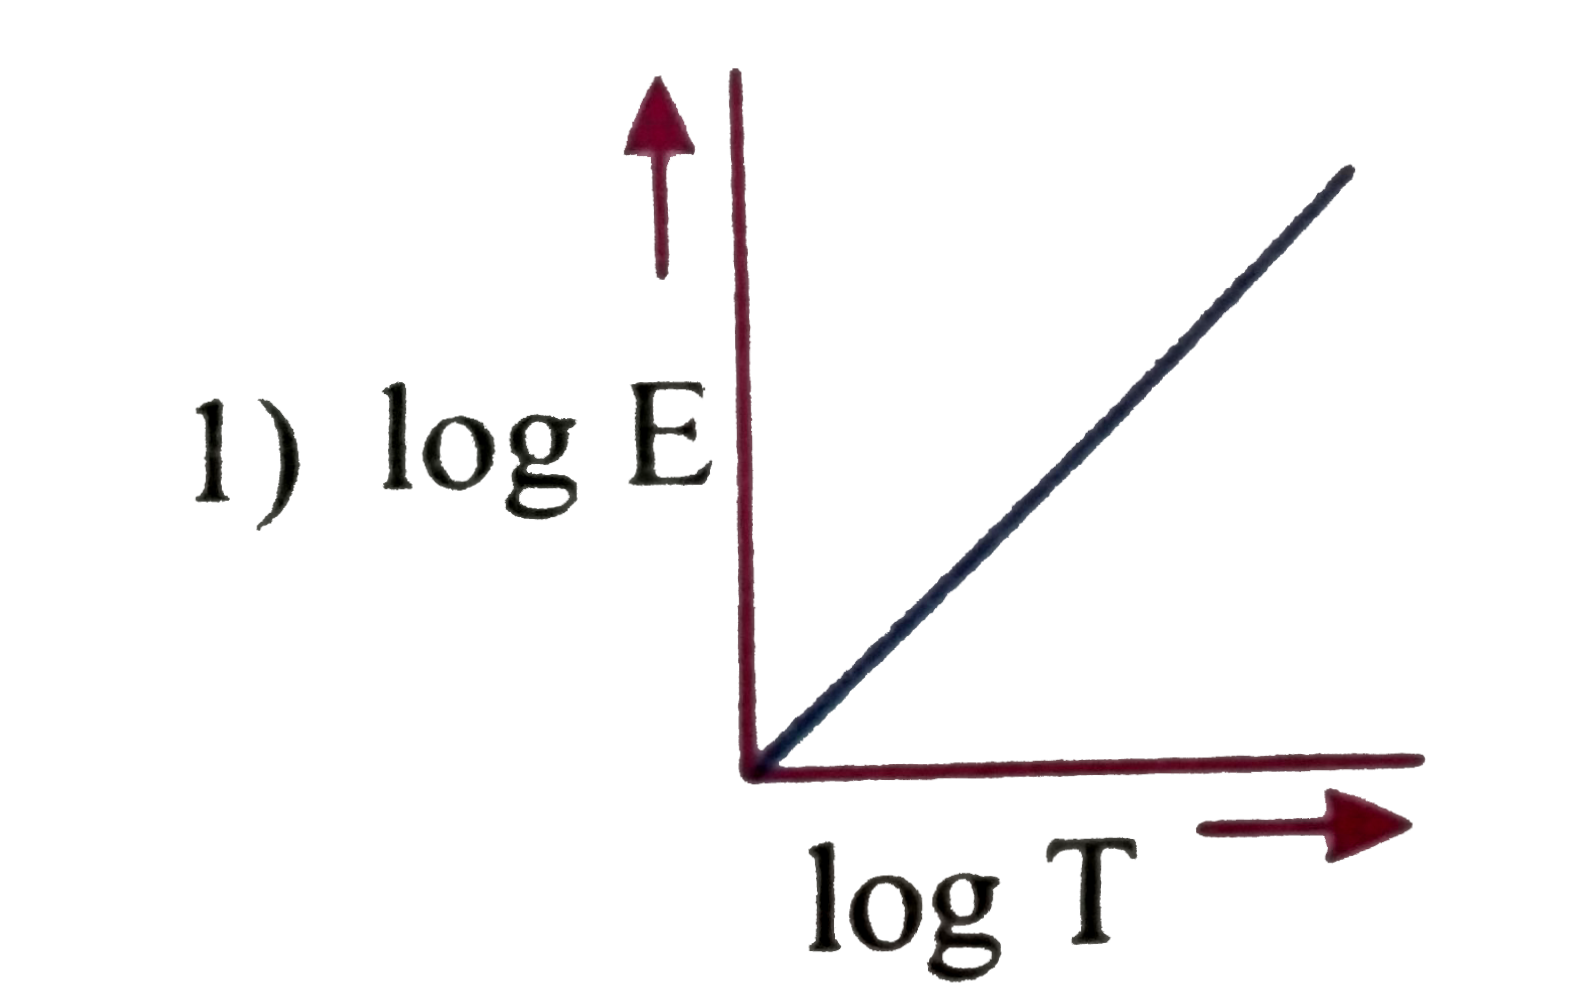 B
B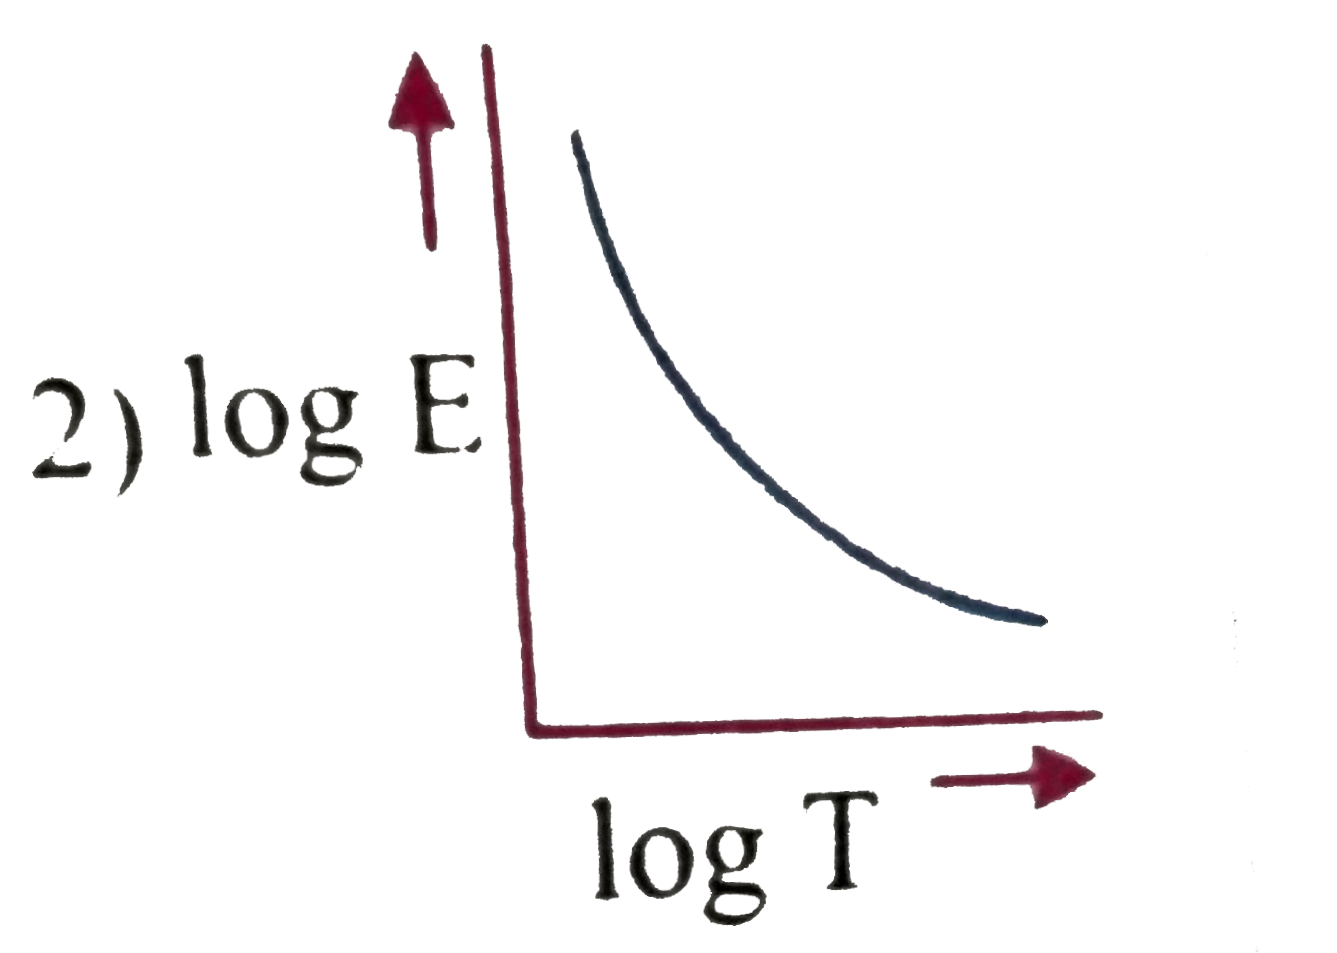 C
C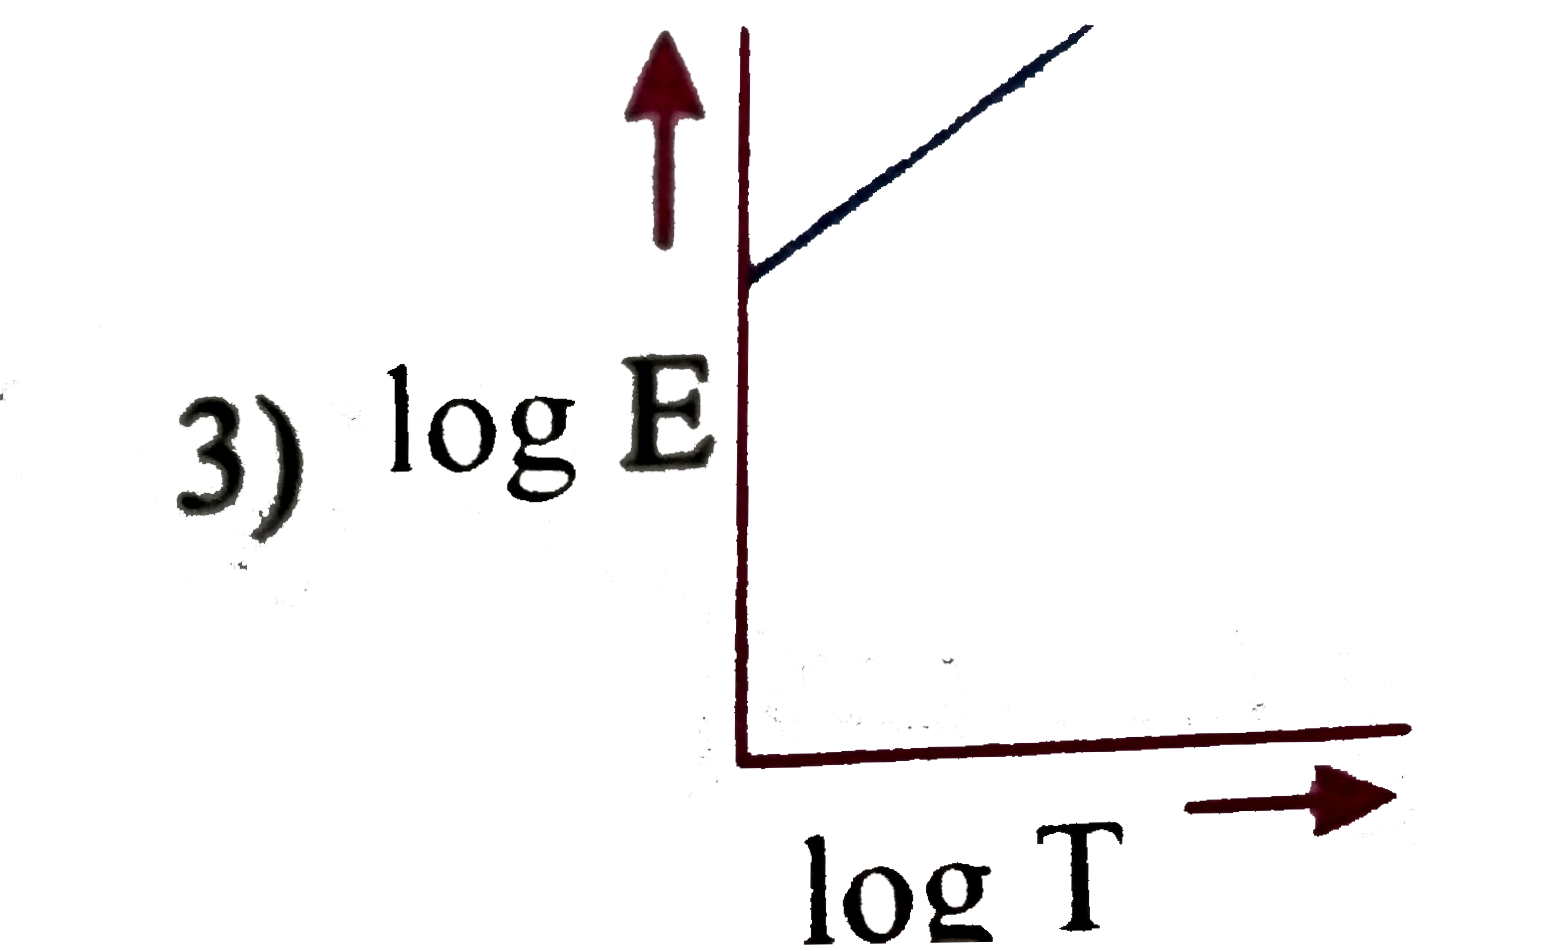 D
D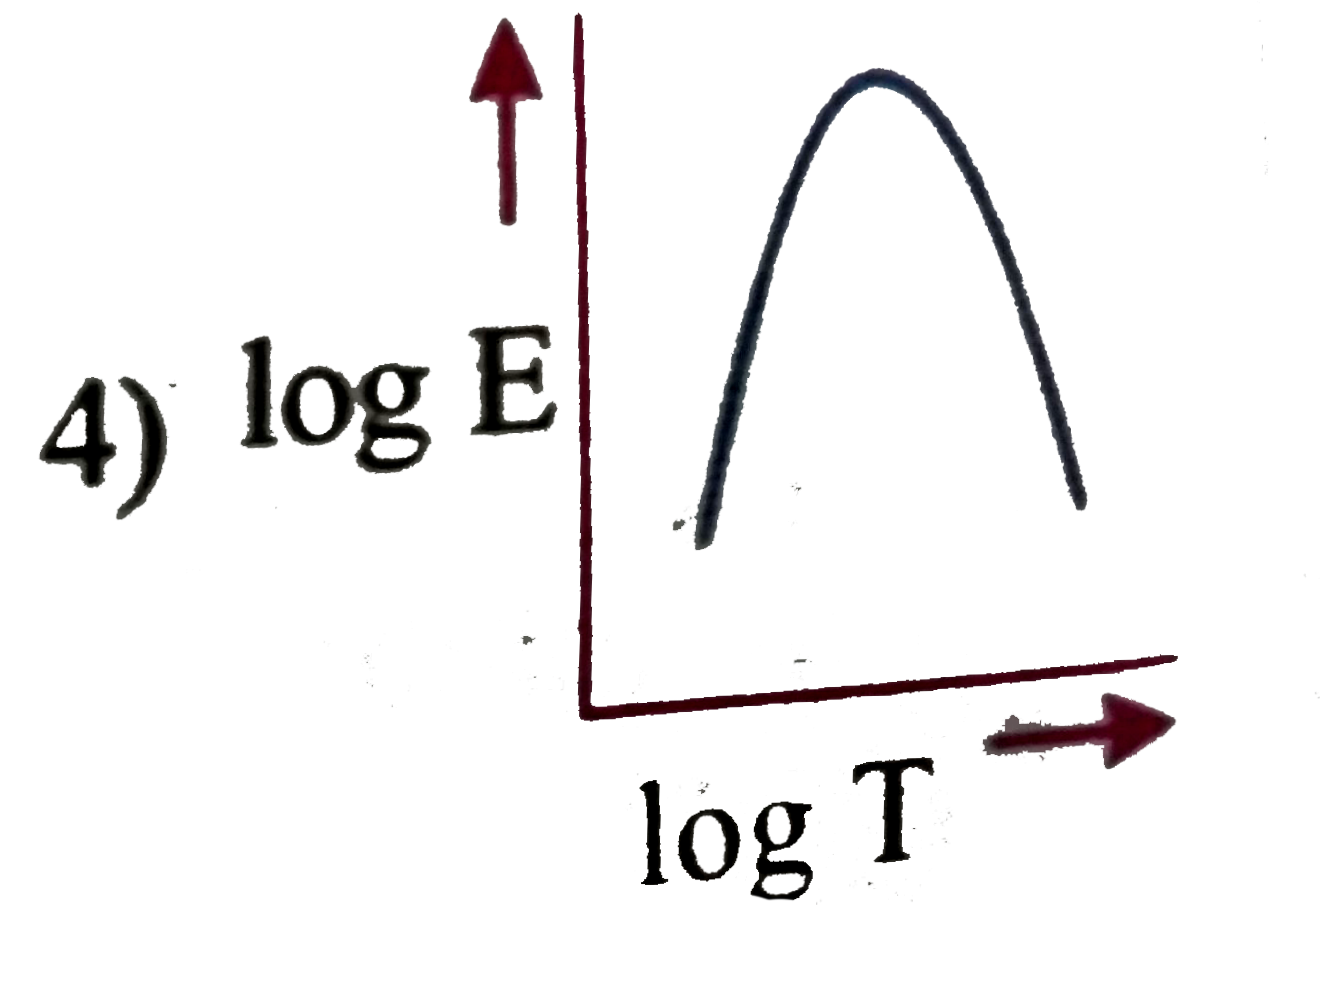
The rate of emission of radiation of a black body at 273∘C is E, then the rate of emission of raidiation of this body at 0∘C will be
AE16BE4CE8D0If the variation of rotational kinetic energy E with the angular momentum L of a body. The graph of log L and log E eill be in the form of
A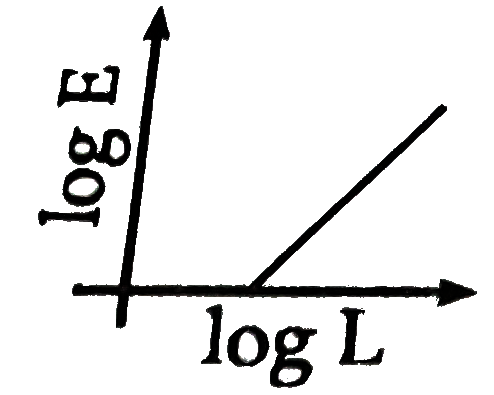 B
B C
C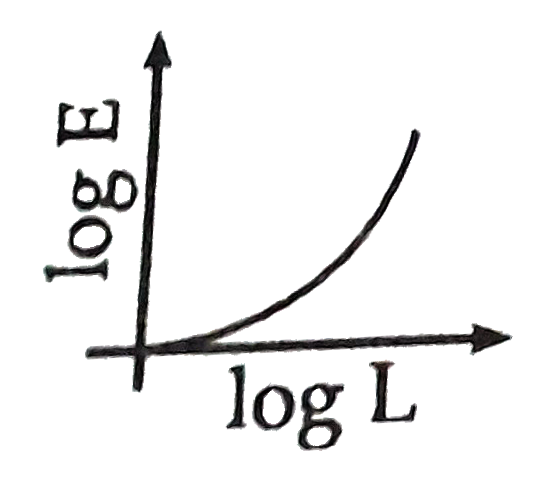 D
D
A body is kept inside a container the temperature of the body is T1 and the temperature of the container is T2 the rate at which body absorbs the energy is α The emissivity of the body is e The radiation striking the body is either absorbed or reflected
At what rate of body will absorb the radiant energy .
View SolutionIf E and λ represent the energy and wavelenght respectively of an electron, then the graph between log λ and log E will have
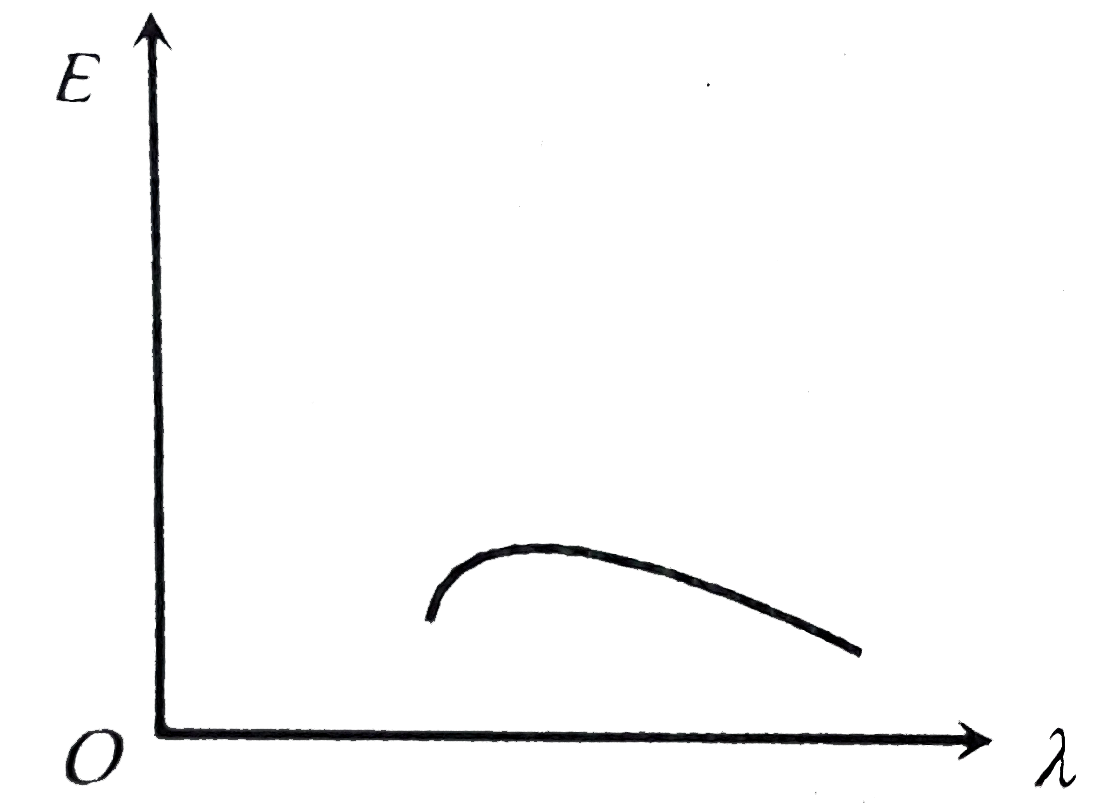
View SolutionThe energy distribution E with the wavelength (λ) for the black body radiation at temperature Kelvin T is shown in the figure. As the temperature is increased the maxima will
View SolutionGraph between log k and 1/T [where K is rate constant in s−1 and T is the temperature (in K) is a straight line with Hence, Ea will be

View SolutionThe current curve between logejT2 and lT
View Solution

