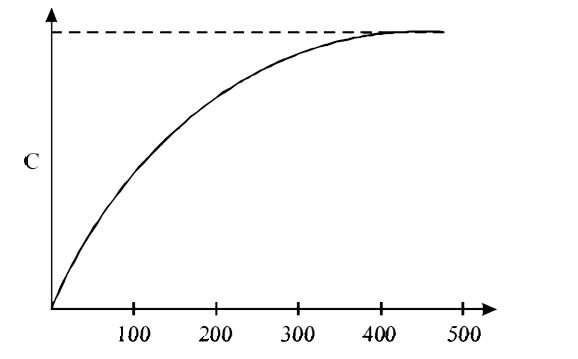
The figure shows the variation of specific heat capacity (c) of a solid as a function of temperature (T). The temperature is increased continuously from 0 to 500 K at constant rate. ignoring any volume change, the following statement(s) is (are) correct to reasonable approximation.
The rate at which heat is absorbed in the range 0 - 100K varies linearly with temperature T
Heat absorbed in increasing the temperature from 0-100K is less than the heat required for increasing the temperature from 400-500K
There is no change in the rate of heat absorption in the range 400-500K
The rate of heat absorption increase in the range 200-300K
The correct Answer is:B, C, D
Topper's Solved these Questions
- CALORIMETRY Book:AAKASH SERIESChapter:CALORIMETRY Exercise:ADDITIONAL PRACTICE EXERCISE (LEVEL - II) (LECTURE SHEET (ADVANCED)(Linked Comprehension Type Questions)
Explore 9 Videos
- CALORIMETRY Book:AAKASH SERIESChapter:CALORIMETRY Exercise:ADDITIONAL PRACTICE EXERCISE (LEVEL - II) (LECTURE SHEET (ADVANCED)(Matrix Type Questions)
Explore 1 Video
- CALORIMETRY Book:AAKASH SERIESChapter:CALORIMETRY Exercise:ADDITIONAL PRACTICE EXERCISE (LEVEL - II) (LECTURE SHEET (ADVANCED)(Straight Objective Type Questions)
Explore 19 Videos
- APPENDICES Book:AAKASH SERIESChapter:APPENDICES Exercise:GRAVITATION (EARTH SATELLITES AND ESCAPE SPEED)
Explore 35 Videos
- CENTRE OF MASSBook:AAKASH SERIESChapter:CENTRE OF MASSExercise:ADDITIONAL PRACTICE EXERCISE (PRACTICE SHEET (ADVANCED))
Explore 3 Videos
Similar Questions
The figure below shows the variation of specific heat capacity (C) of a solid as a function of temperature (T). The temperature is increased continuously form 0 to 500K at a constant rate. Ignoring any volume change, the following statement (s) is (are) correct to a reasonable approximation.

View SolutionThe figure below shows the variation of specific heat capacity (C) of a solid as a function of temperature (T). The temperature is increased continuously form 0 to 500K at a constant rate. Ignoring any volume change, the following statement (s) is (are) correct to a reasonable approximation.

View Solution
Knowledge Check
The figure shows the variation of specific heat capacity (C ) of a solid as a function of temperature (T). The temperature is increased continuously from 0 to 500 K at a constant rate. Ignoring any volume change, the following statements(s) is/are correct to a reasonable approximation.
 AThe rate at which heat is absorbed in the range 0-100 K varies linearly with temperature TBHeat absorbed in increasing the temperature from 0-100 K is less than the heat required for increasing the temperature from 400-500 KCThere is no change in the rate of heat absorption in the range 400-500 KDThe rate of heat absorption increases in the range 200-300 K
The figure below shows the variation of specific heat capacity (C) of a solid as a function of temperature (T). The temperature is increased continuousely form 0 to 500K at a constant rate. Ignorign any volume change, the following statement (s) is (are) correct to a reasonable approximation.
 AThe rate at which heat is absorbed in the range 0-100K varies linearly with temperature T.BHeat absorbed in increasing the temperature from 0-100K is less than the heat required for increasing the temperature from 400-500K.CThere is no change in the rate of heat absorption in the range 400-500K.DThe rate of heat absorption increases in the range 200-300K.
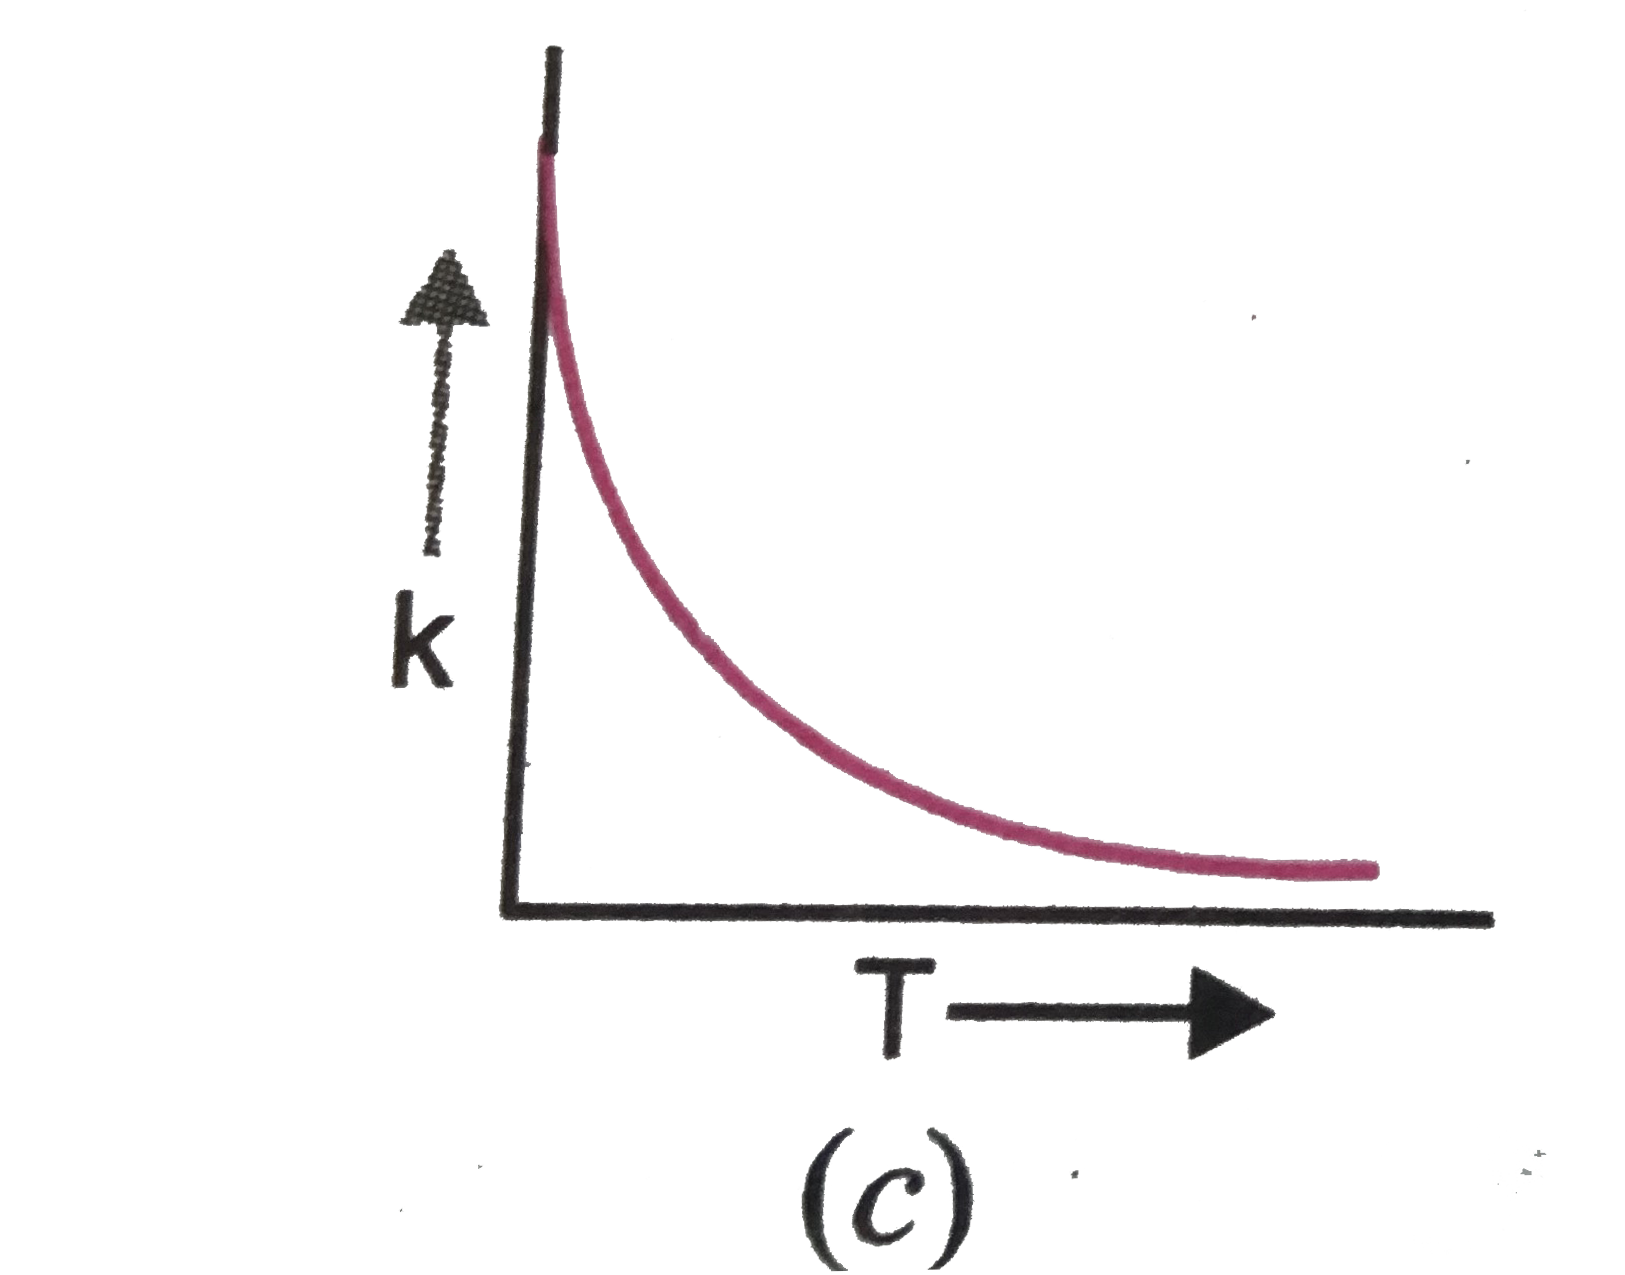
Plots showing the variation of the rate constant (k) with temperature (T) are given below. The plot that follows the Arrhenius equation is
A B
B C
C D
D
The figure below shows the variation of specific heat capacity (C) of a solid as a function of temperature (T). The temperature is increased continuously form 0 to 500K at a constant rate. Ignoring any volume change, the following statement (s) is (are) correct to a reasonable approximation.

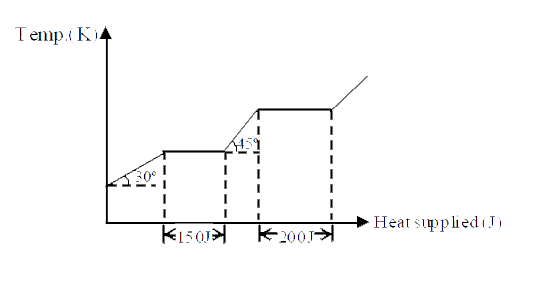
View SolutionThe temperature change versus heat supplied curve is given for 1 kg of a solid block. Then which of the following statement(s) is/are correct:

View SolutionPlots showing the variation of the rate constant (k) with temperature (T) are given below. The plot that follows the Arrhenius equation is
View SolutionPlots showing the variation of the rate constant (k) with temperature (T) are given below. The plot that follows Arrhenius equations is
View SolutionPlots showing the variation of the rate constant (k) with temperature (T) are given below. The plot that follows the Arrhenius equation is
View Solution
