Heat is supplied to a certain homogeneous sample of matter at a uniform rate. Its temperature is plotted against time as shown in fig. Which of the following conclusion can be drawn?
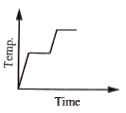
Its specific heat capacity is greater in solid state than in liquid state
Its specific heat capacity is greater in liquid state than in solid state
Its latent heat of vaporization is greater than its latest heat of fusion
Its latent heat of vaporization is smaller than its latent heat of fusion
The correct Answer is:A, C
Topper's Solved these Questions
- CALORIMETRY BOOK - AAKASH SERIESCHAPTER - CALORIMETRY EXERCISE - ADDITIONAL PRACTICE EXERCISE (LEVEL - II) (LECTURE SHEET (ADVANCED)(Linked Comprehension Type Questions)
9 Videos
- CALORIMETRY BOOK - AAKASH SERIESCHAPTER - CALORIMETRY EXERCISE - ADDITIONAL PRACTICE EXERCISE (LEVEL - II) (LECTURE SHEET (ADVANCED)(Matrix Type Questions)
1 Video
- CALORIMETRY BOOK - AAKASH SERIESCHAPTER - CALORIMETRY EXERCISE - ADDITIONAL PRACTICE EXERCISE (LEVEL - II) (LECTURE SHEET (ADVANCED)(Straight Objective Type Questions)
19 Videos
- APPENDICES BOOK - AAKASH SERIESCHAPTER - APPENDICES EXERCISE - GRAVITATION (EARTH SATELLITES AND ESCAPE SPEED)
35 Videos
- CENTRE OF MASSBOOK - AAKASH SERIESCHAPTER - CENTRE OF MASSEXERCISE - ADDITIONAL PRACTICE EXERCISE (PRACTICE SHEET (ADVANCED))
3 Videos
Similar Questions
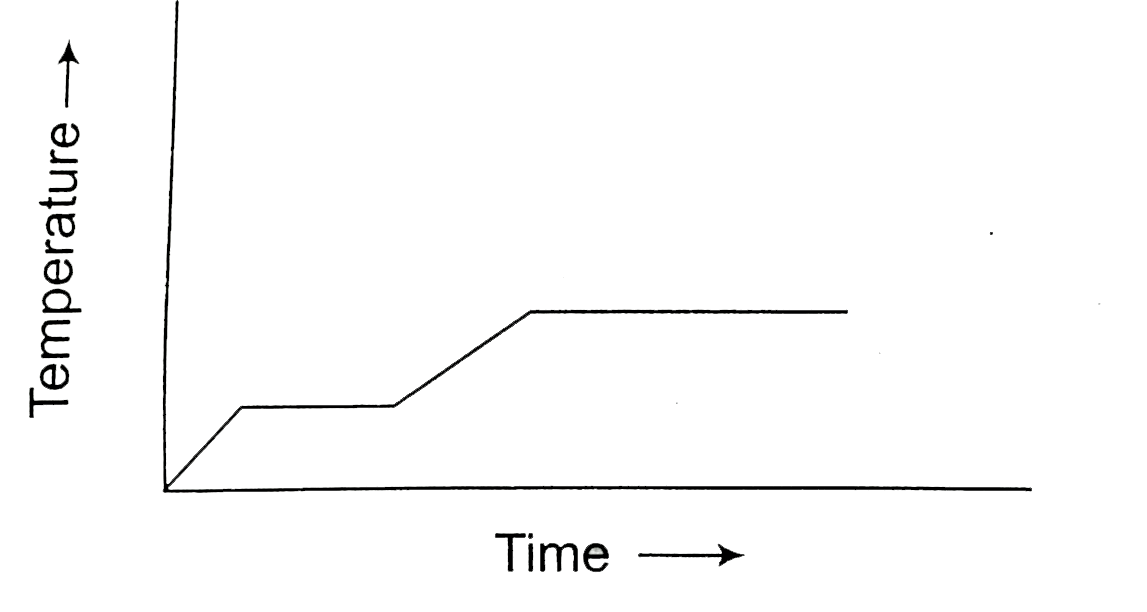
Heat is supplied to a certain homogeneous sample of matter, at a uniform rate. Its temperature is plotted against time, as shown Which of the following conclusions can be drawn?
(i) Its specific heat capacity is greater in the solid state than the liquid state.
(ii) Its specific heat capacity is greater in the liquid state than in the solid state.
(iii) Its latent heat of vaporization is greater than its latent heat of fusion.
(iv) Its latent heat of vaporization is smaller than its latent heat of fusion
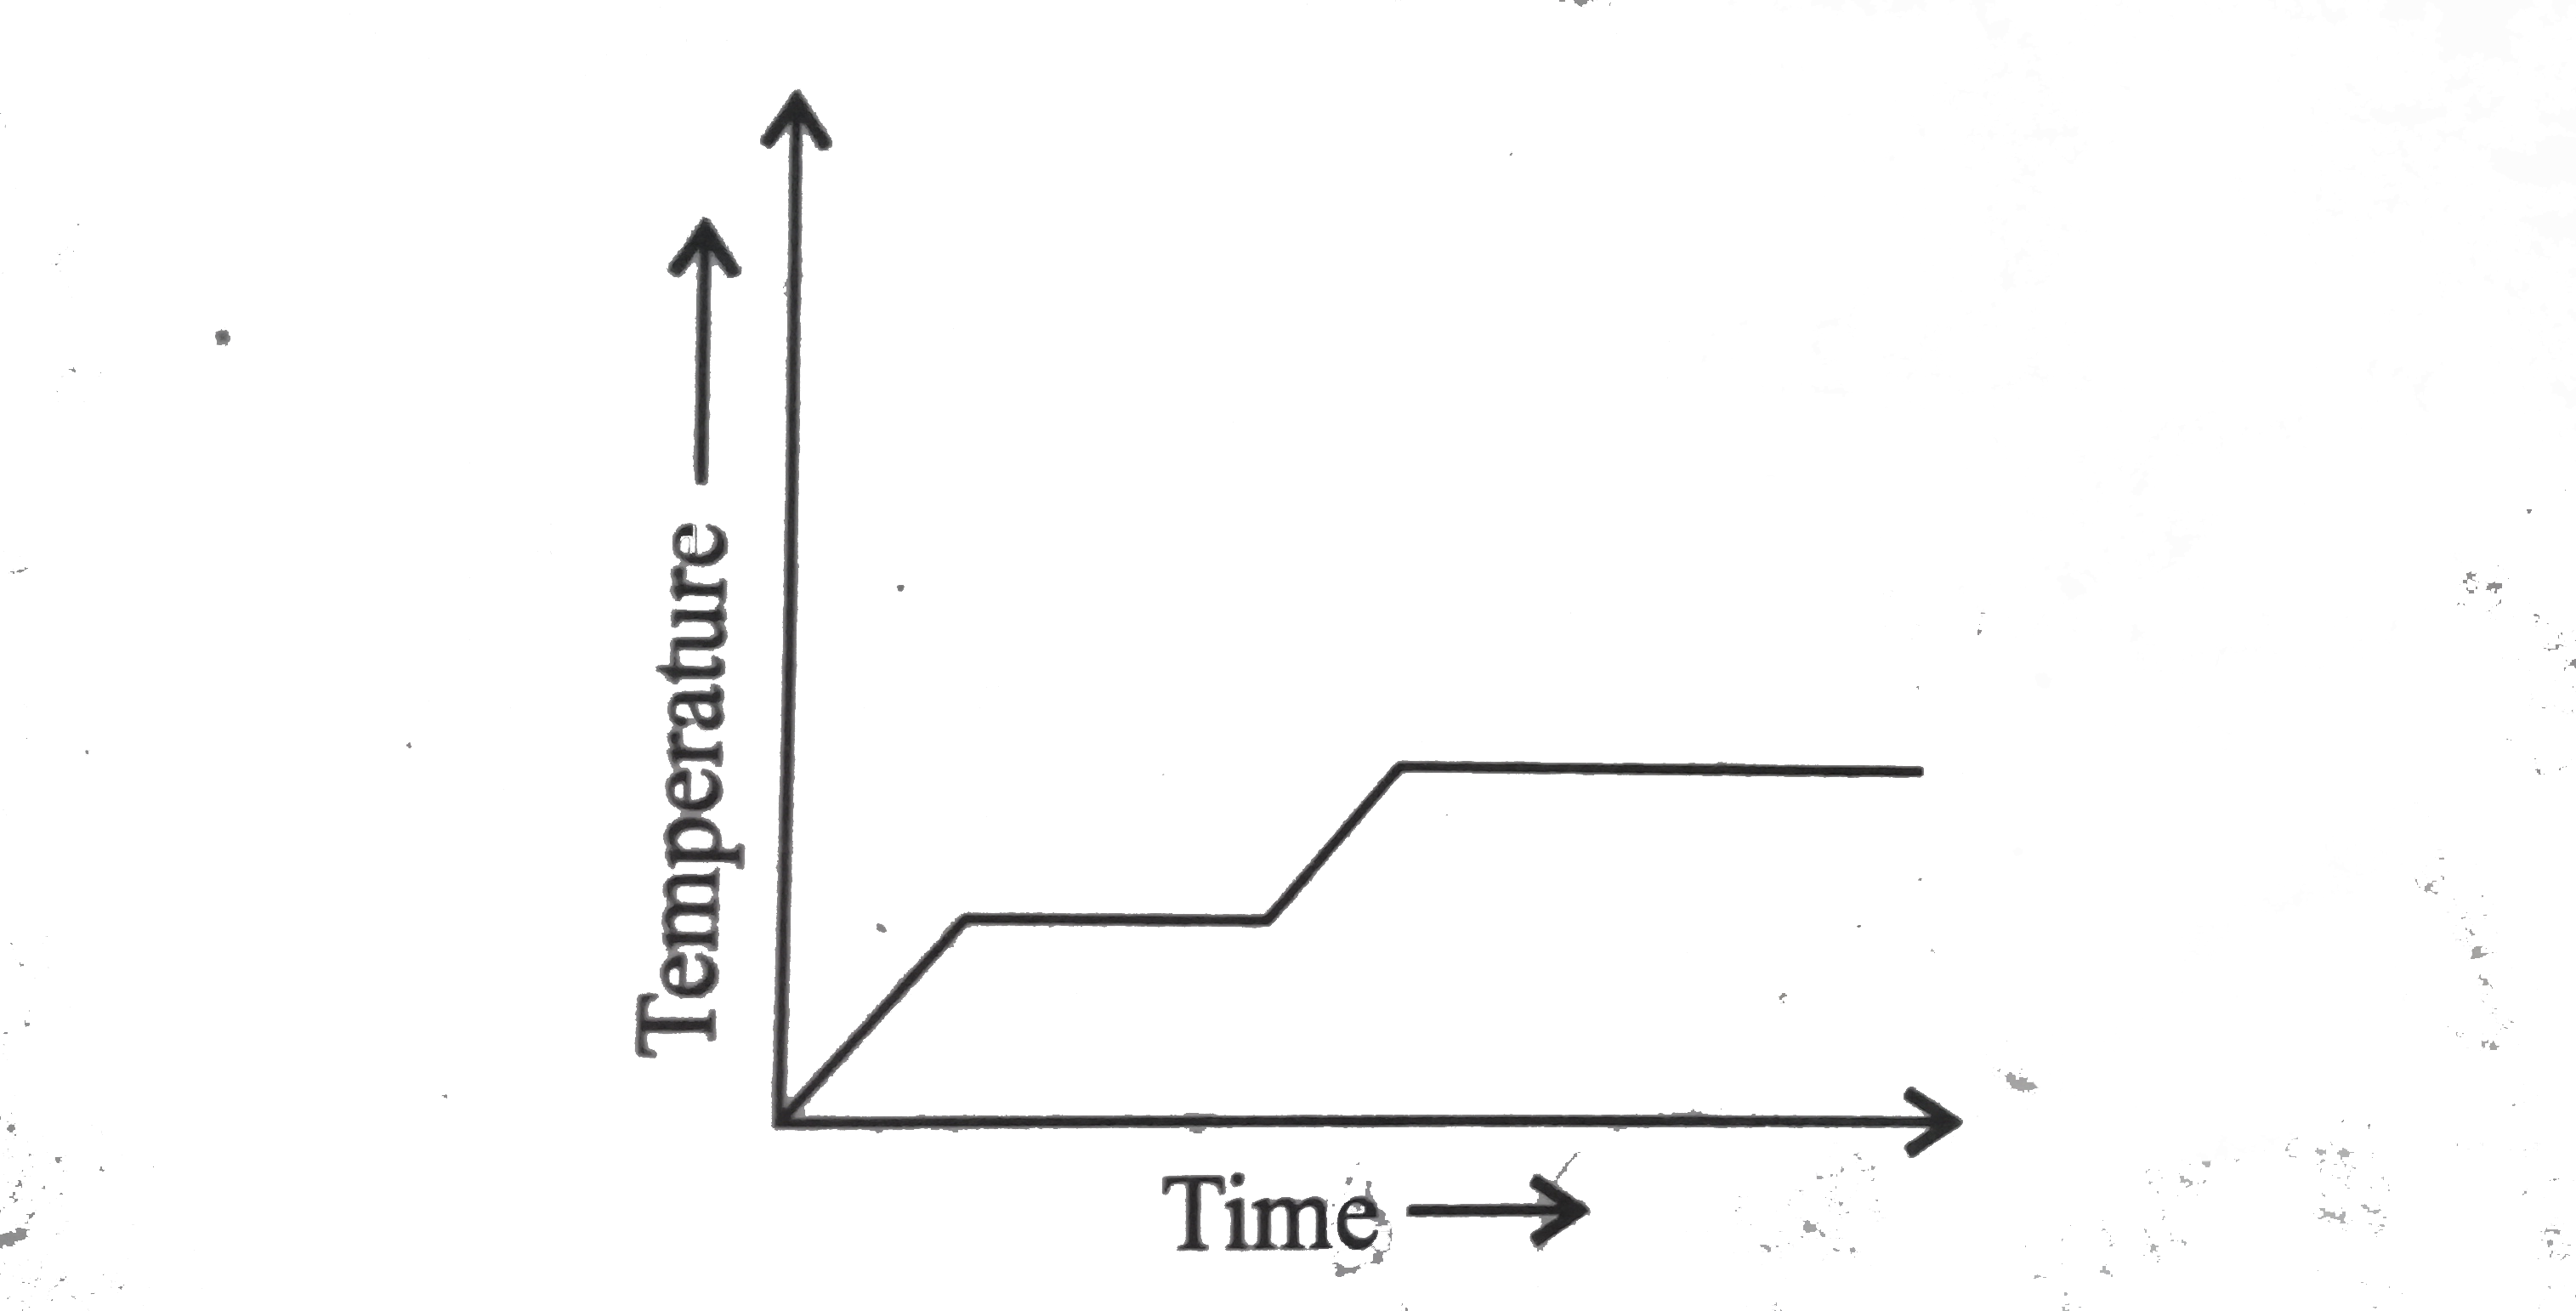
View SolutionHeat is supplied to a certain homogeneous sample of amtter, at a uniform rate. Its temperature is plotted against time, as shown in the figure below. Which of the following conclusions can be drawn?
View Solution
Knowledge Check

Heat is supplied to a certain homogeneous sample of matter, at a uniform rate. Its temperature is plotted against time, as shown Which of the following conclusions can be drawn?
(i) Its specific heat capacity is greater in the solid state than the liquid state.
(ii) Its specific heat capacity is greater in the liquid state than in the solid state.
(iii) Its latent heat of vaporization is greater than its latent heat of fusion.
(iv) Its latent heat of vaporization is smaller than its latent heat of fusionA(i),(iii)B(ii),(iii)C(iii),(iv)D(i),(iv)Heat is supplied to a certain homogeneous sample of amtter, at a uniform rate. Its temperature is plotted against time, as shown in the figure below. Which of the following conclusions can be drawn?
 AIts specific heat capacity is greater in the solid state than in the liquid state.BIts specific heat capacity is smaller in the solid state than in the liquid state.CIts latent heat of vaporisation is greater than its latent heat of fusion.DIts latent heat of vaporisation is smaller than its latent heat of fusion.
A hot liquid is kept in a big room. Its temperature is plotted as a function of time. Which of the following curves may present the plot ?
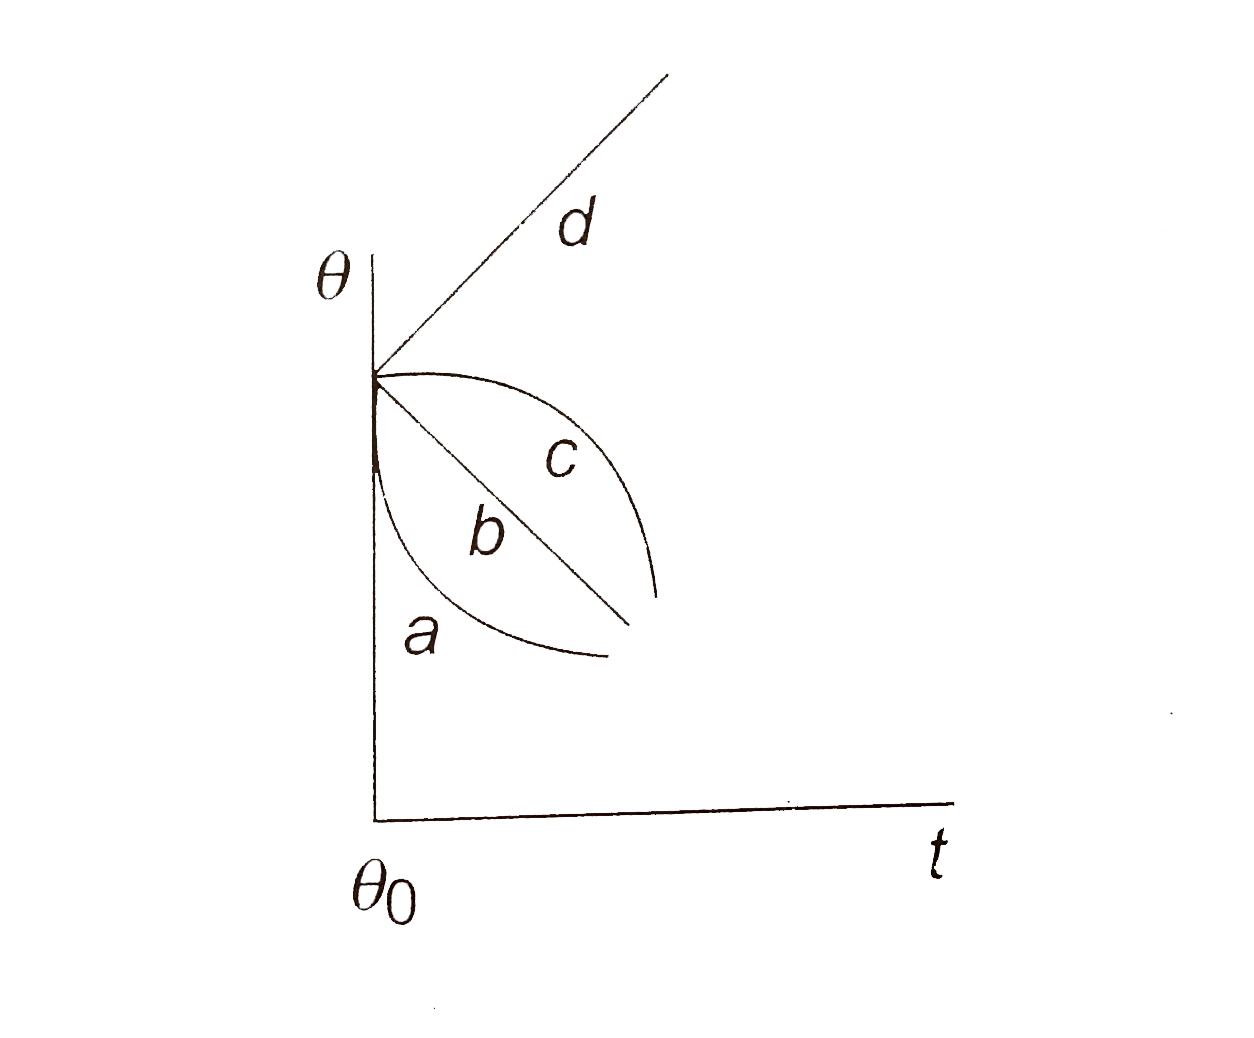 AaBbCcDd
The age pyramid for human population is shown below
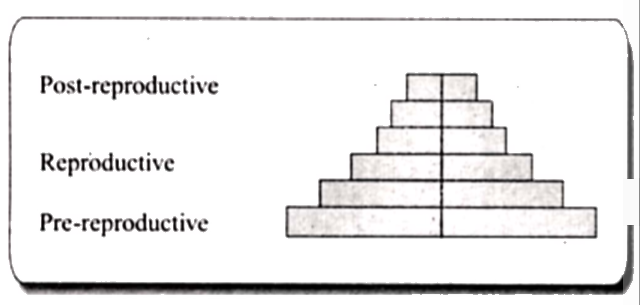
Which of the following conclusion can be drawn from the given age pyramid?
View SolutionThe age pyramid for human population is shown below

Which of the following conclusion can be drawn from the given age pyramid?
View SolutionA hot liquid is kept in a big room. Its temperature is plotted as a function of time. Which of the following curves may represent the plot?
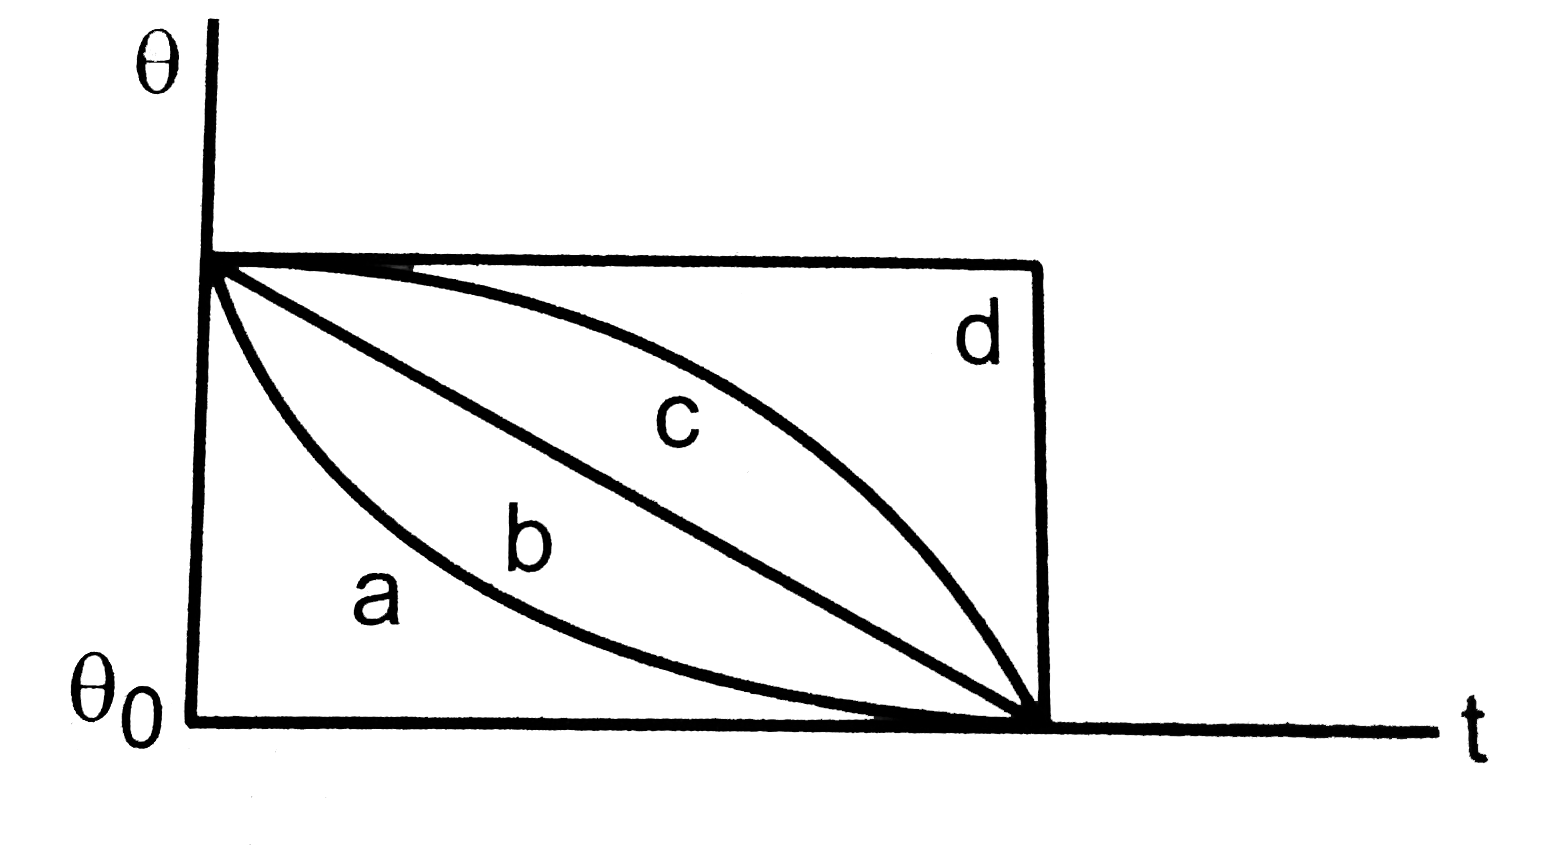
View SolutionA hot liquid is kept in a big room. Its temperature is plotted as a function of time. Which of the following curves may represent the plot?

View SolutionThe variation of decay rate of two radioactive samples A and B with time is shown in fig.
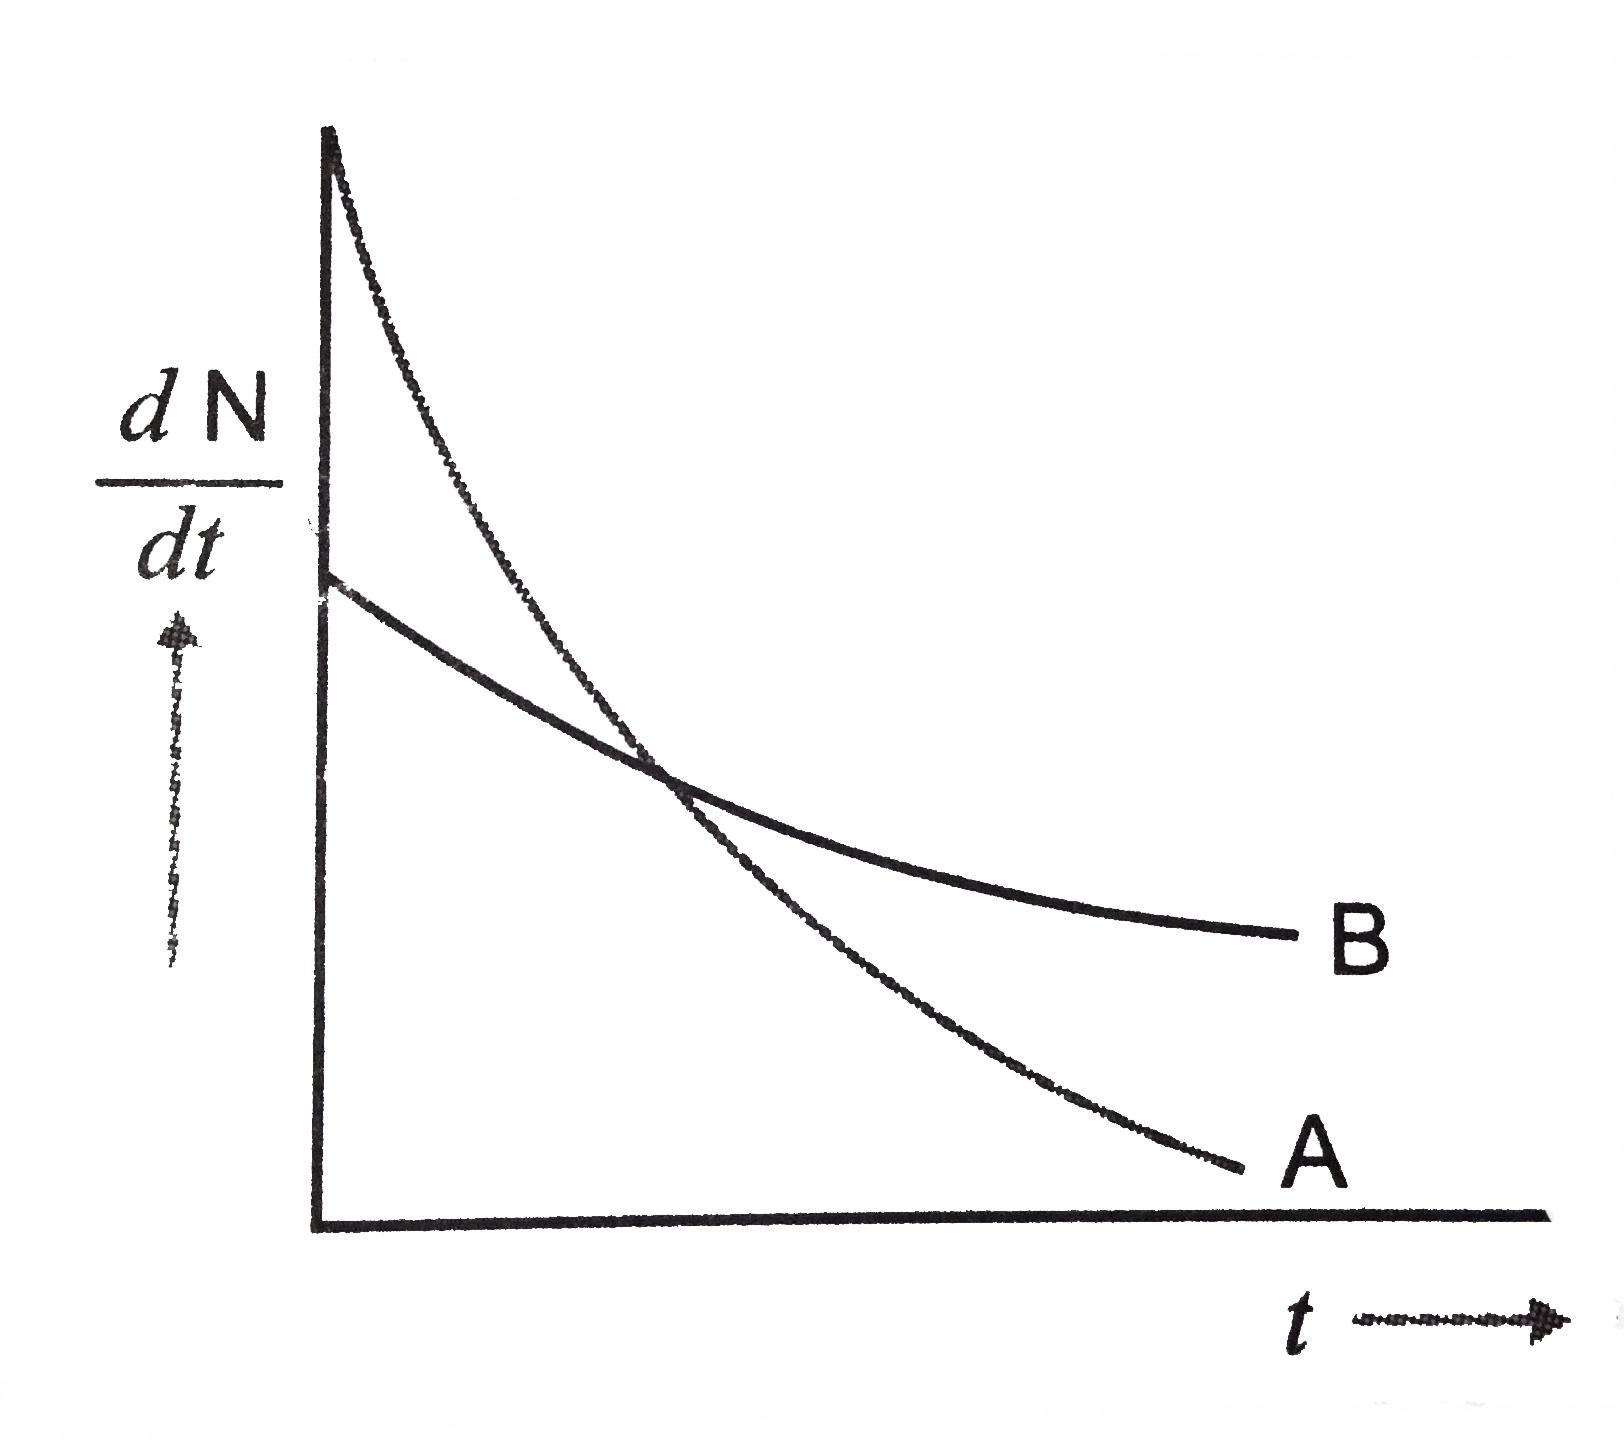
Which of the following statements are true?
View Solution
