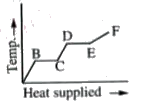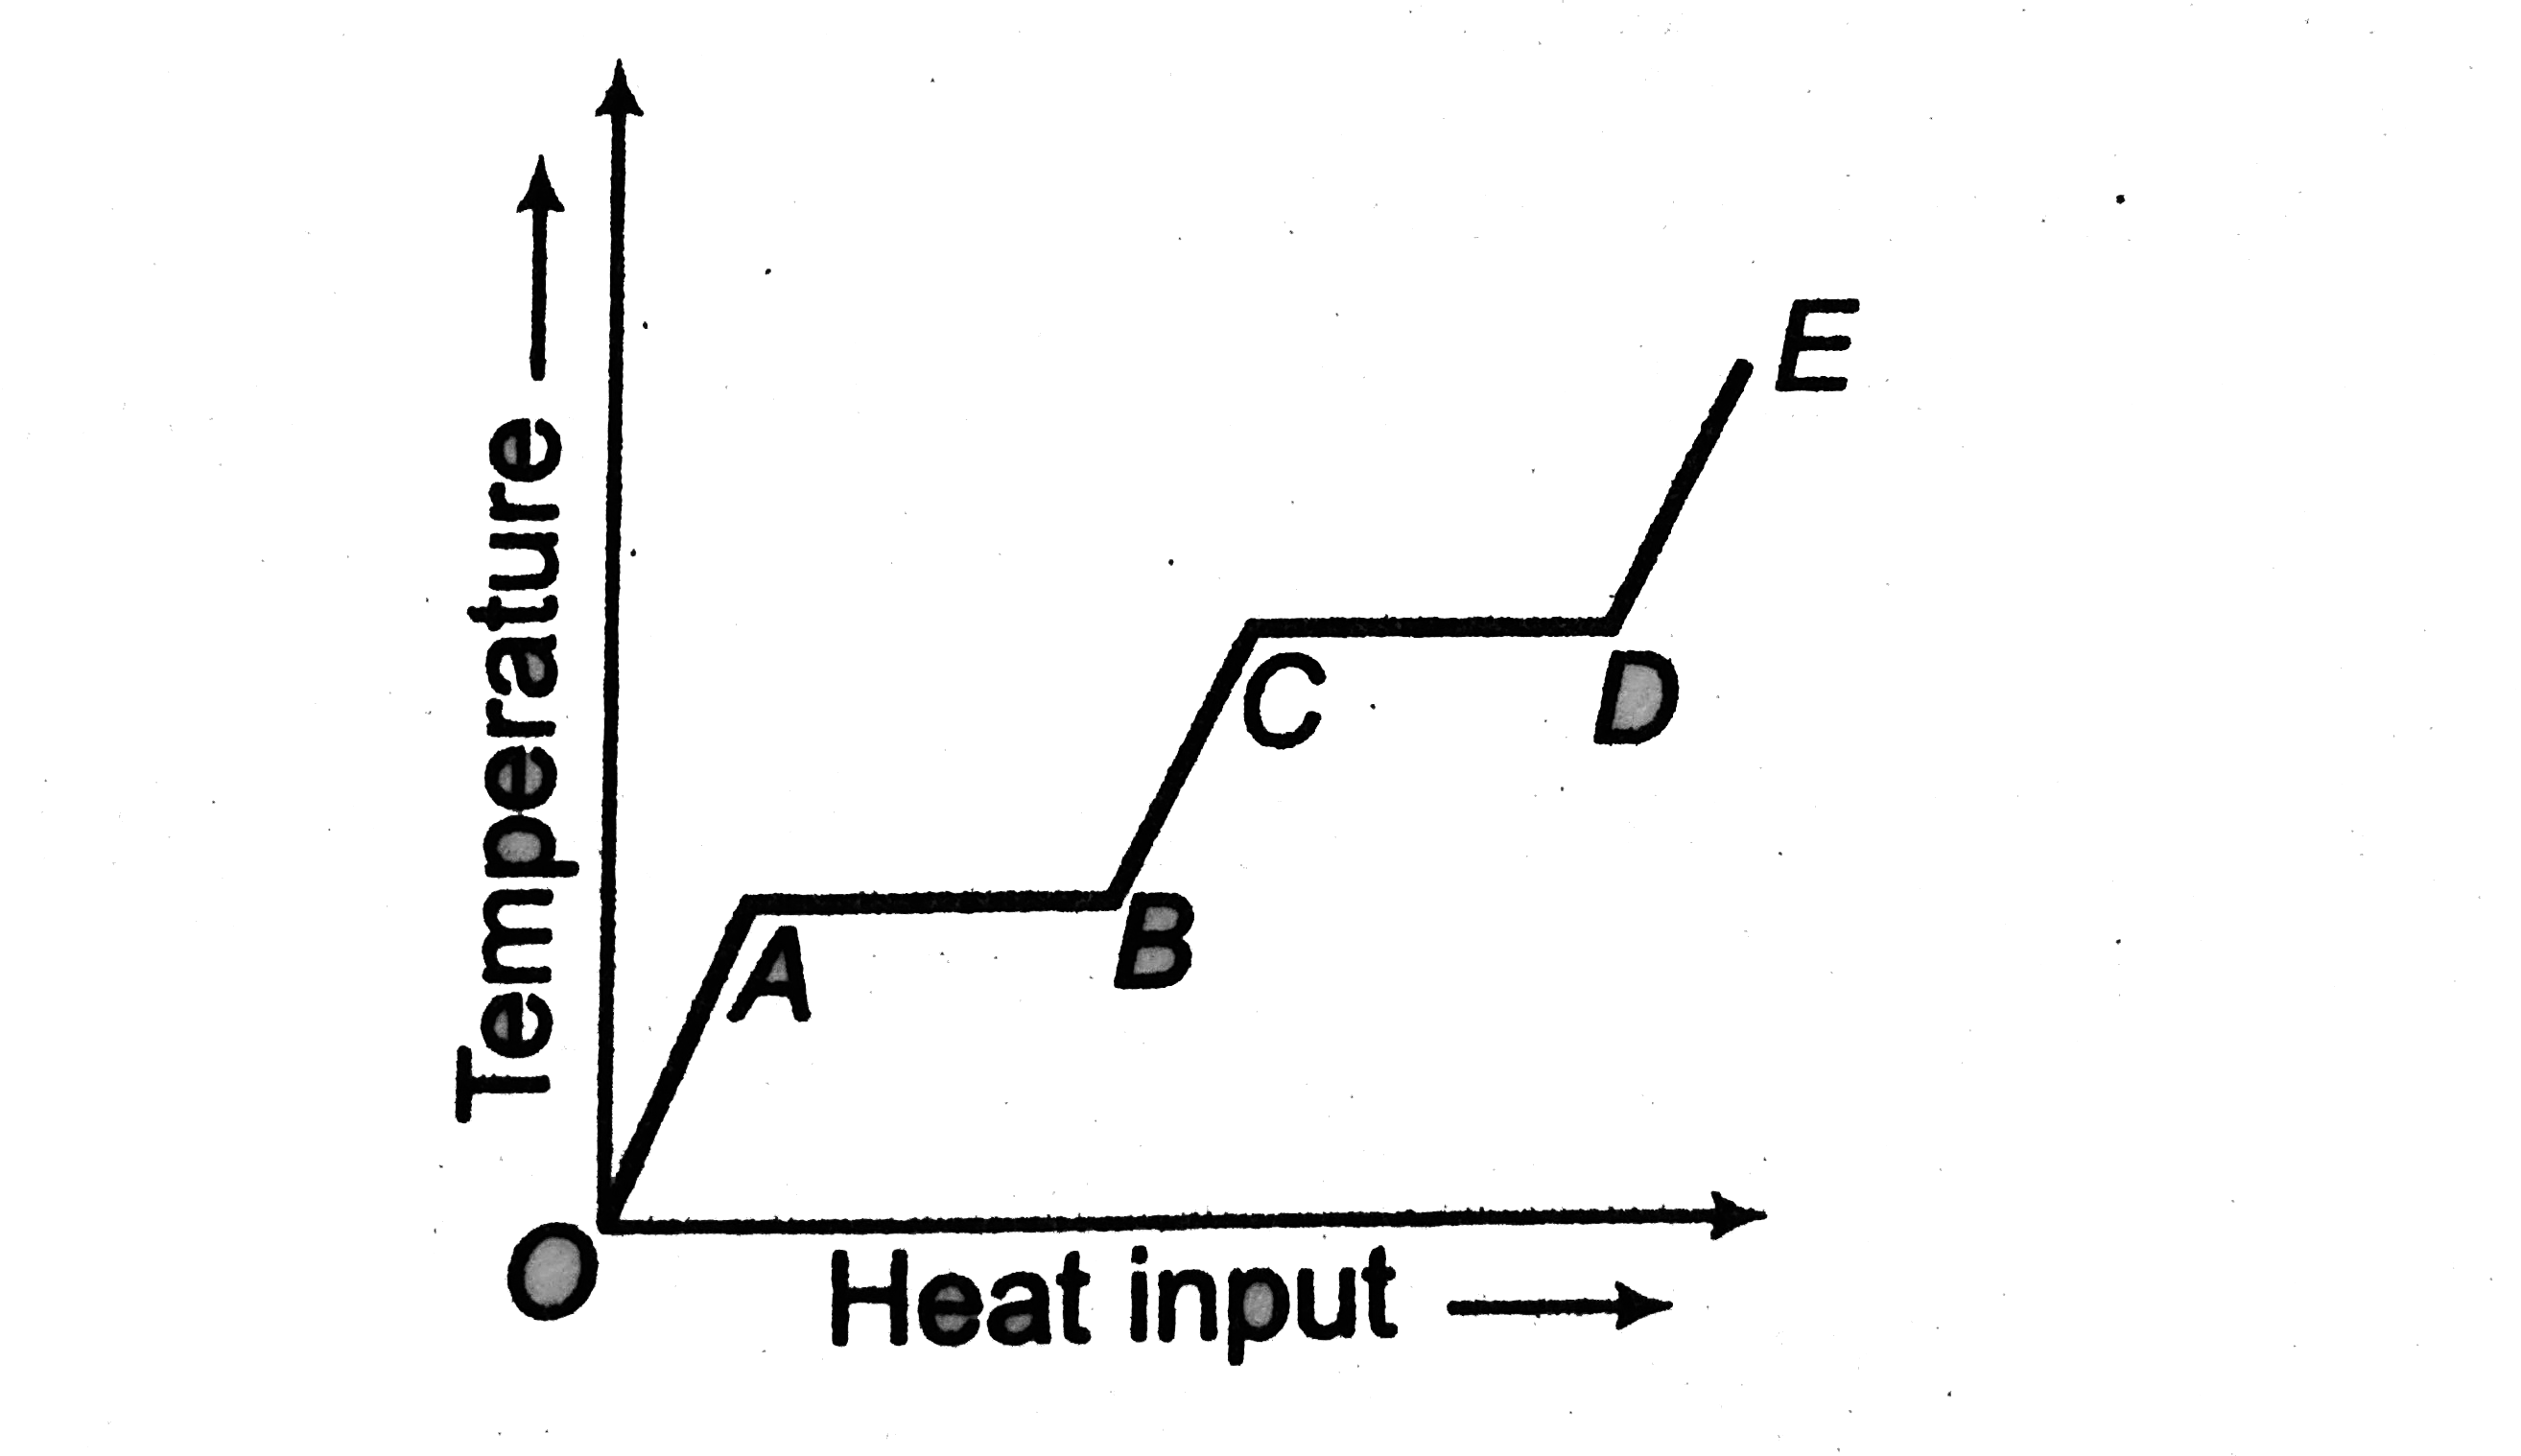
A source of heat supplies heat at a constant rate to solid cube. The variation of temperature of the . cube with heat supplied is shown
The portion DE of graph represents conversion of:
solid into liquid
liqiud into vapour
Solid into vapour
Vapour into liquid
The correct Answer is:B
Topper's Solved these Questions
- CALORIMETRY BOOK - AAKASH SERIESCHAPTER - CALORIMETRY EXERCISE - ADDITIONAL PRACTICE EXERCISE (LEVEL - II) (LECTURE SHEET (ADVANCED)(Matrix Type Questions)
1 Videos
- CALORIMETRY BOOK - AAKASH SERIESCHAPTER - CALORIMETRY EXERCISE - ADDITIONAL PRACTICE EXERCISE (LEVEL - II) (LECTURE SHEET (ADVANCED)(More than one correct answer Type Questions )
10 Videos
- APPENDICES BOOK - AAKASH SERIESCHAPTER - APPENDICES EXERCISE - GRAVITATION (EARTH SATELLITES AND ESCAPE SPEED)
35 Videos
- CENTRE OF MASSBOOK - AAKASH SERIESCHAPTER - CENTRE OF MASSEXERCISE - ADDITIONAL PRACTICE EXERCISE (PRACTICE SHEET (ADVANCED))
3 Videos
Similar Questions
A source of heat supplies heat at constant rate to a solid cube. The variatiion of the temperature of the cube with heat supplied is shown in figure. The portion DE of the graph represents conversion of

View SolutionA solid material is supplied heat at a constant rate. The temperature of material is changing with heat input as shown in the figure. What does the slope of DE represent ?

View Solution
Knowledge Check
A solid material is supplied heat at a constant rate. The temperature of material is changing with heat input as shown in the figure. What does the slope of DE represent ?
 ALatent heat of liquidBLatent heat of vaporizationCHeat capacity of vapourDInverse of heat capacity of vapour
A gas is heated at a constant pressure. The fraction of heat supplied used of external work is
A1γB(1−1γ)Cγ−1D(1−1γ2)Heat supplied to a gas at constant volume is utilised to
Aincrease the internal energy of the gasBto do external work done against external pressureCether 'a' or 'b'Dboth 'a' and 'b'
A gas is heated at a constant pressure. The fraction of heat supplied used of external work is
View SolutionA piece of ice is heated at a constant rate. The variation in temperature with time of heating is shown in the graph in Fig. 11.6.
(i) What is represented by the part AB ?
(ii) What does the part CD represent ?
(iii) What conclusion do you draw regarding the nature of ice from the graph ?
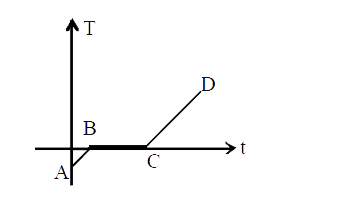
View SolutionHeat is supplied to a ice at a constant rate Temperature variation with time is as shown in figure. Then –

View SolutionIn the above problem if heat is supplied at a constant rate of q=10cal/min, then plot temperature versus time graph.
View SolutionIn the above problem if heat is supplied at a constant rate of q=10cal/min, then plot temperature versus time graph.
View Solution
