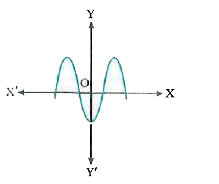
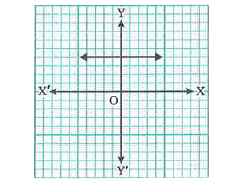
The graphs of y=p(x) are given in the figures below, for some polynomials p(x) :

Find the number of zeroes of p(x) in each case .Solution in Gujrati
The correct Answer is:4
Step by step video, text & image solution for The graphs of y= p(x) are given in the figures below, for some polynomials p(x) : Find the number of zeroes of p(x) in each case . by Maths experts to help you in doubts & scoring excellent marks in Class 10 exams.
Topper's Solved these Questions
- BOOK - KUMAR PRAKASHANCHAPTER - POLYNOMIALSEXERCISE - EXERCISE 2.16videos
POLYNOMIALS
- BOOK - KUMAR PRAKASHANCHAPTER - POLYNOMIALSEXERCISE - EXERCISE 2.212videos
POLYNOMIALS
- BOOK - KUMAR PRAKASHANCHAPTER - POLYNOMIALSEXERCISE - OBJECTIVE QUESTIONS26videos
POLYNOMIALS
- BOOK - KUMAR PRAKASHANCHAPTER - PAIR OF LINEAR EQUATIONS IN TWO VARIABLES EXERCISE - Test Your Skills48videos
PAIR OF LINEAR EQUATIONS IN TWO VARIABLES
- BOOK - KUMAR PRAKASHANCHAPTER - PROBABILITY EXERCISE - OBJECTIVE QUESTIONS (State whether each of the following statements is true or false:)5videos
PROBABILITY
Similar Questions
The graphs of y=p(x) are given in the figures below, for some polynomials p(x). Find the number of zeroes of p(x), in each case.
 02:11View Solution
Find the zeroes of the following quadratic polynomials and verify the relationship between the zeroes and the coefficients :
x2−2x−802:45View SolutionFill in the blanks so as to make each of the following statements true :
The zero of linear polynomial p(x)=3x+2 is………02:17View SolutionIf the numerator of a fraction is decreased by 1. It reduces to 12 and if its numerator is increased by 1. it reduces to 1. Represent this situation algebraically and graphically.
05:41View SolutionFor any event A, P (A) is always greater than P(¯¯¯A).
03:28View SolutionDetermine the point of symmetry of a regular hexagon.
02:31View SolutionMatch the following Column A to Column B
 02:21View Solution
Match the following Column A to Column B
 02:03View Solution
Match the following Column A to Column B
 02:10View Solution
Find the area of figure given below.
 02:17View Solution
Find the perimeter of the figure given below.
 02:10View Solution
Find the area of the figure given below.
 01:13View Solution
The area of the shaded part in the figure given below is ______.
 01:49View Solution
The inequation represented by the graph given below is :
01:30View SolutionThe inequation that best describes the graph given below is _________
01:06View SolutionThe inequation that best describes the following graph is _________
01:08View Solution

