Out of the following graphs the graph that represents the variaion of the value of gravitational potential V, with distance r from the centre, due to a hollow spherical shell is


The correct Answer is:C
Topper's Solved these Questions
- GRAVITATIONALBOOK - AAKASH SERIESCHAPTER - GRAVITATIONALEXERCISE - EXERCISE -1B
46 Videos
- GRAVITATIONALBOOK - AAKASH SERIESCHAPTER - GRAVITATIONALEXERCISE - EXERCISE-2
146 Videos
- GRAVITATIONALBOOK - AAKASH SERIESCHAPTER - GRAVITATIONALEXERCISE - EXERCISE -3
154 Videos
- GRAVITATIONBOOK - AAKASH SERIESCHAPTER - GRAVITATIONEXERCISE - ADDITIONAL PRACTICE EXERCISE (LEVEL-II) PRACTICE SHEET (ADVANCED)Integer Type Questions
6 Videos
- HORIZONTAL CIRCULAR MOTIONBOOK - AAKASH SERIESCHAPTER - HORIZONTAL CIRCULAR MOTIONEXERCISE - ADDITIONAL PRACTICE EXERCISE (PRACTICE SHEET (ADVANCED) Integer Type Questions)
3 Videos
Similar Questions
Which one of the following graphs represents the variation of electric field with distance r from the centre of a charged spherical conductor of radius R?
View SolutionWhich one of the following graphs represents the variation of electric field with distance r from the centre of a charged spherical conductor of radius R?
View Solution
Knowledge Check
Which one of the following graphs represents correctly represent the variation of the gravitational field (E) with the distance (r) from the centre of a spherical shell of mass M radius R ?
A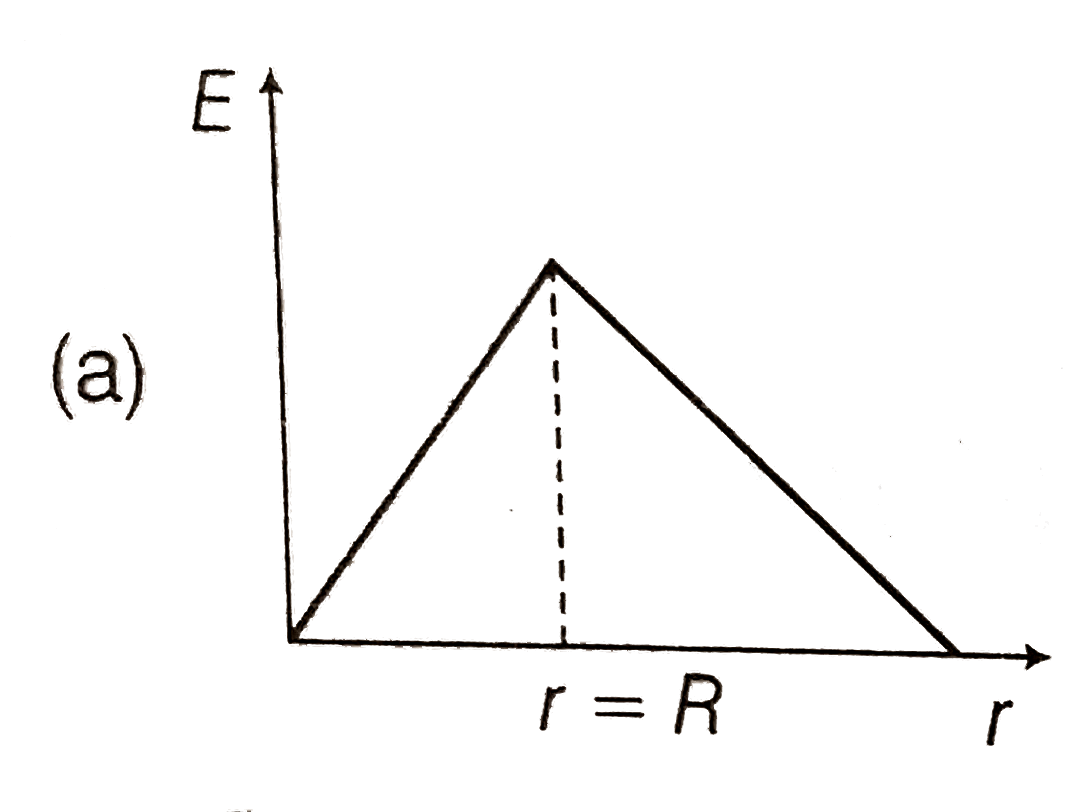 B
B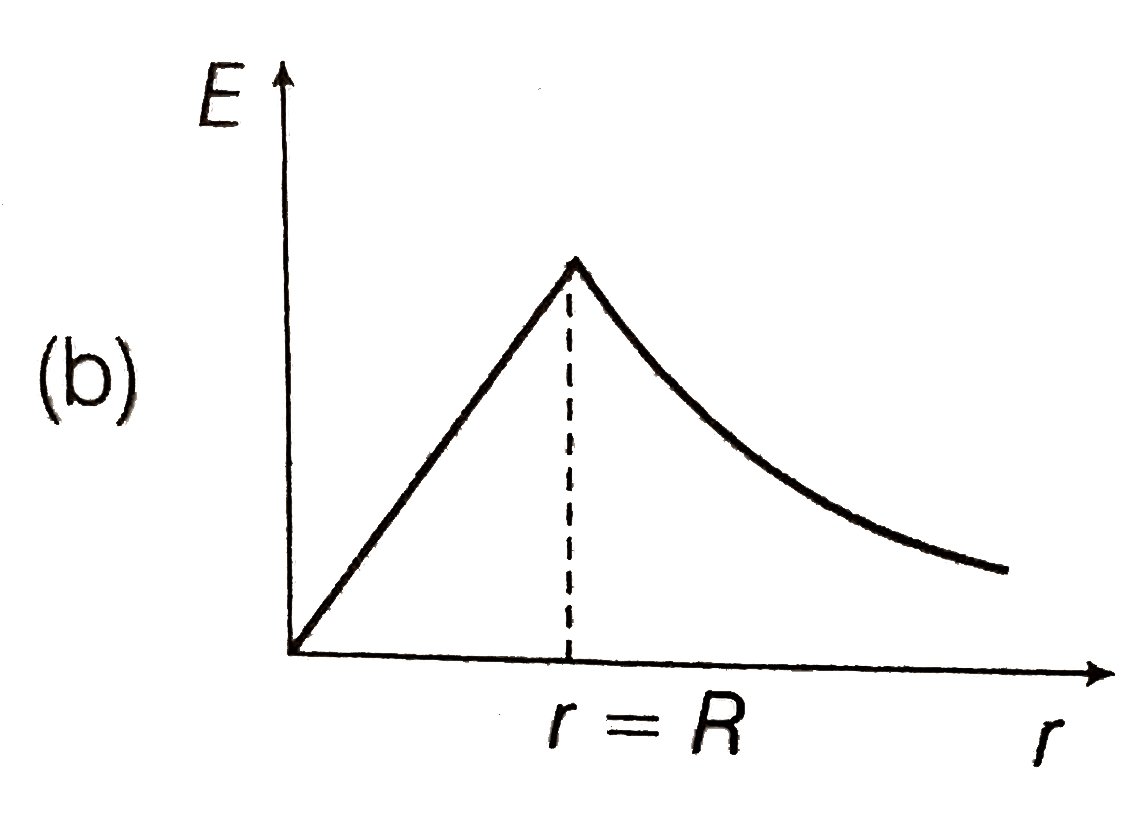 C
C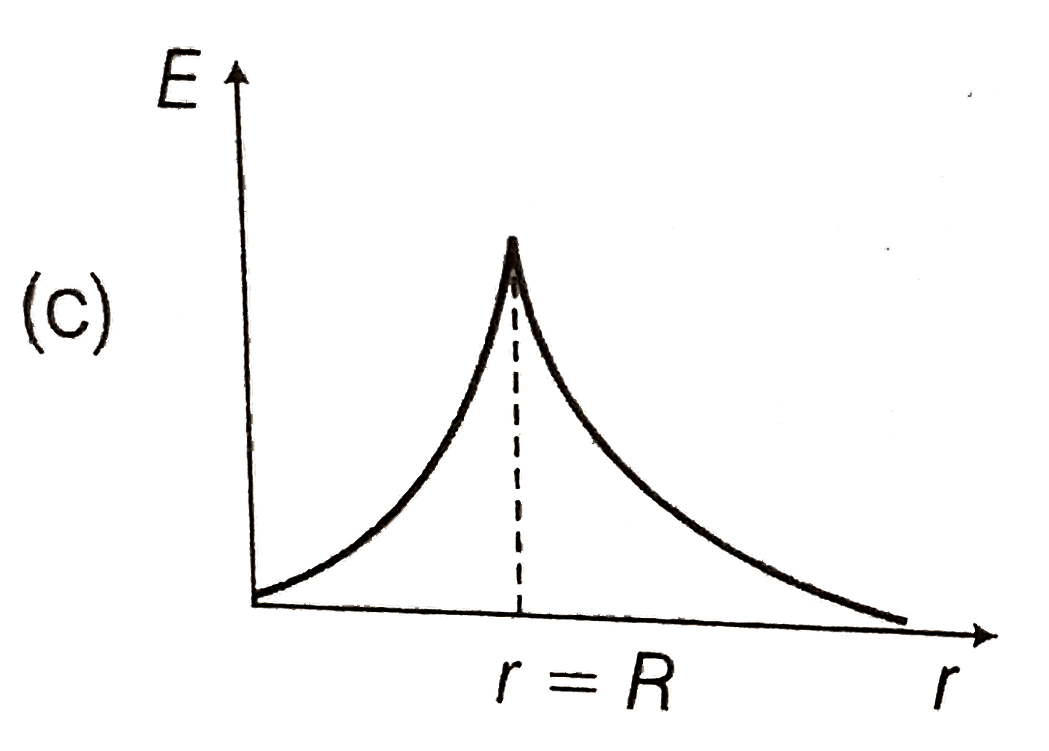 D
D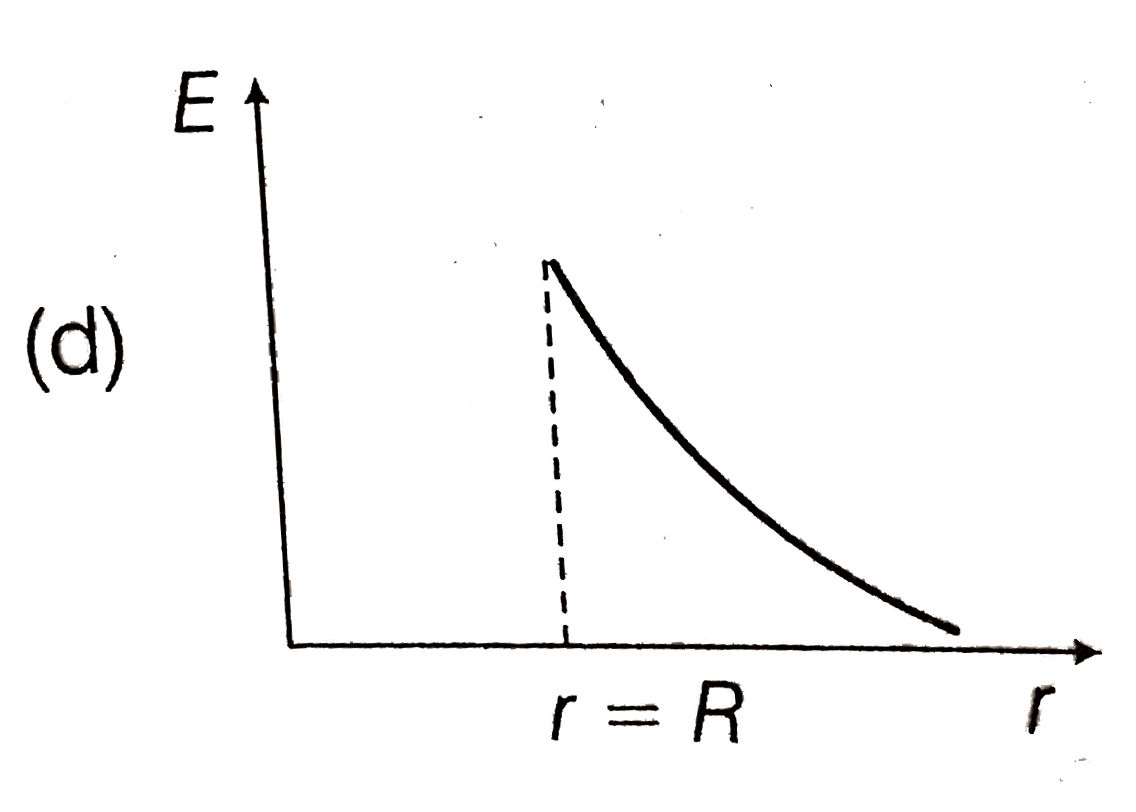
The dependence of electric potential V on the distance 'r' from the centre of a charged spherical shell is shown by :
A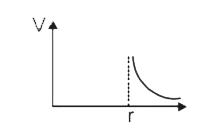 B
B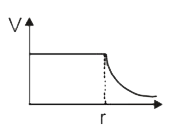 C
C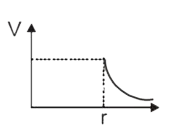 D
D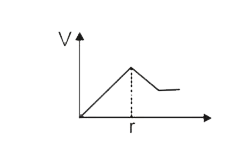
Which one of the following plots represents the variation of the gravitational field on a particle with distance r due to a thin spherical shell of raduis R? (r is measured from the centre of the spherical shell).
A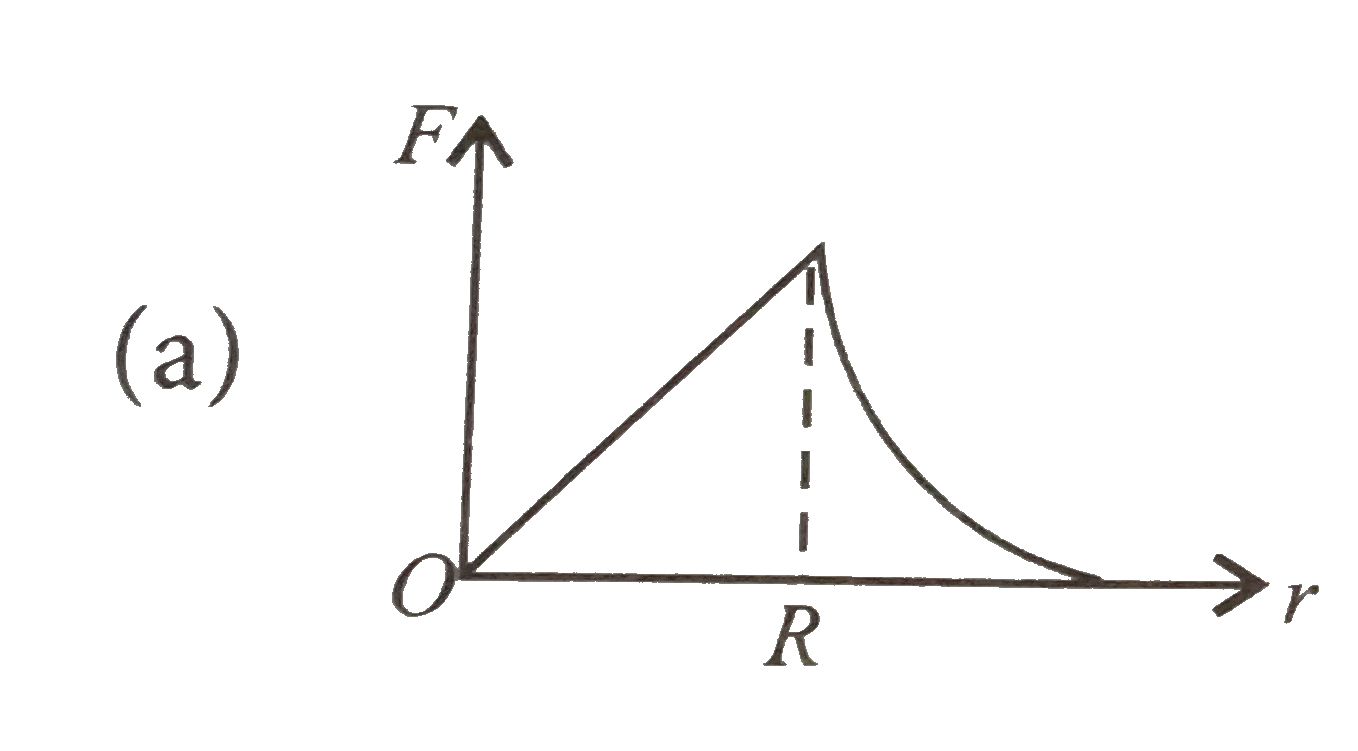 B
B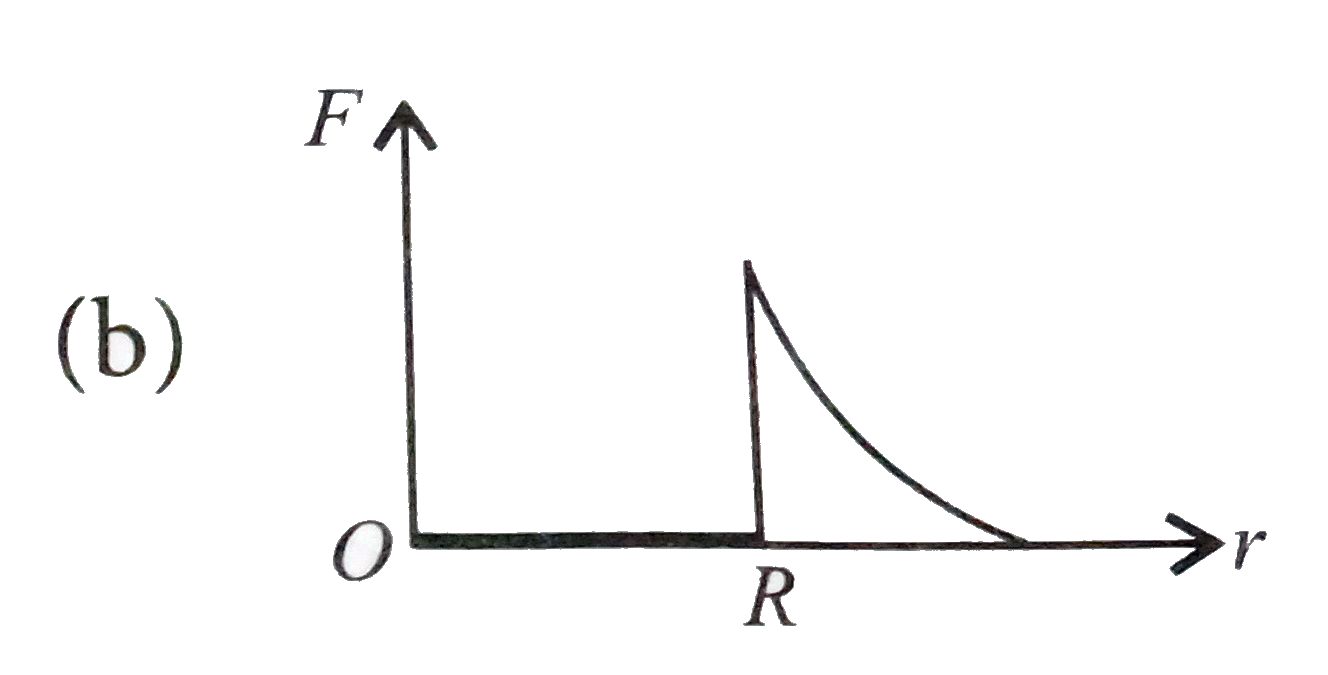 C
C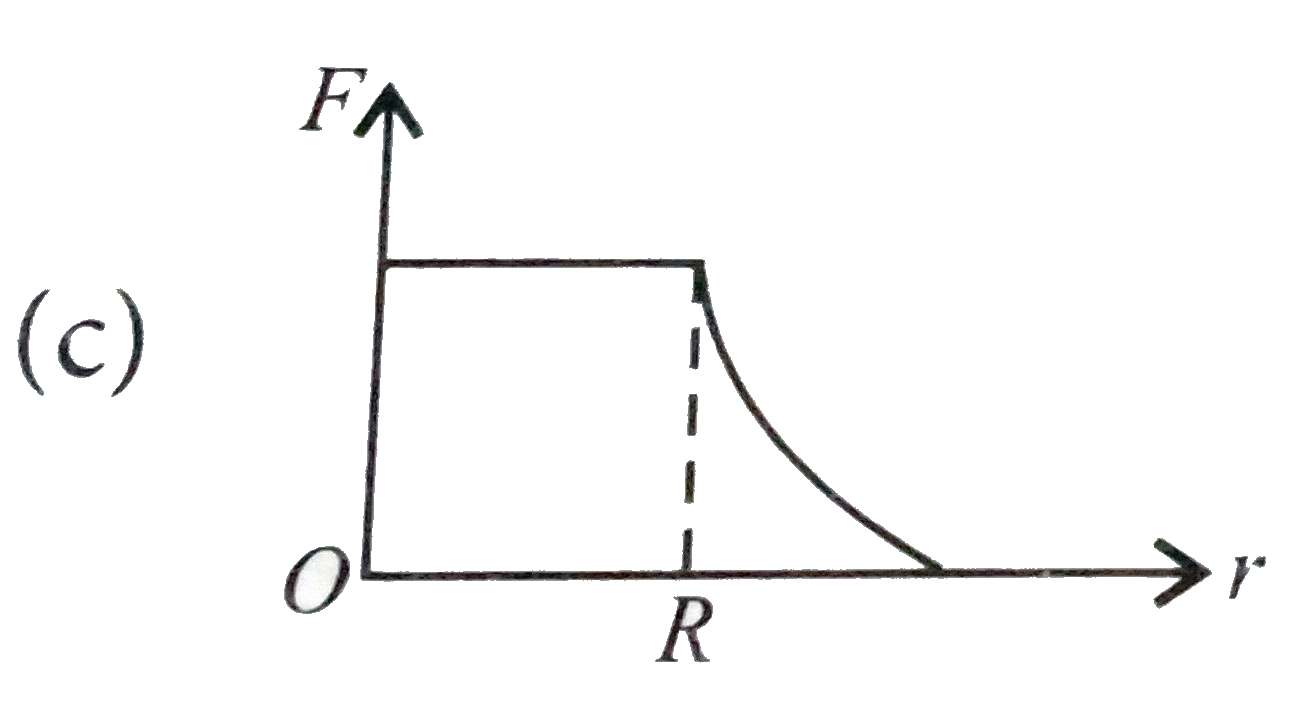 D
D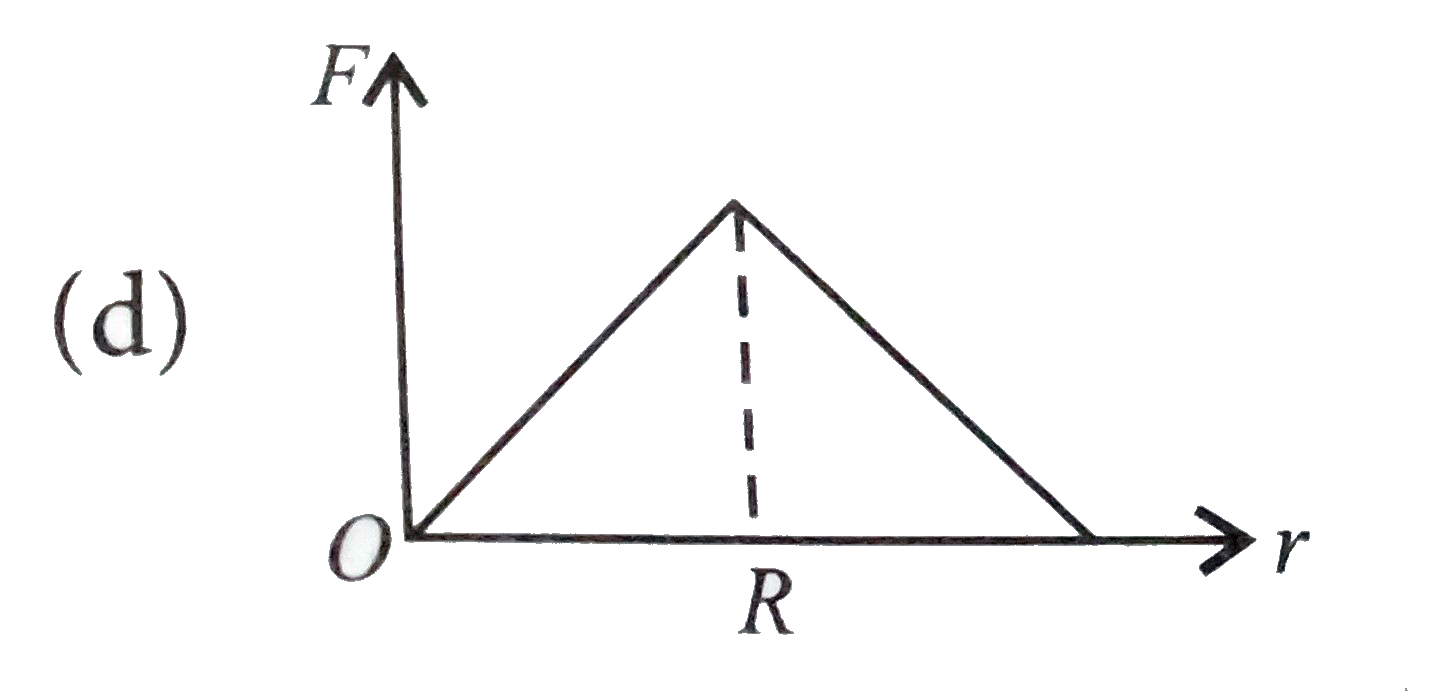
A thin spherical shell of radius R has charge Q spread uniformly over its surface. Which of the following graphs most closely represents the electric field E(r) produced by the shell in the range 0≤r<∞, where r is the distance from the centre of the shell?
View SolutionA thin spherical shell of radius R has charge Q spread uniformly over its surface. Which of the following graphs most closely represents the electric field E(r) produced by the shell in the range 0≤r<∞, where r is the distance from the centre of the shell?
View SolutionWhich one of the following plots represents the variation of the gravitational field on a particle with distance r due to a thin spherical shell of raduis R? (r is measured from the centre of the spherical shell).
View SolutionWhich one of t he following plots represents the variation of gravitational field of a particle with distance r due to thin spherical shell of radius R ?
View SolutionWhich of the following graph represents the variation of electric field E due to a thin charged spherical shell of radius R as a function of the distance r from the centre of the shell?
View Solution
