A thin spherical shell of radius R has charge Q spread uniformly over its surface. Which of the following graphs most closely represents the electric field E(r) produced by the shell in the range 0≤r<∞, where r is the distance from the centre of the shell?
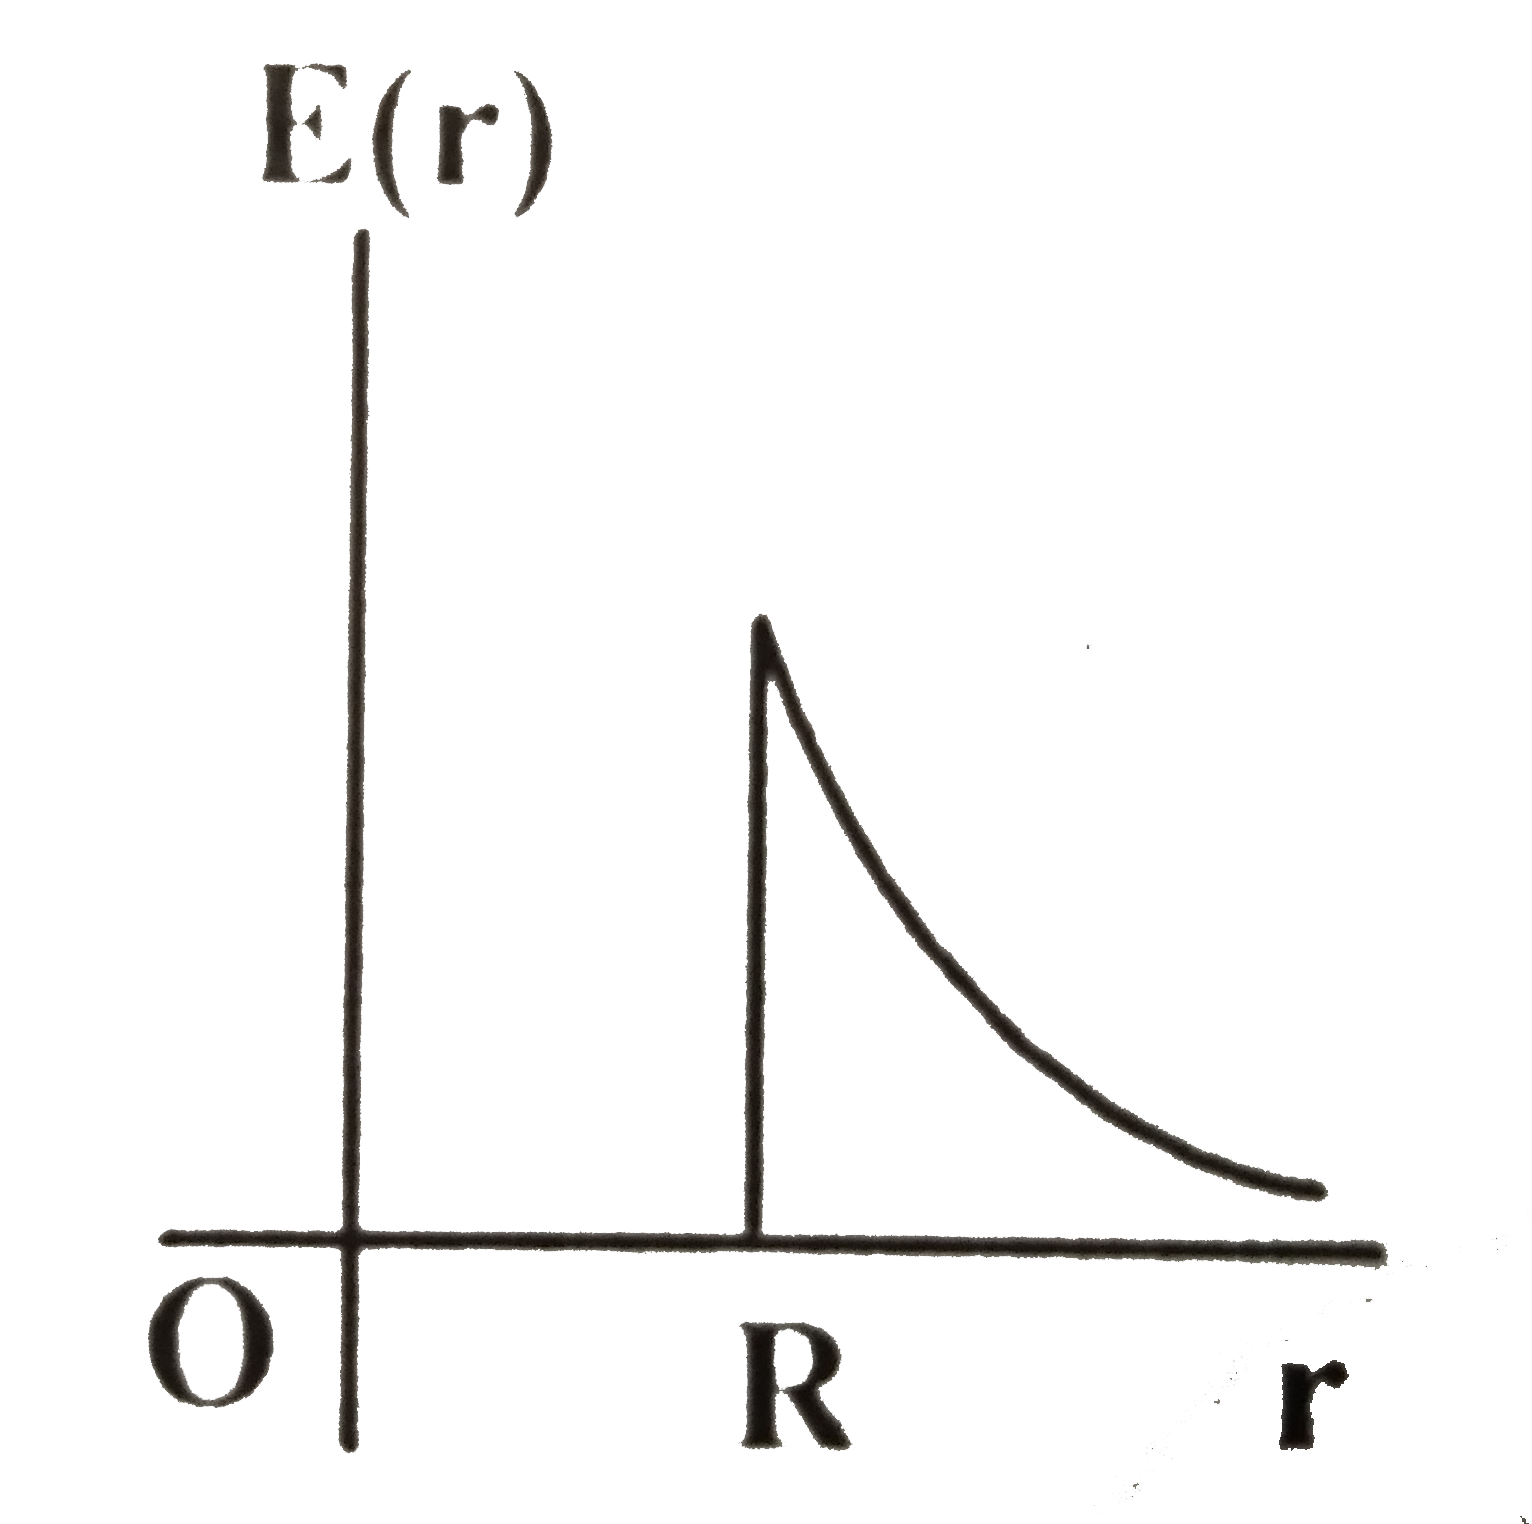
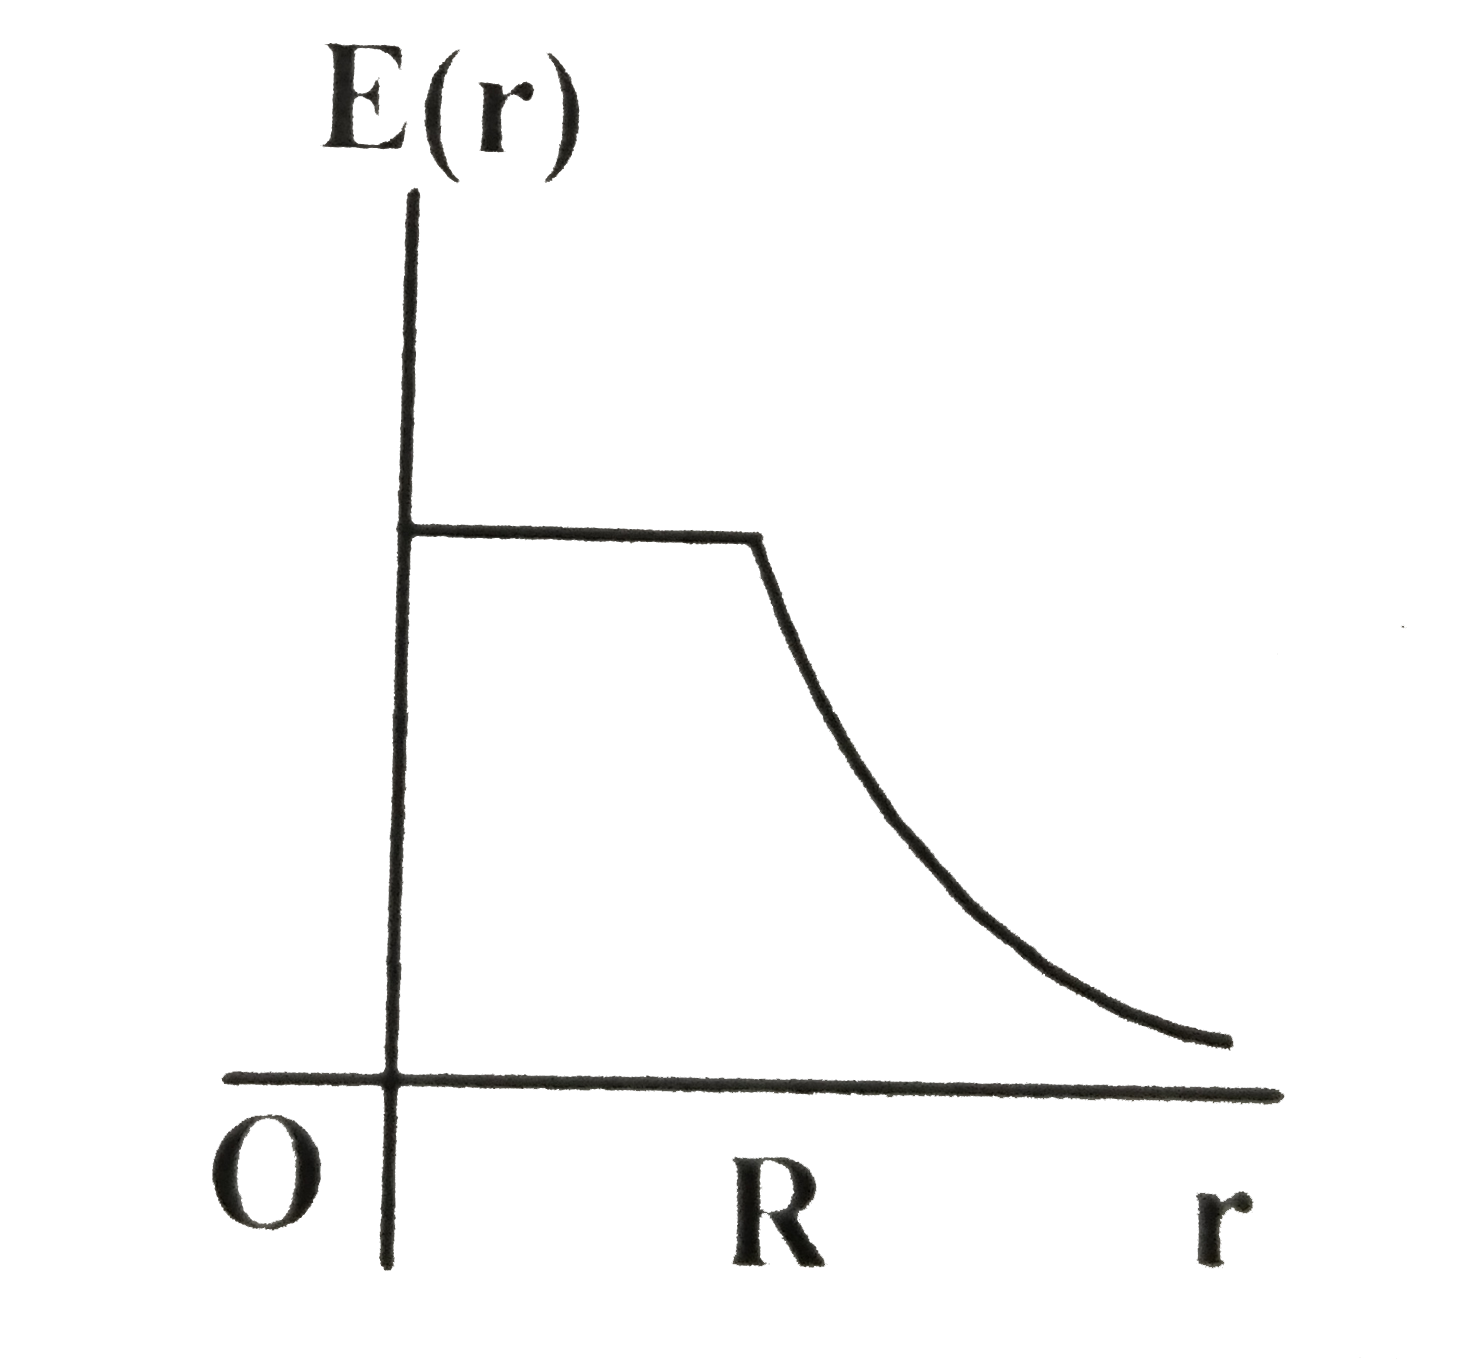
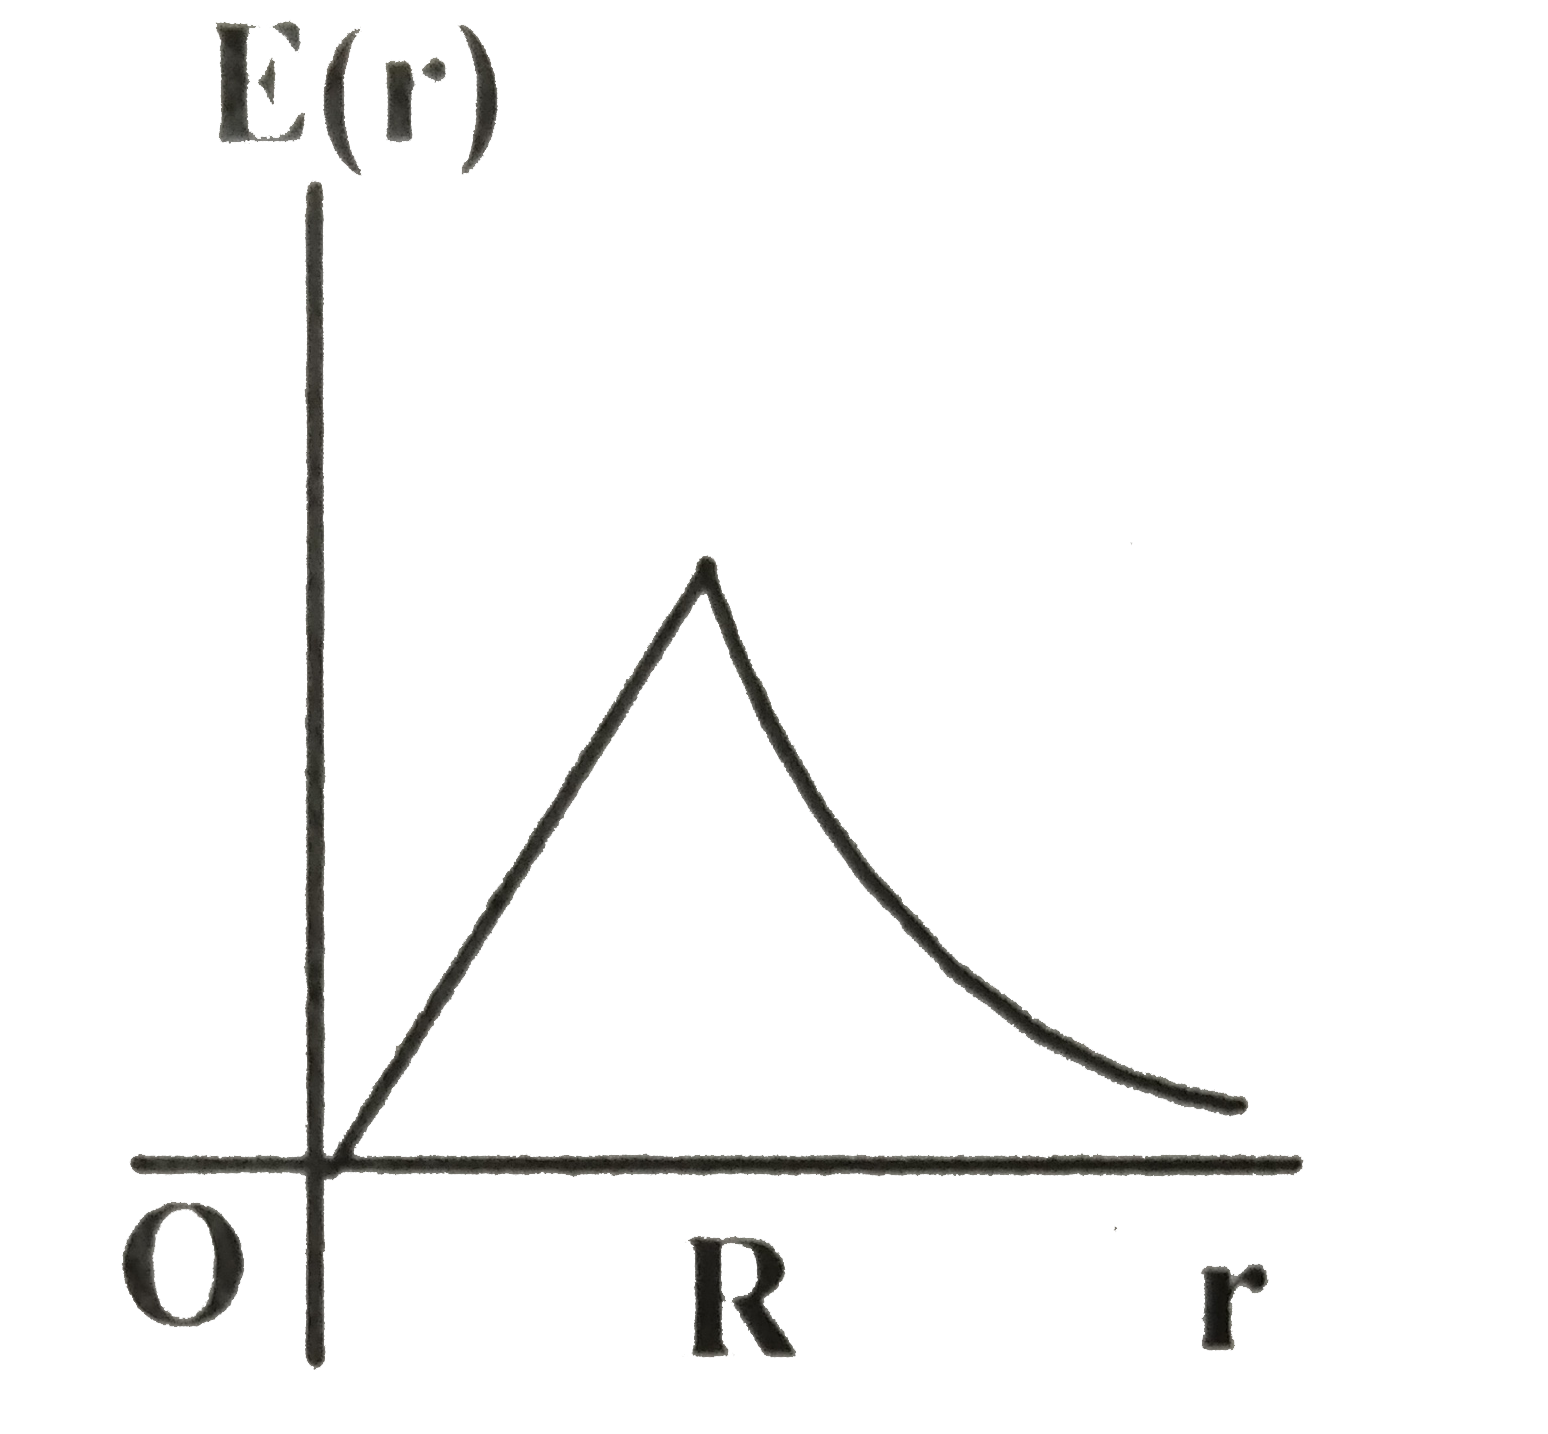
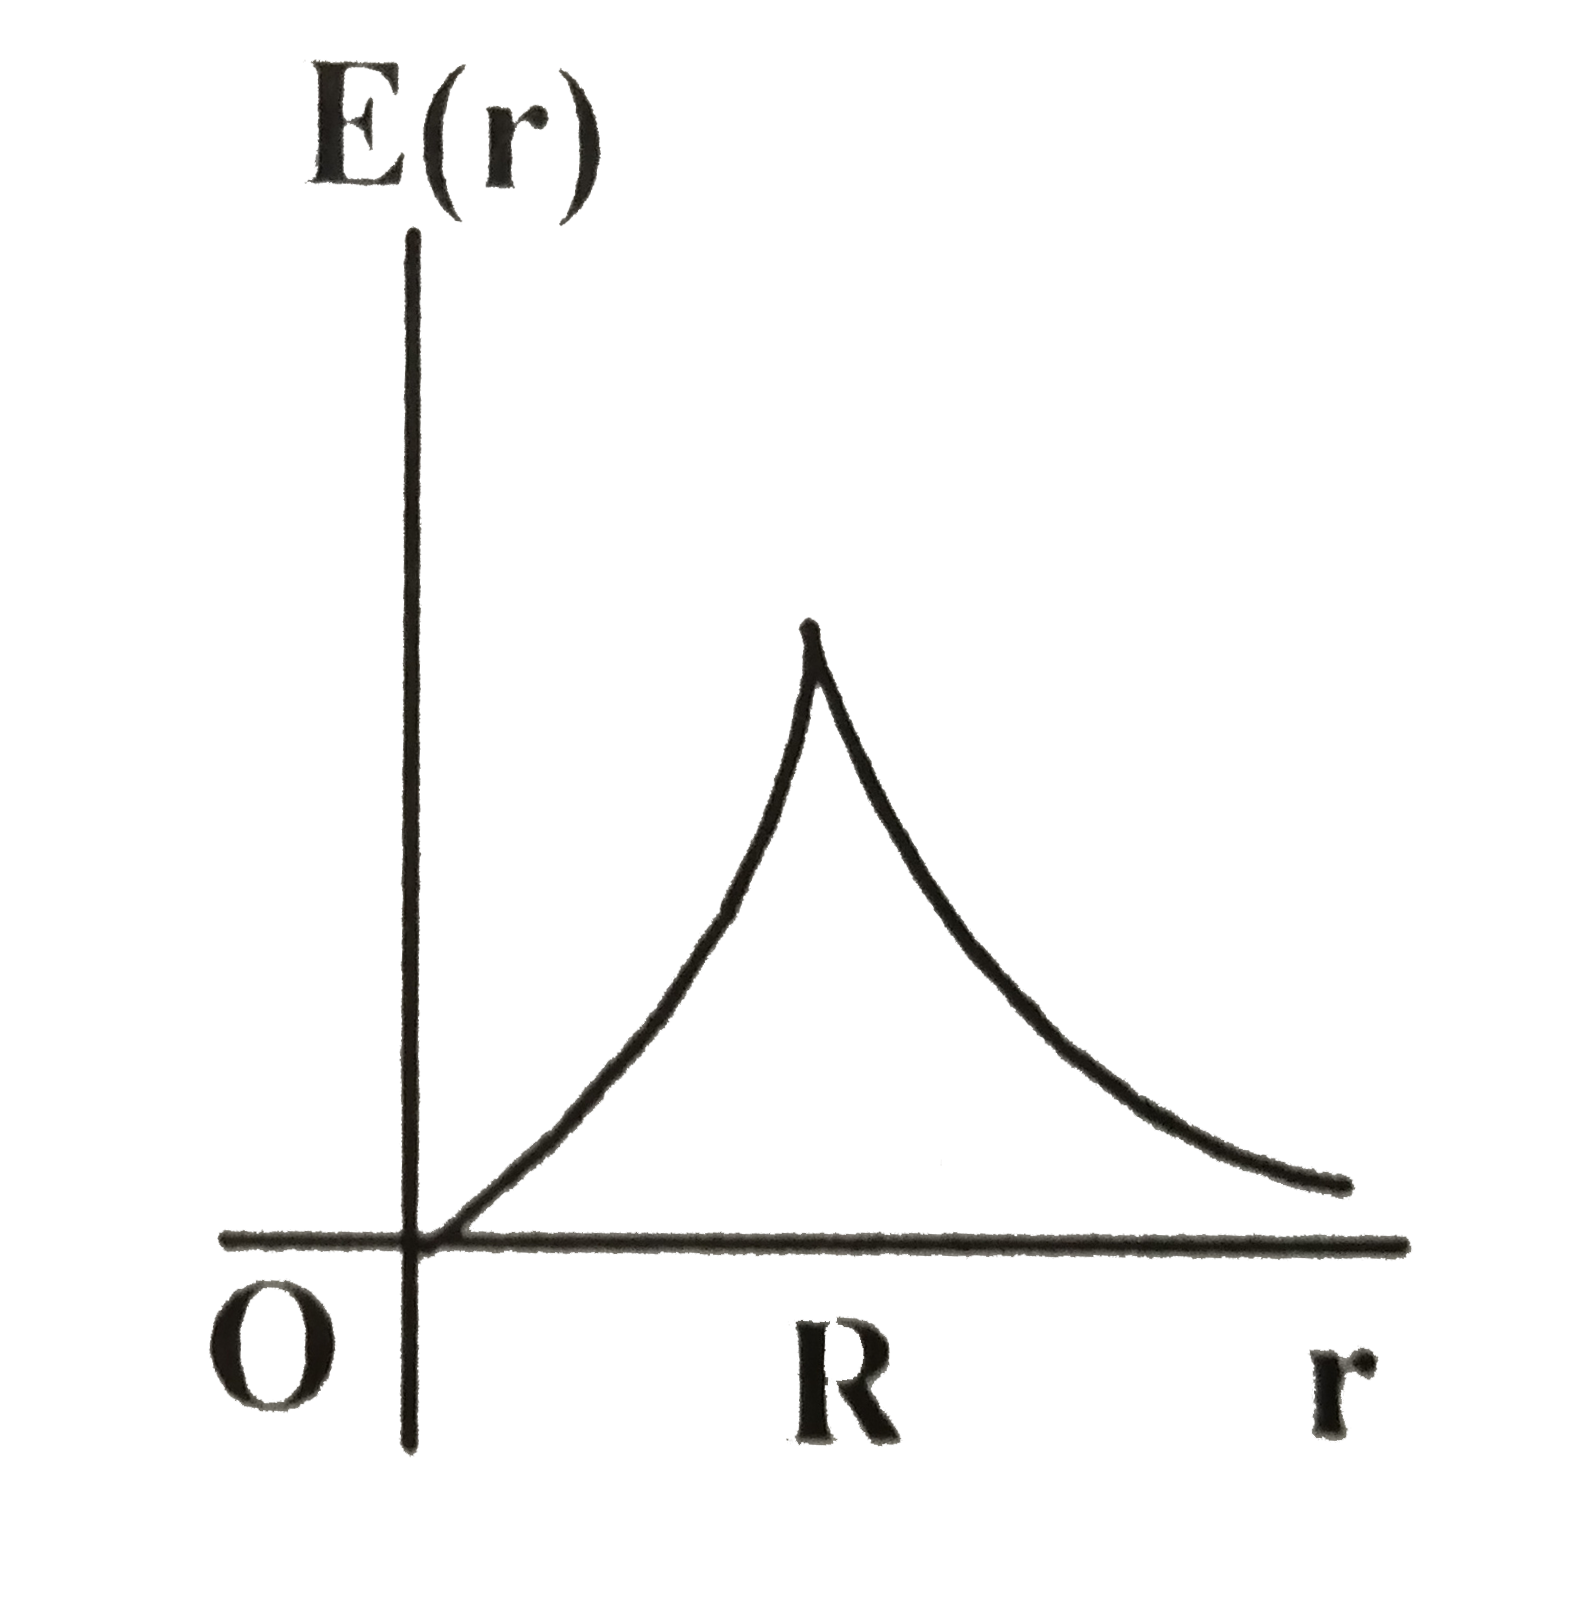
The correct Answer is:A
To solve the problem of determining the electric field E(r) produced by a thin spherical shell of radius R with charge Q uniformly spread over its surface, we can analyze the electric field in different regions relative to the shell.
1. Understanding the Shell's Charge Distribution:
- The charge Q is uniformly distributed over the surface of a thin spherical shell of radius R.
- Inside the shell (for r<R), there are no charges present.
2. Applying Gauss's Law Inside the Shell:
- According to Gauss's Law, the electric field E inside a uniformly charged shell is zero.
- Therefore, for 0<r<R:
E(r)=0
3. Analyzing the Electric Field Outside the Shell:
- For r>R, we can consider a Gaussian surface in the form of a sphere of radius r centered at the center of the shell.
- The total charge enclosed by this Gaussian surface is Q.
- By Gauss's Law:
∮→E⋅d→A=Qϵ0
- Since the electric field E is uniform over the surface of the sphere, we can write:
E⋅4πr2=Qϵ0
- Solving for E:
E(r)=Q4πϵ0r2
4. Graphing the Electric Field:
- From the analysis, we find that:
- For 0<r<R: E(r)=0
- For r≥R: E(r) decreases with 1/r2.
- This means the electric field is zero inside the shell and decreases as we move away from the shell.
5. Identifying the Correct Graph:
- The graph that represents this behavior will show:
- A flat line at E=0 for 0<r<R.
- A curve that decreases as r increases for r≥R.
Conclusion:
The graph that most closely represents the electric field E(r) produced by the shell is the one that shows E=0 for r<R and a decreasing curve for r≥R.
- The charge Q is uniformly distributed over the surface of a thin spherical shell of radius R.
- Inside the shell (for r<R), there are no charges present.
- According to Gauss's Law, the electric field E inside a uniformly charged shell is zero.
- Therefore, for 0<r<R:
E(r)=0
- For r>R, we can consider a Gaussian surface in the form of a sphere of radius r centered at the center of the shell.
- The total charge enclosed by this Gaussian surface is Q.
- By Gauss's Law:
∮→E⋅d→A=Qϵ0
- Since the electric field E is uniform over the surface of the sphere, we can write:
E⋅4πr2=Qϵ0
- Solving for E:
E(r)=Q4πϵ0r2
- From the analysis, we find that:
- For 0<r<R: E(r)=0
- For r≥R: E(r) decreases with 1/r2.
- This means the electric field is zero inside the shell and decreases as we move away from the shell.
- The graph that represents this behavior will show:
- A flat line at E=0 for 0<r<R.
- A curve that decreases as r increases for r≥R.
The graph that most closely represents the electric field E(r) produced by the shell is the one that shows E=0 for r<R and a decreasing curve for r≥R.
Topper's Solved these Questions
Similar Questions
A spherical shell of radius R has a uniformly distributed charge ,then electric field varies as
View SolutionA metallic spherical shell of radius R has a charge -Q on it. A point charge +Q is placed at the centre of the shell. Which of the graphs shown below may correctly represent the variation of electric field E with distance r from the centre of shell ?
View SolutionConisder a thin spherical shell of radius R with centre at the origin, carrying uniform poistive surface charge denisty. The variation of the magnitude of the electric field ∣∣→E(r)∣∣ and the electric potential V(r) with the distance r from the centre, is best represented by which graph?
View SolutionWhich one of the following graphs represents the variation of electric field with distance r from the centre of a charged spherical conductor of radius R?
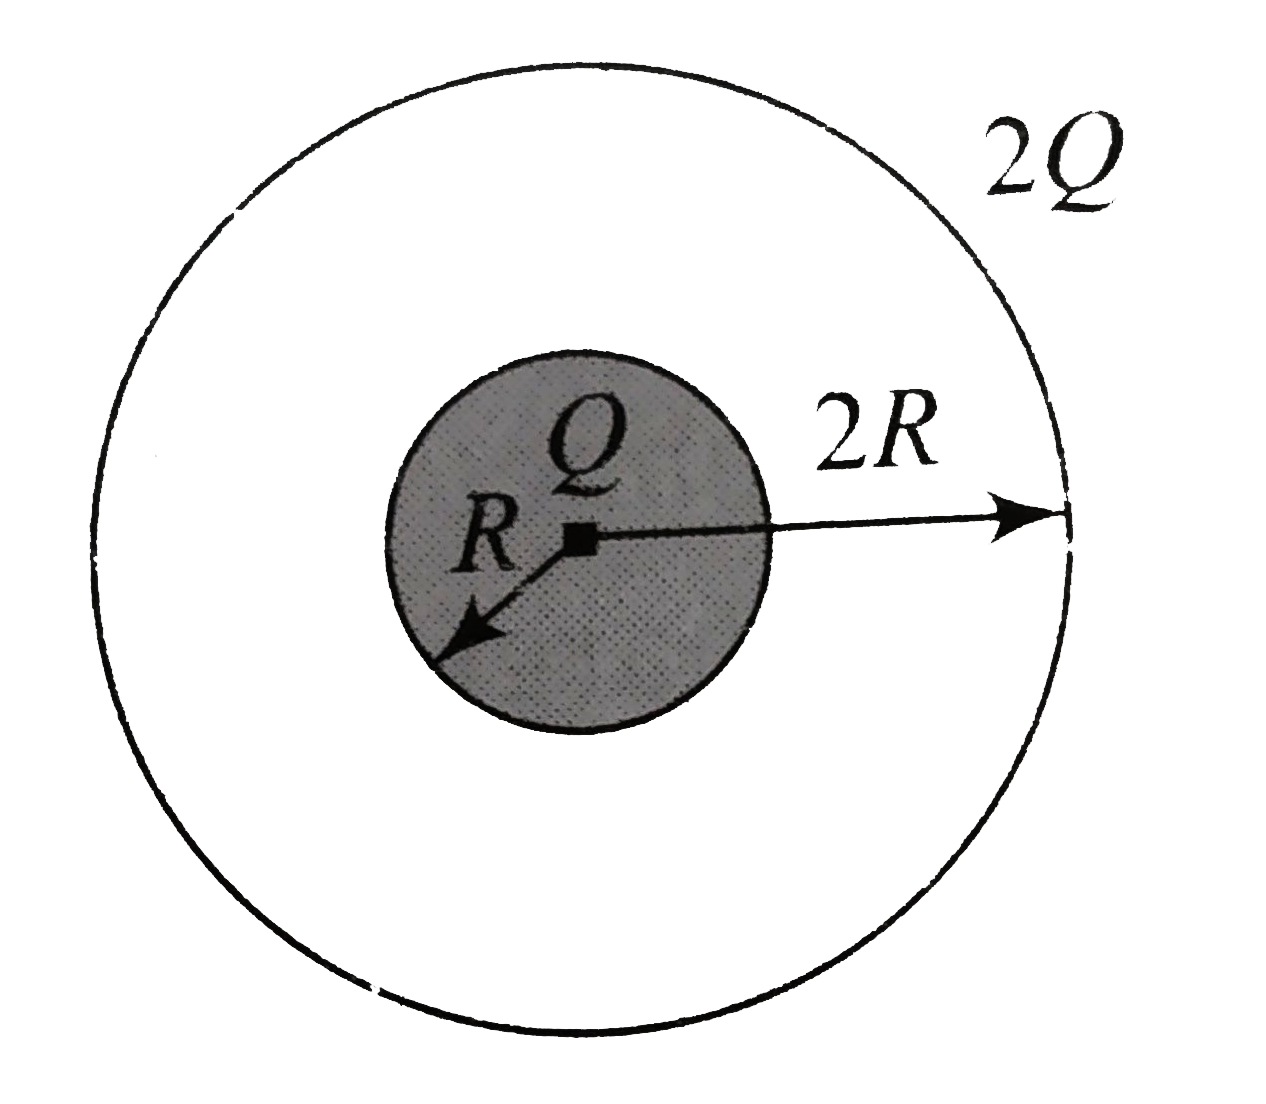
View SolutionA charge Q is uniformly distributed in a dielectric sphere of radius R (having dielectric constant unity). This dielectric sphere is enclosed by a concentric spherical shell of radius 2R and having uniformly distributed charge 2Q. Which of the following graph correctly represents variation of electric field with distance r from the common centre?
View SolutionFind the gravitational potential due to a spherical shell of mass M and radius R at r<R and r>R, where r is the distance from the centre of the shell.
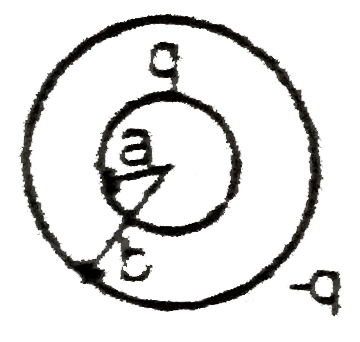
View SolutionFigure shows two concentric shells of radii a and b uniformly distributed charges q and -q. Which of the following graphs gives correct variation of electric field intensity E with the distance r from the centre?
View SolutionConsider the force F on a charge 'q' due to a uniformlycharged spherical shell of radius R carrying charge Q distributed uniformly over it. Which one of the following statements is true for F, if 'q' is placed at distacen r from the centre of the shell?
View SolutionA spherical shell made of plastic, contains a charge Q distributed uniformly over its surface. What is the electric field inside the shell? If the shell is hammered to deshape it without altering the charge. Will the field inside be changed? What happend if the shell is made of a metal?
View SolutionA spherical shell of radius R carries a uniformly distributed charge q. The electrical forces arising cause the ex-pansion of the shell. Find the mechanical stress in the shell.
View Solution
