When two plants L and M were exposed to different light intensities and temperature they showed changes in their rates of photosynthesis. Which have been represented in the following graph.
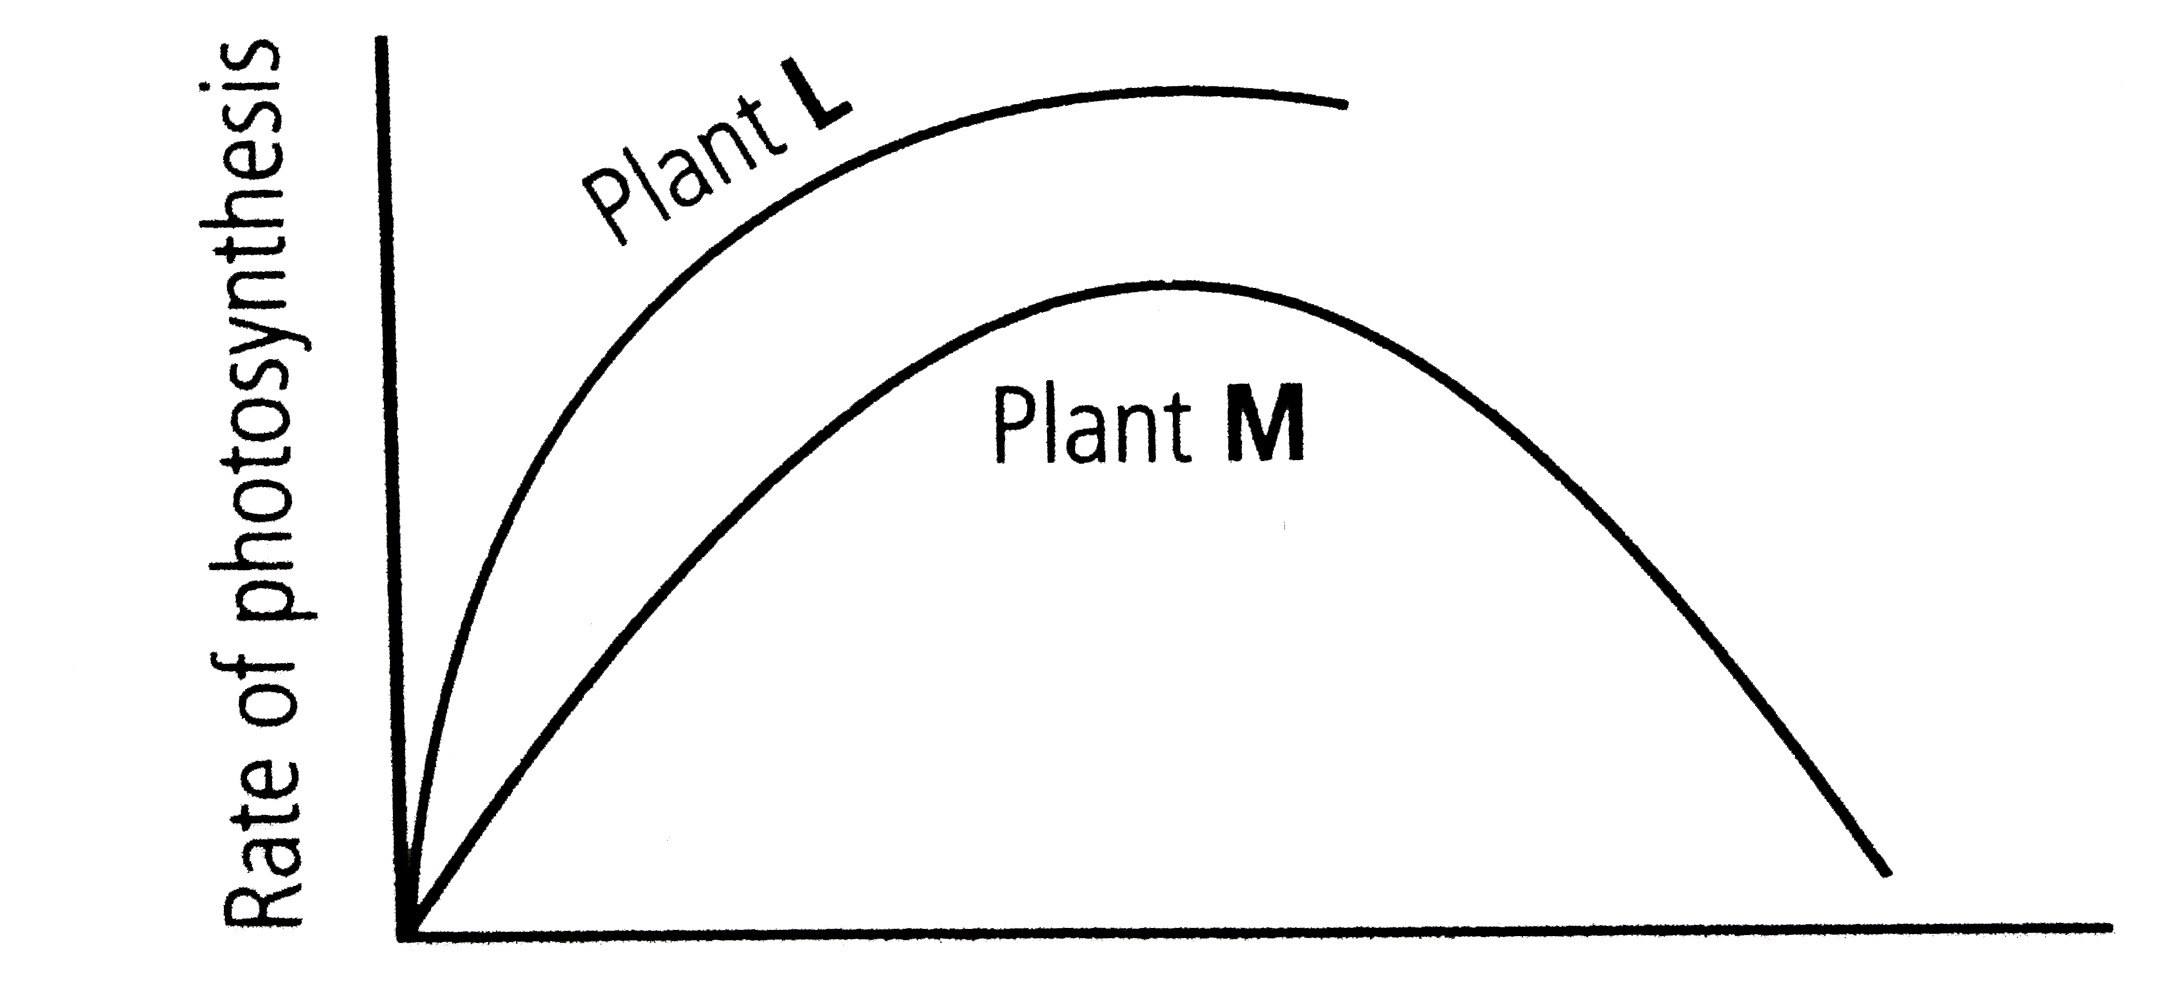
The graph indicates that
Plant L is a plant for which the light saturation point is 100% of full sunlight
Plant M is a plant for which the optimum temperature s around
Plant M is a plant which is more affected at higher temperature and higher light intensity as compared to palnt L
plant L is a plant and cannot function at light intensities above the saturation point.
The correct Answer is:C
The light intensity at which a plant can achive maximum rate of photosynthesis is called as light saturation point. Its value is 50-70% full sunlight in sun plants and upto 200% of full sunlight in sun plants (e.g., sugarcane). Beyond satruation point (it is seldom relaised in nature in sun plants). the rate of photosynthesis begins to decline. Optimum temperature at which the rate of photsynthesis is maximum is for plants and for plants. Thus, it is clear that in the given graph, plant L is a plant and plant M is a plant.
Topper's Solved these Questions
- PHOTOSYNTHESIS IN HIGHER PLANTSBook:NCERT FINGERTPS ENGLISHChapter:PHOTOSYNTHESIS IN HIGHER PLANTSExercise:Photosynthesis In Higher Plants
Explore 136 Videos
- NEURAL CONTROL AND COORDINATIONBook:NCERT FINGERTPS ENGLISHChapter:NEURAL CONTROL AND COORDINATIONExercise:All Questions
Explore 144 Videos
- PLANT GROWTH AND DEVELOPMENTBook:NCERT FINGERTPS ENGLISHChapter:PLANT GROWTH AND DEVELOPMENTExercise:Plant Growth And Development
Explore 154 Videos
Similar Questions
Knowledge Check
Study the given graph showing the efect of light intensity on the rate of photosynthesis. Which of the following statemetns regarding this is correct?
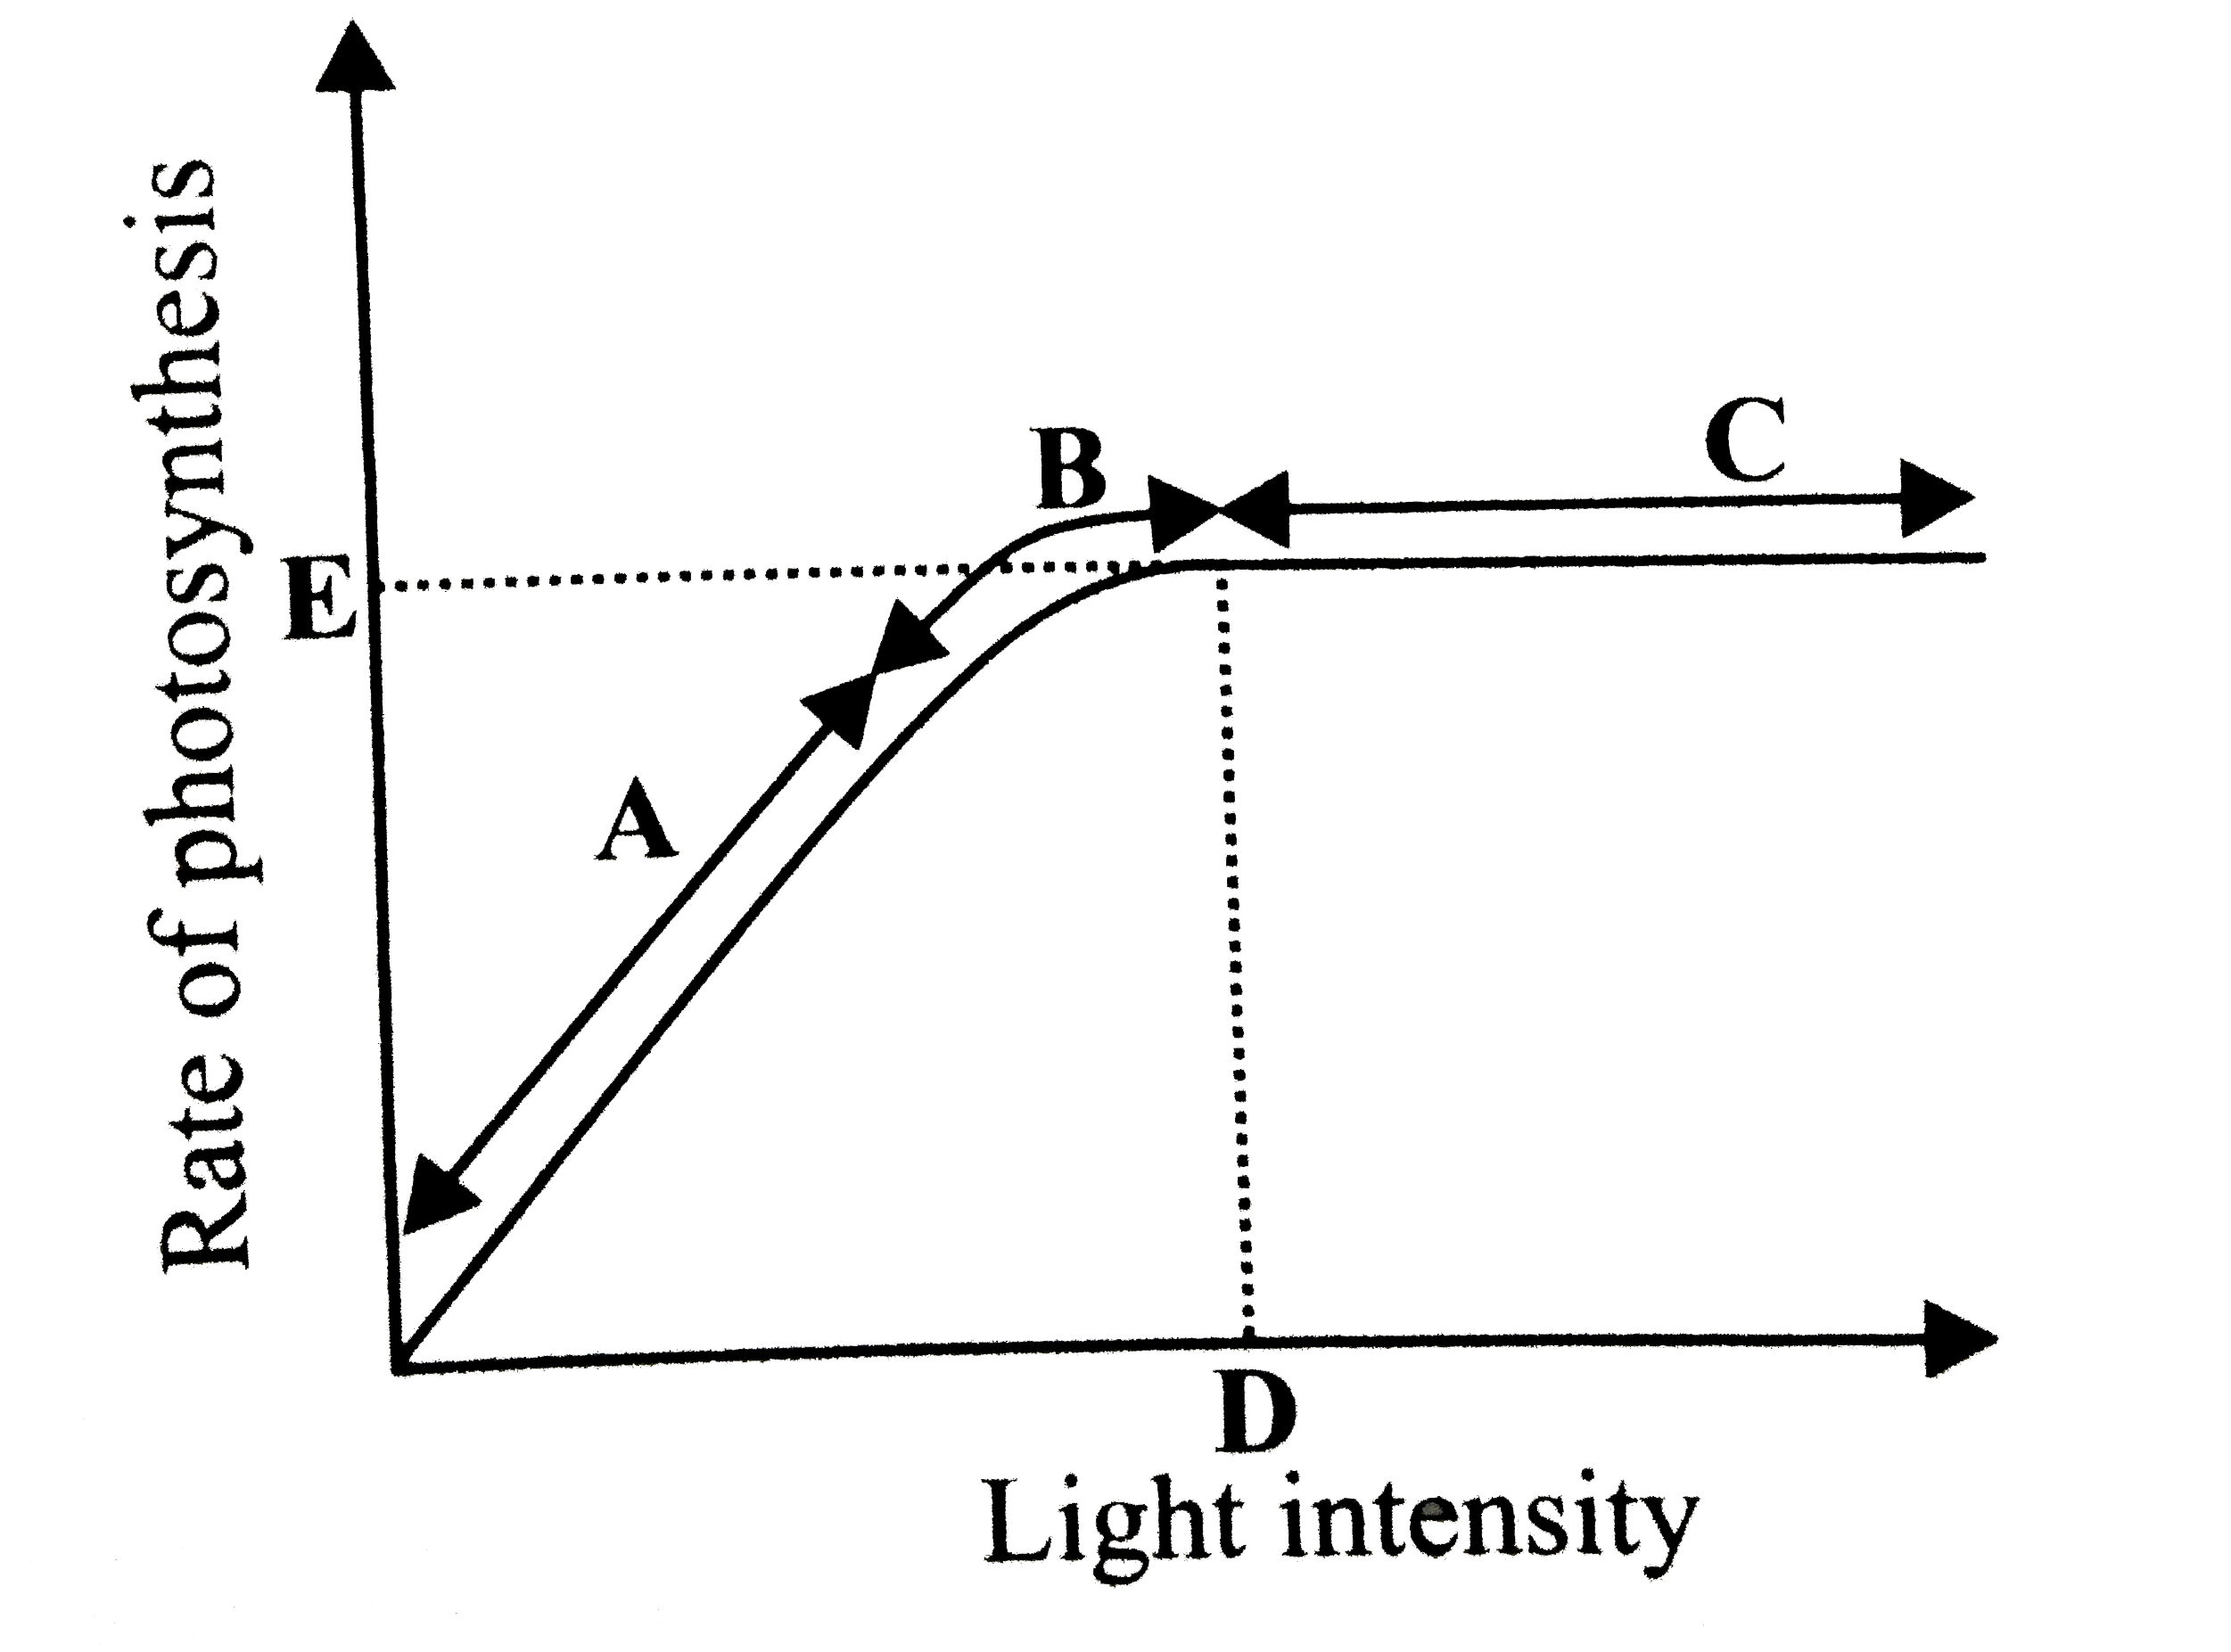 ALight is a limiting factor in the region a.BRegion C represents that rate of photosynthesis is because some other factor became limiting.Cpoint D rrepresents the intensity of light at which some other factor became limitingDAll of these
Which of the following graphs correctly depicts the rate of photosynthesis of sun plant (P) and shade plant (Q)?
A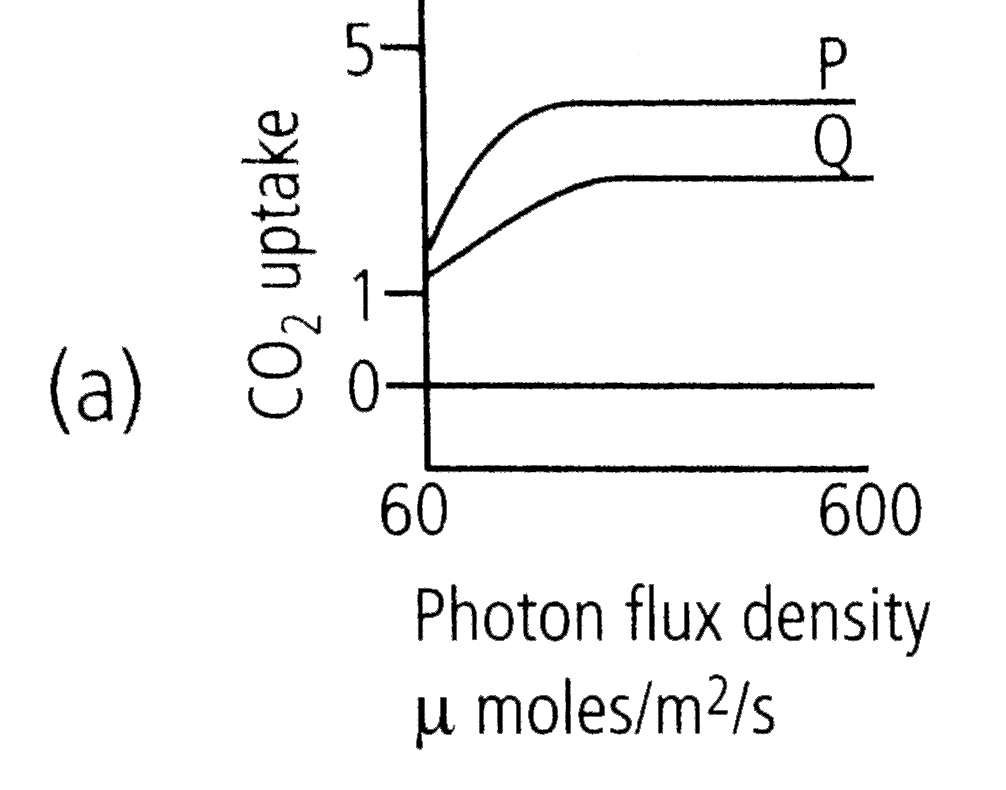 B
B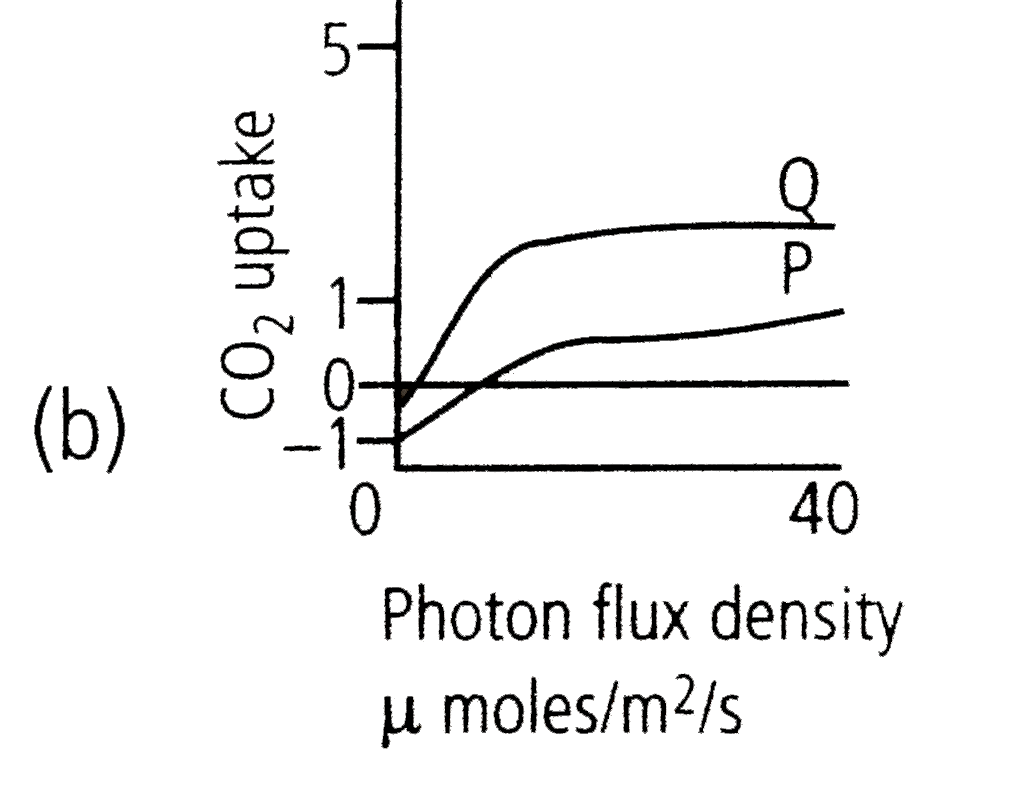 C
C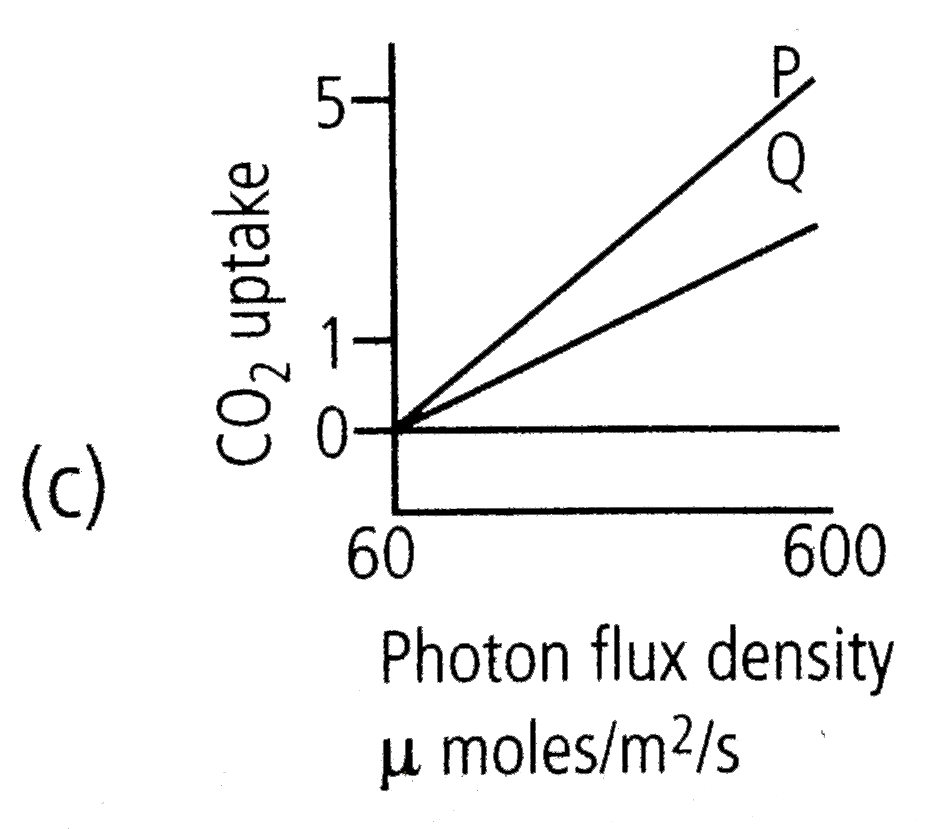 D
D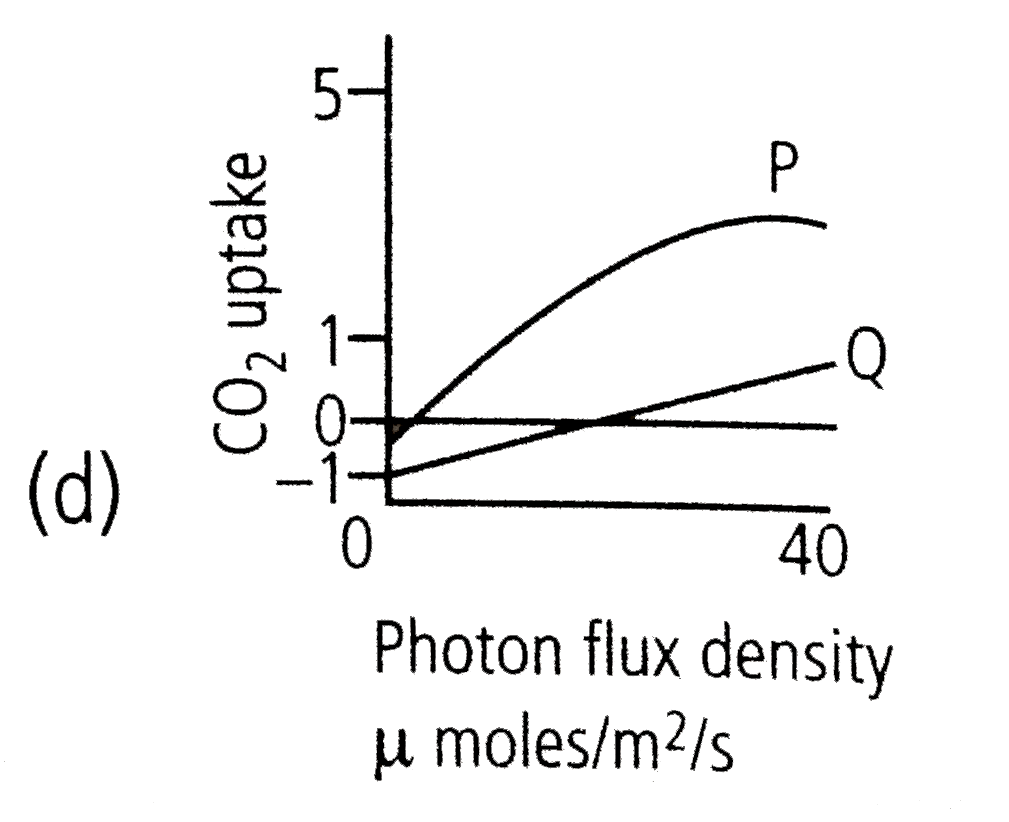
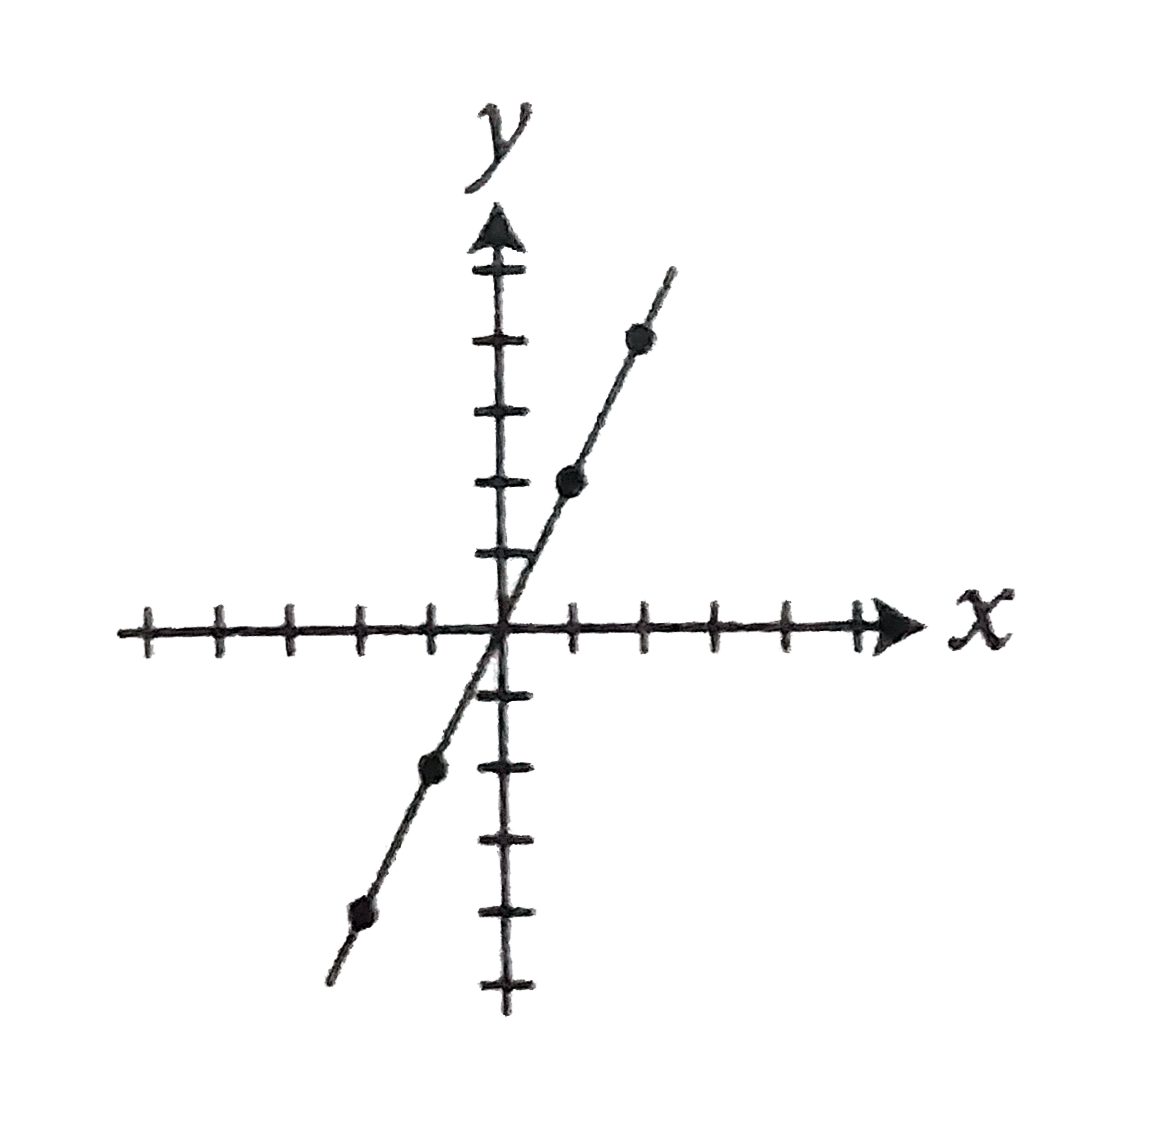
The graph above shows y=2x. Which of the following graphs represents y=|2x|?A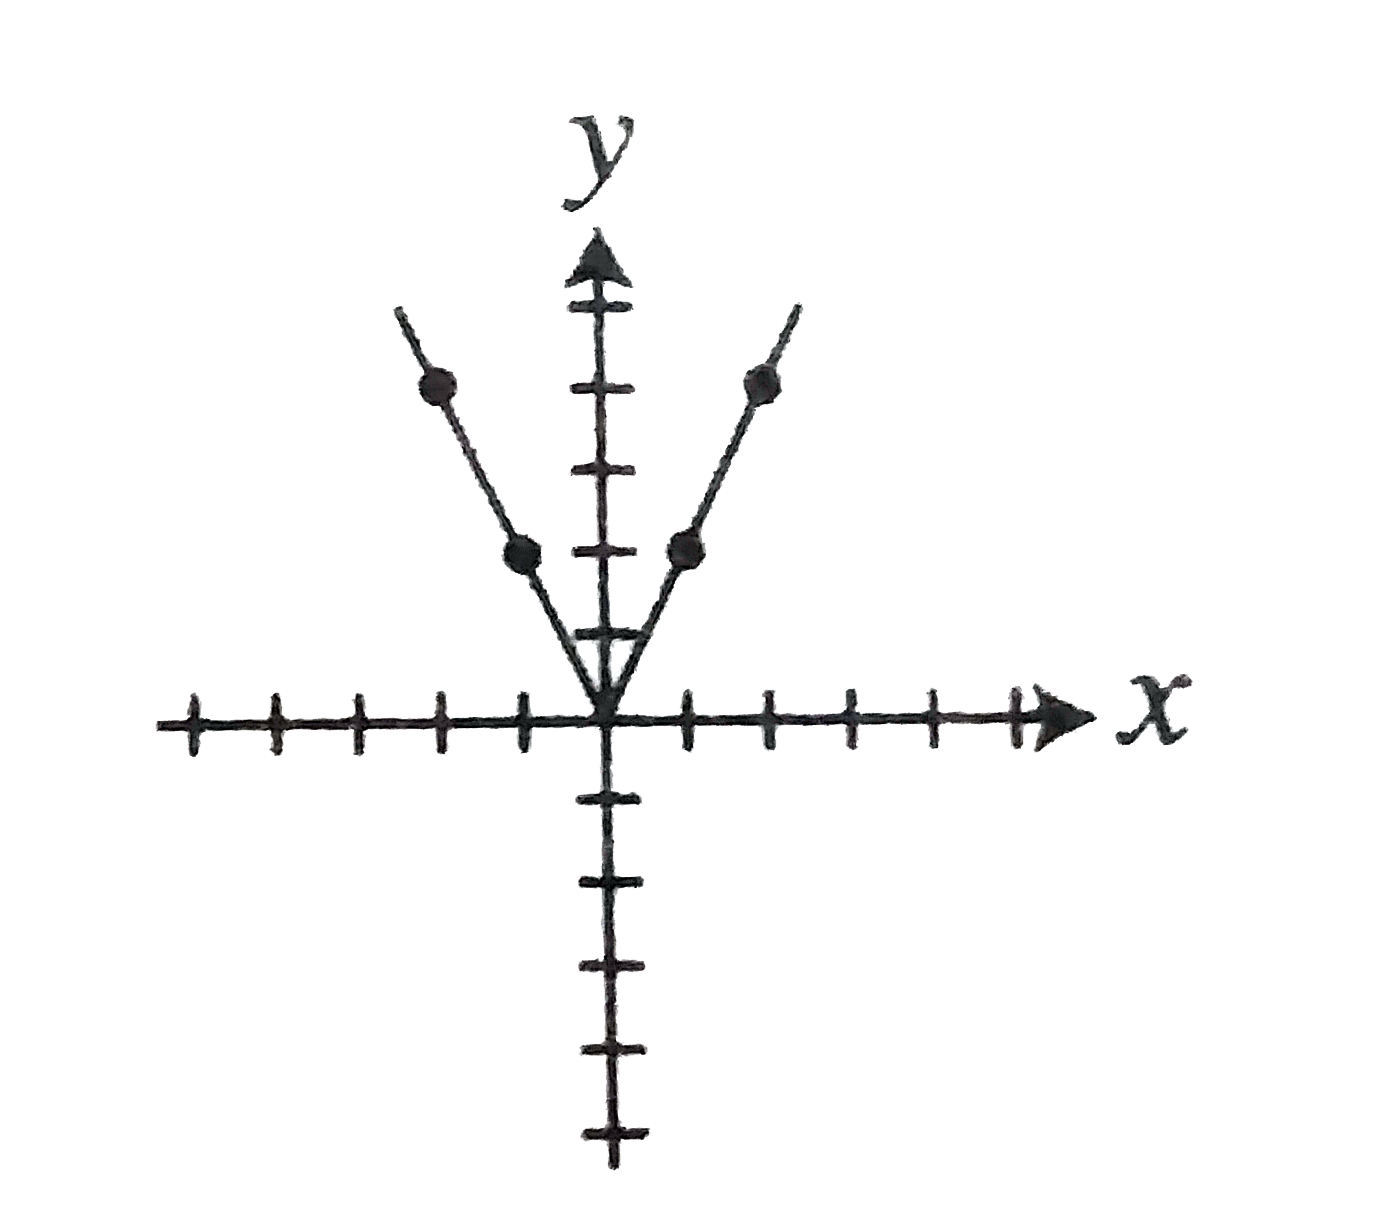 B
B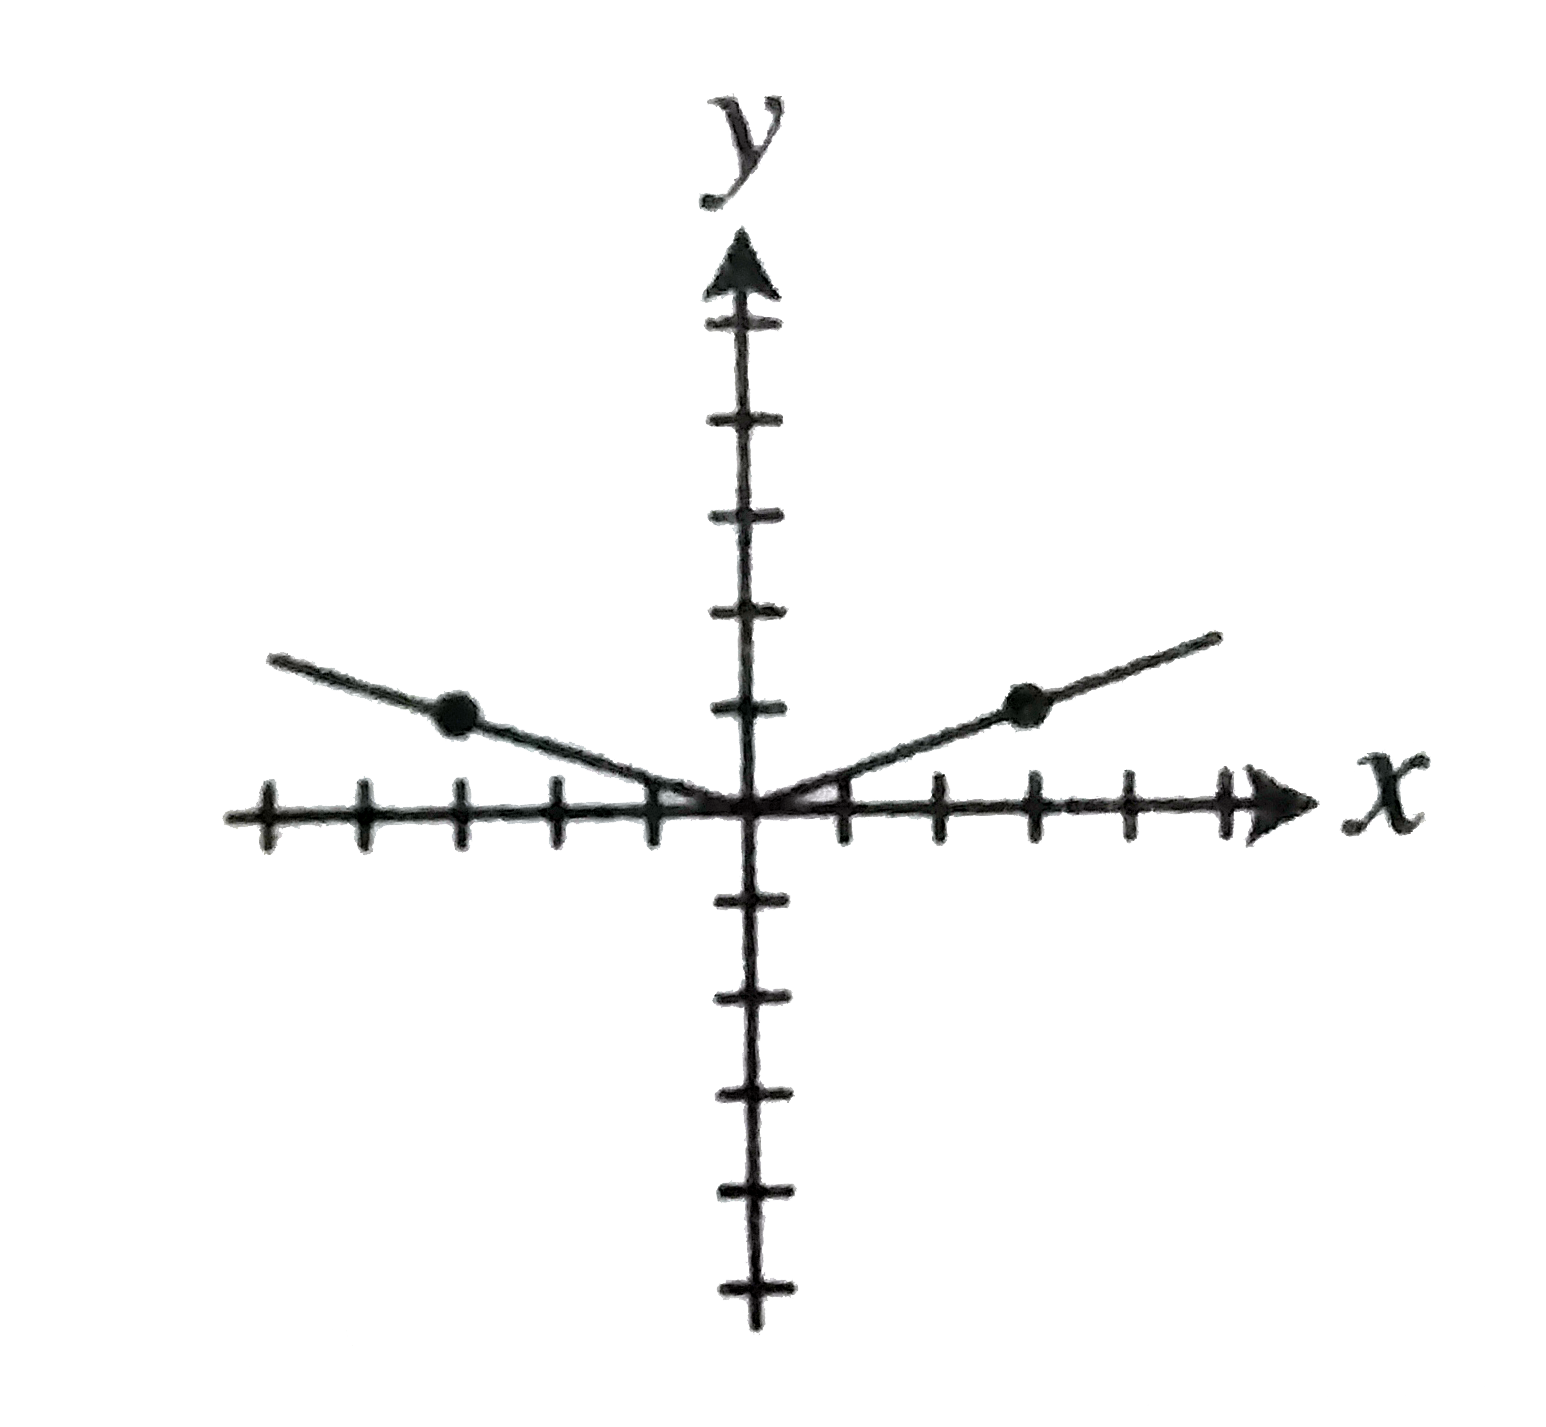 C
C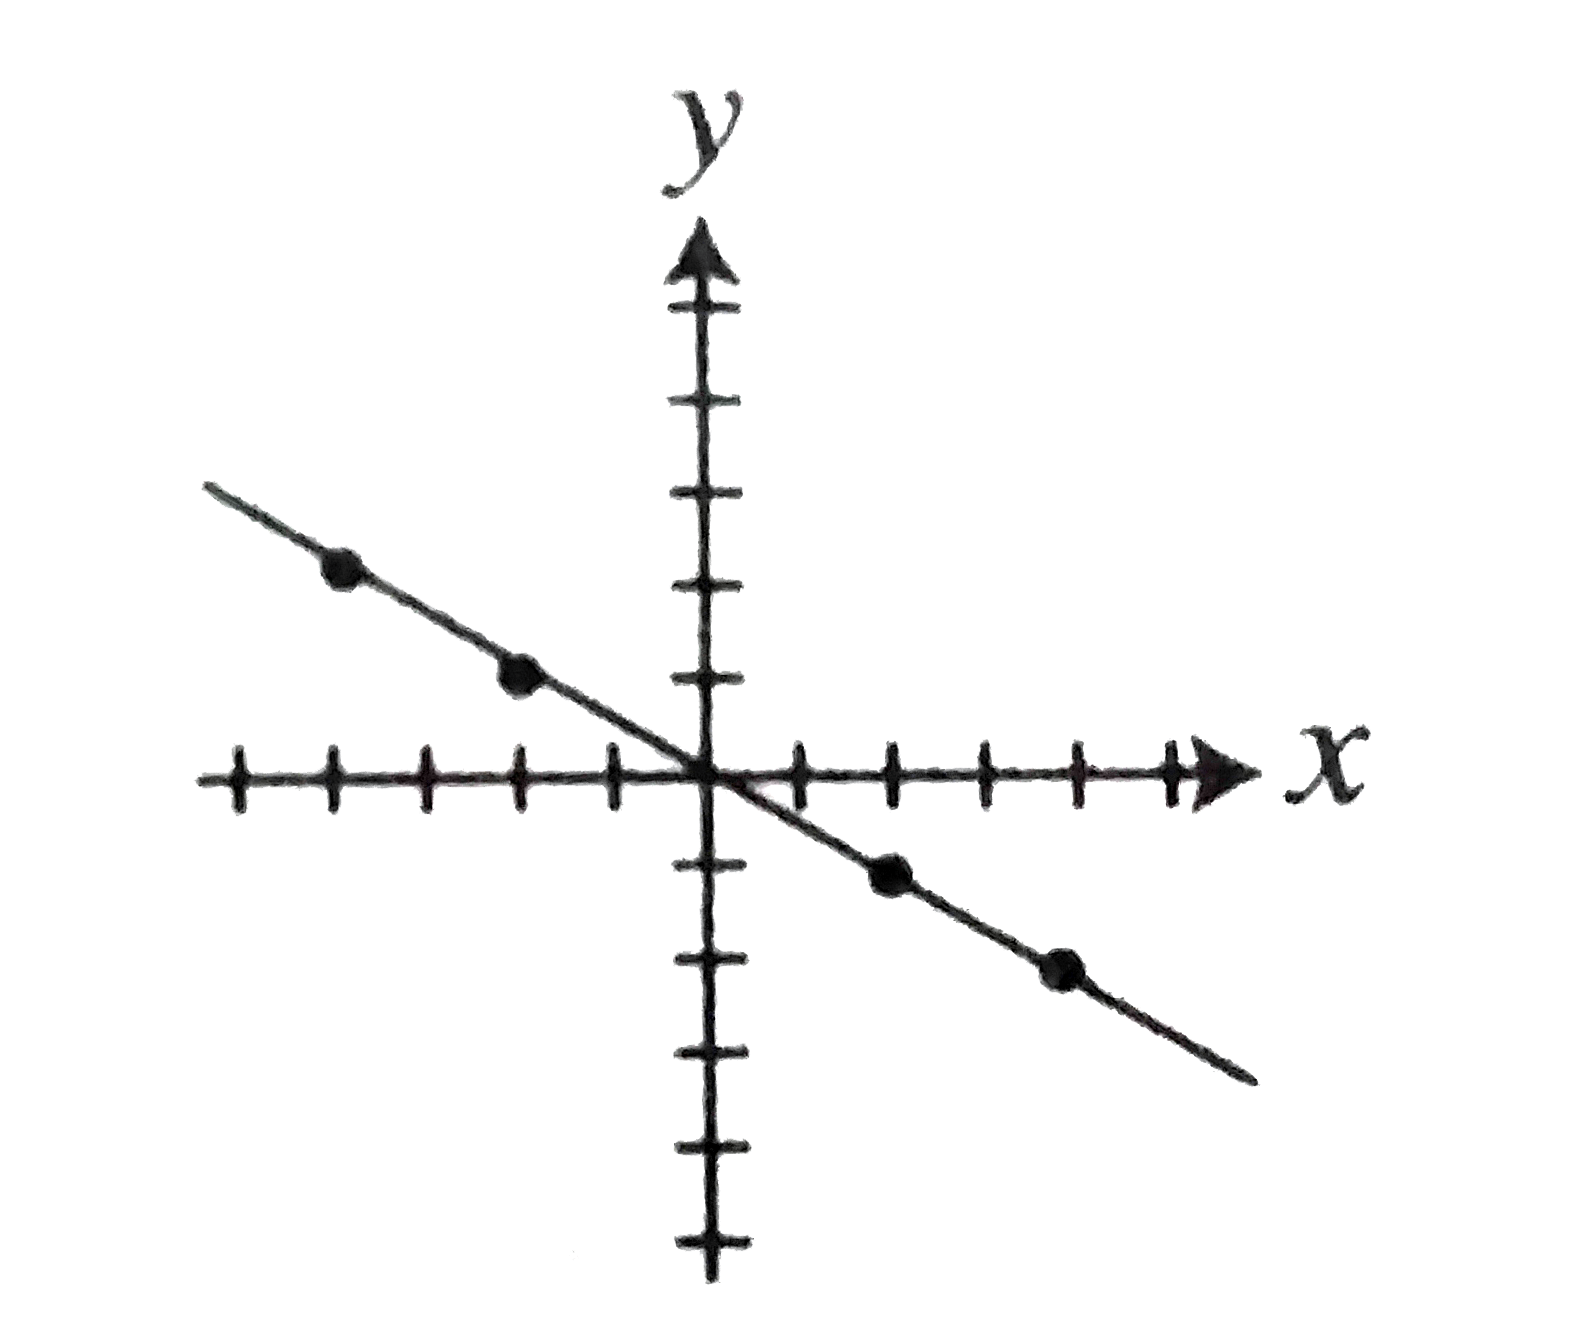 D
D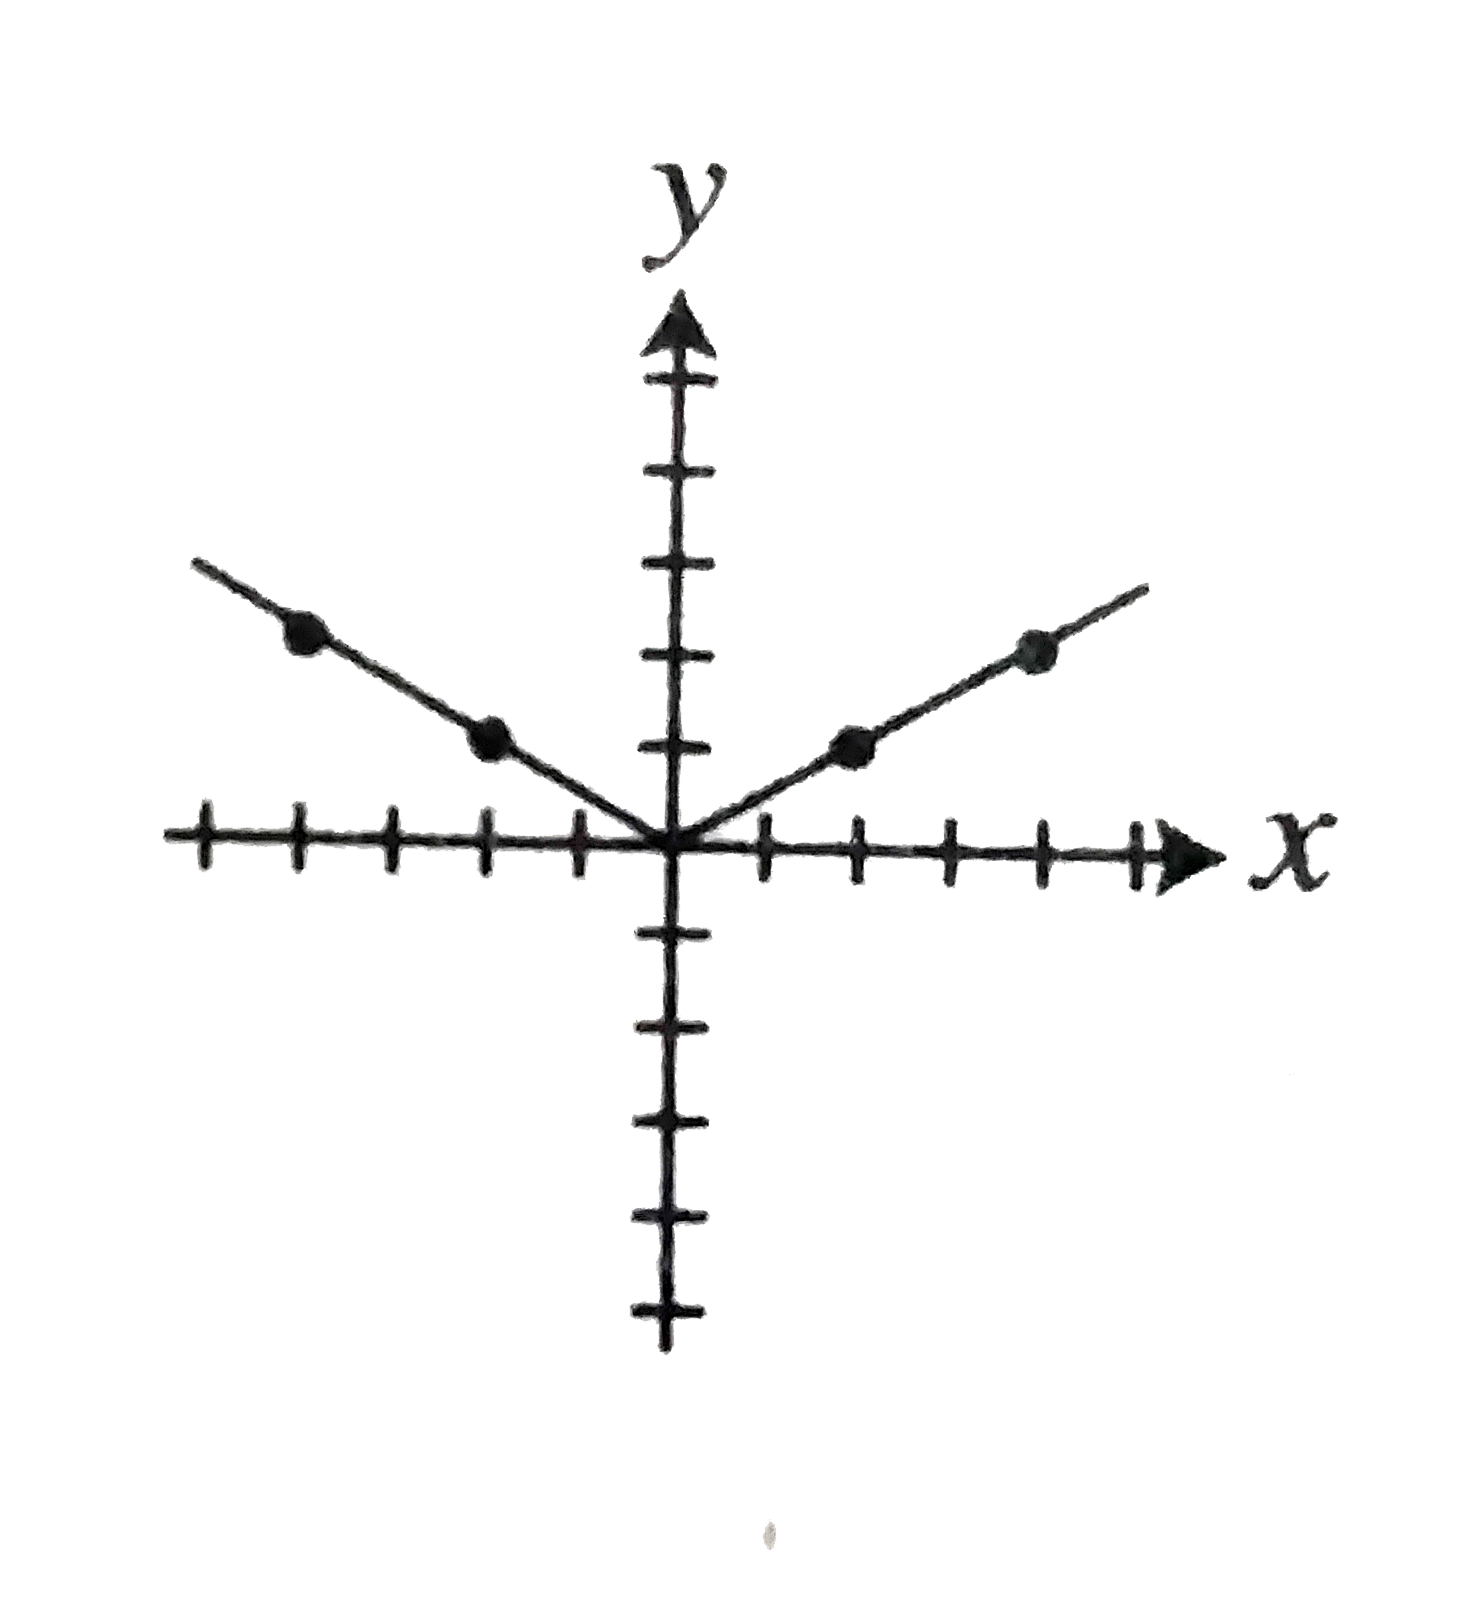
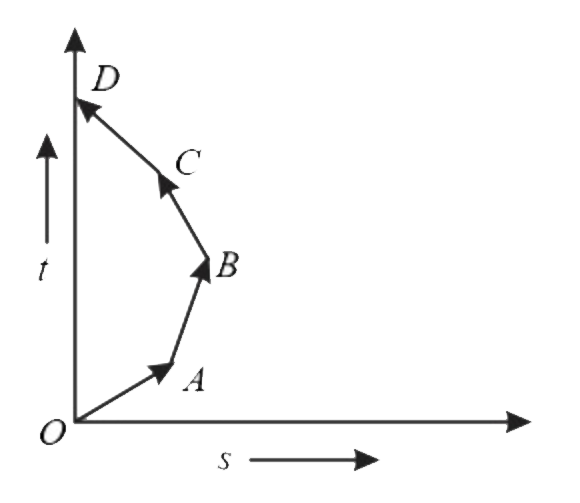
Which of the following options is correct for the object having a straight line motion represented by the following graph ?
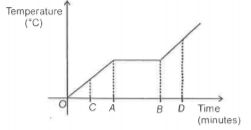
View SolutionFor the following temperature-time graph, in which region the state of material changes
View SolutionObserve the given graph carefully and choose the correct statements for labelled points, (A to E)
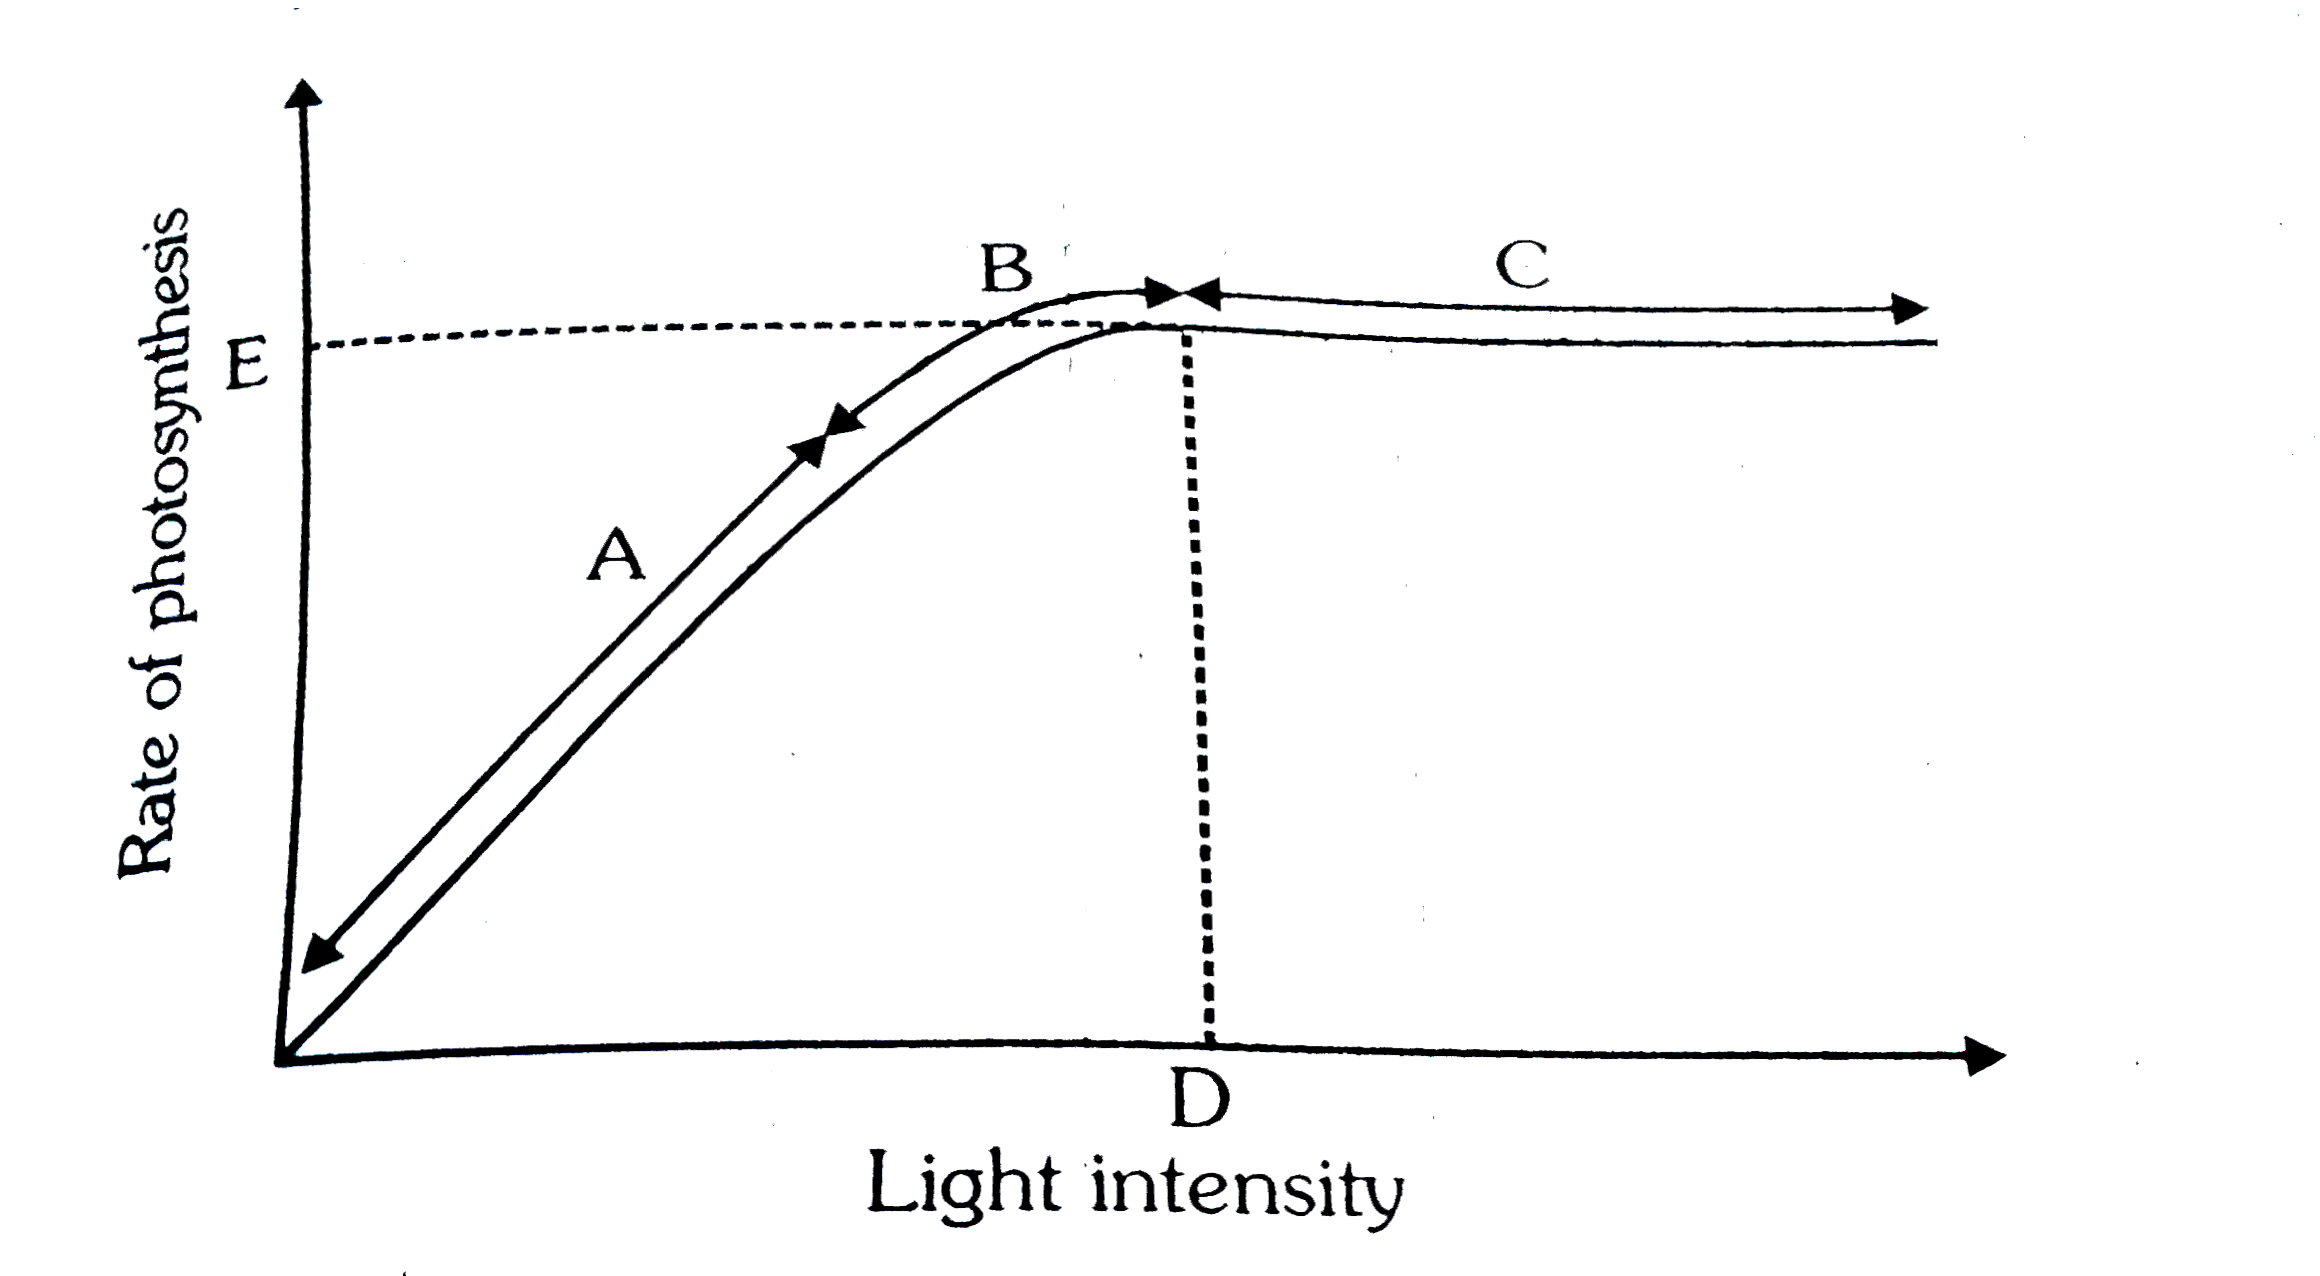 Points:-
(A)- There is a linear relationship between incident light and CO2 fixation rates.
(B)- It is a transition poit where limiting factor changes.
(C)- At this region light intensity is not showing detrimental effect on rate of photosynthesis.
(D)- It shows light saturation point sunlight except for plants in shade or in dense forests.
(E)- This point show maximum rate of photosynthesis at optimum presence of various parameters.
View Solution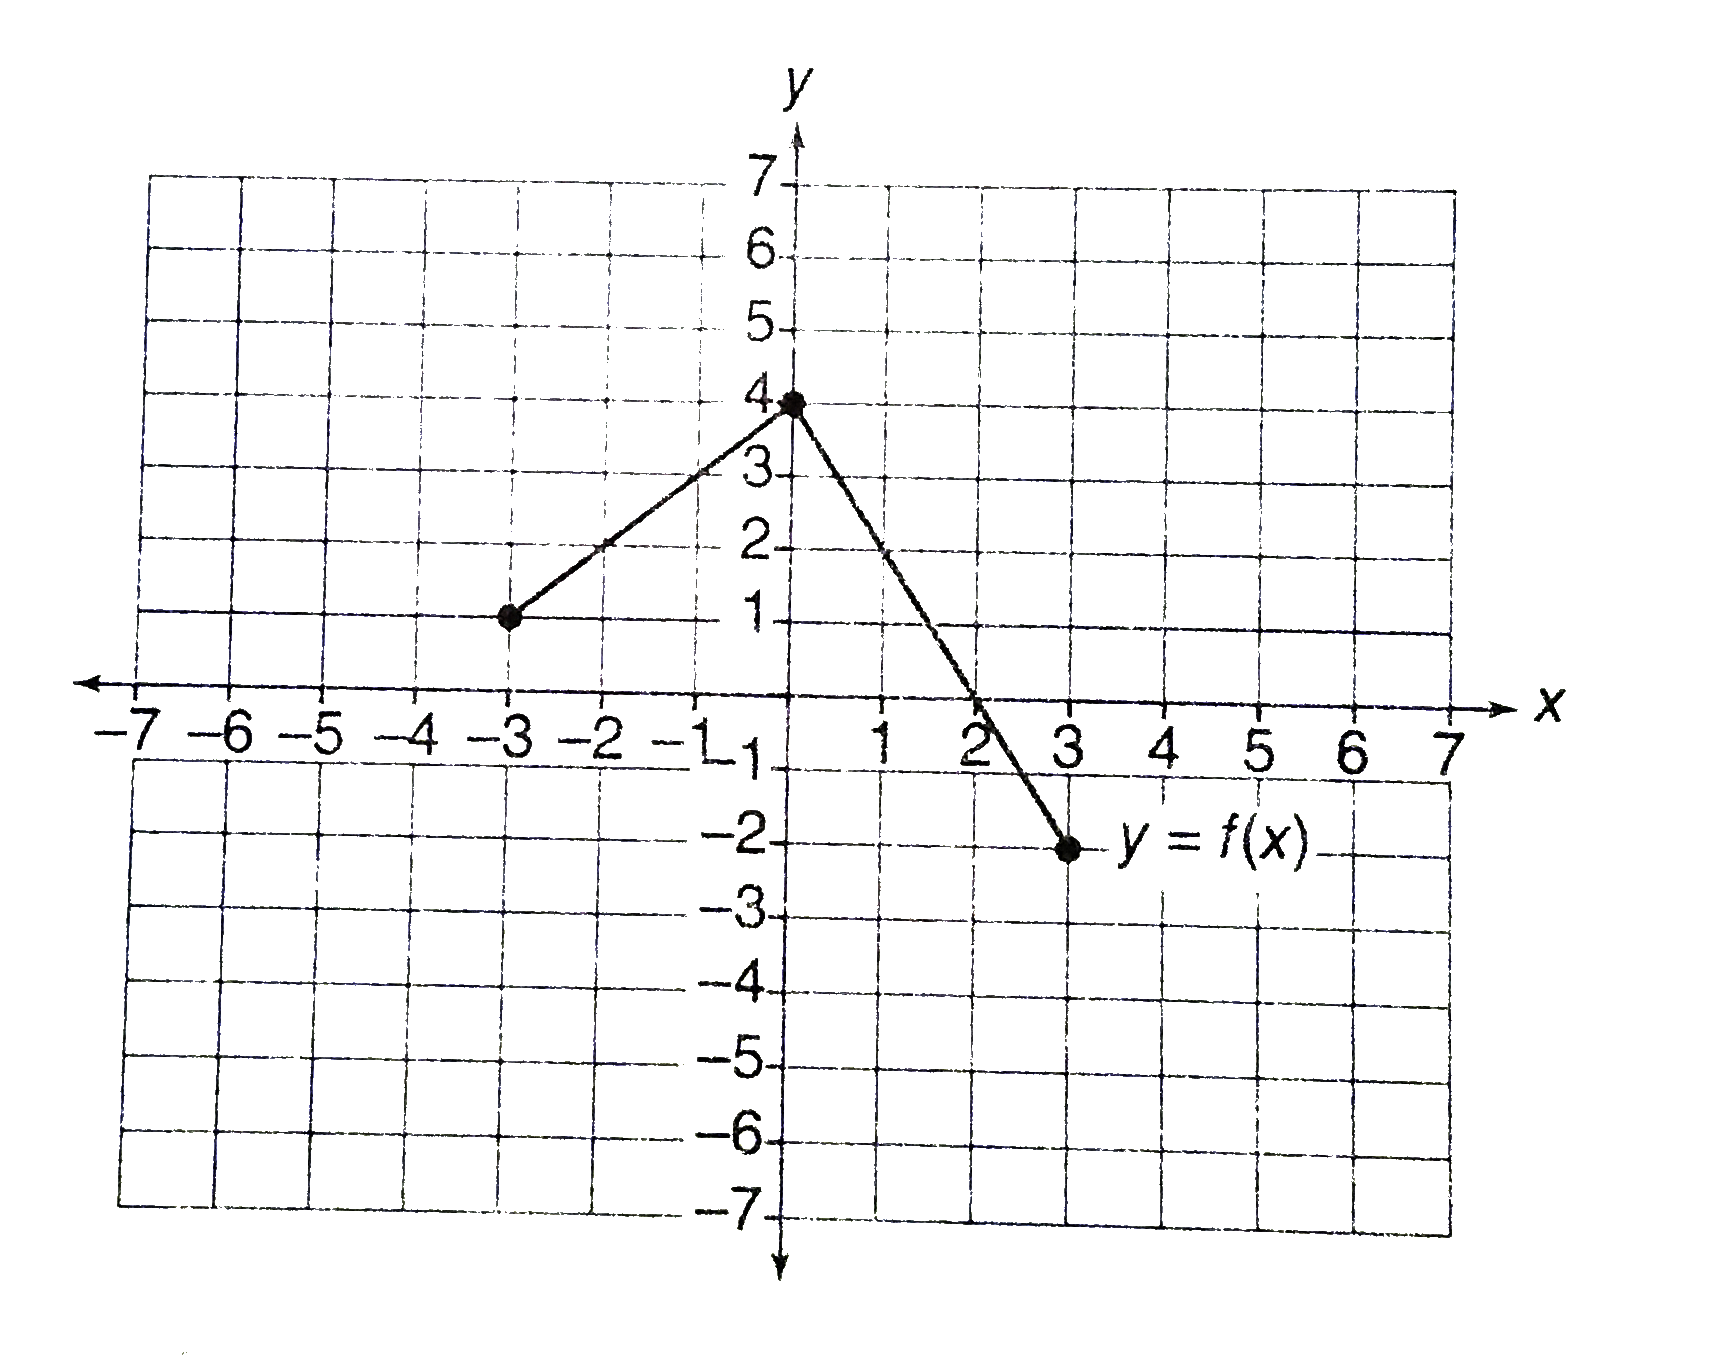
If the accomanying figure above shows the graph of function f, which of the following could represent the graph of y=f(x+1)?
View Solution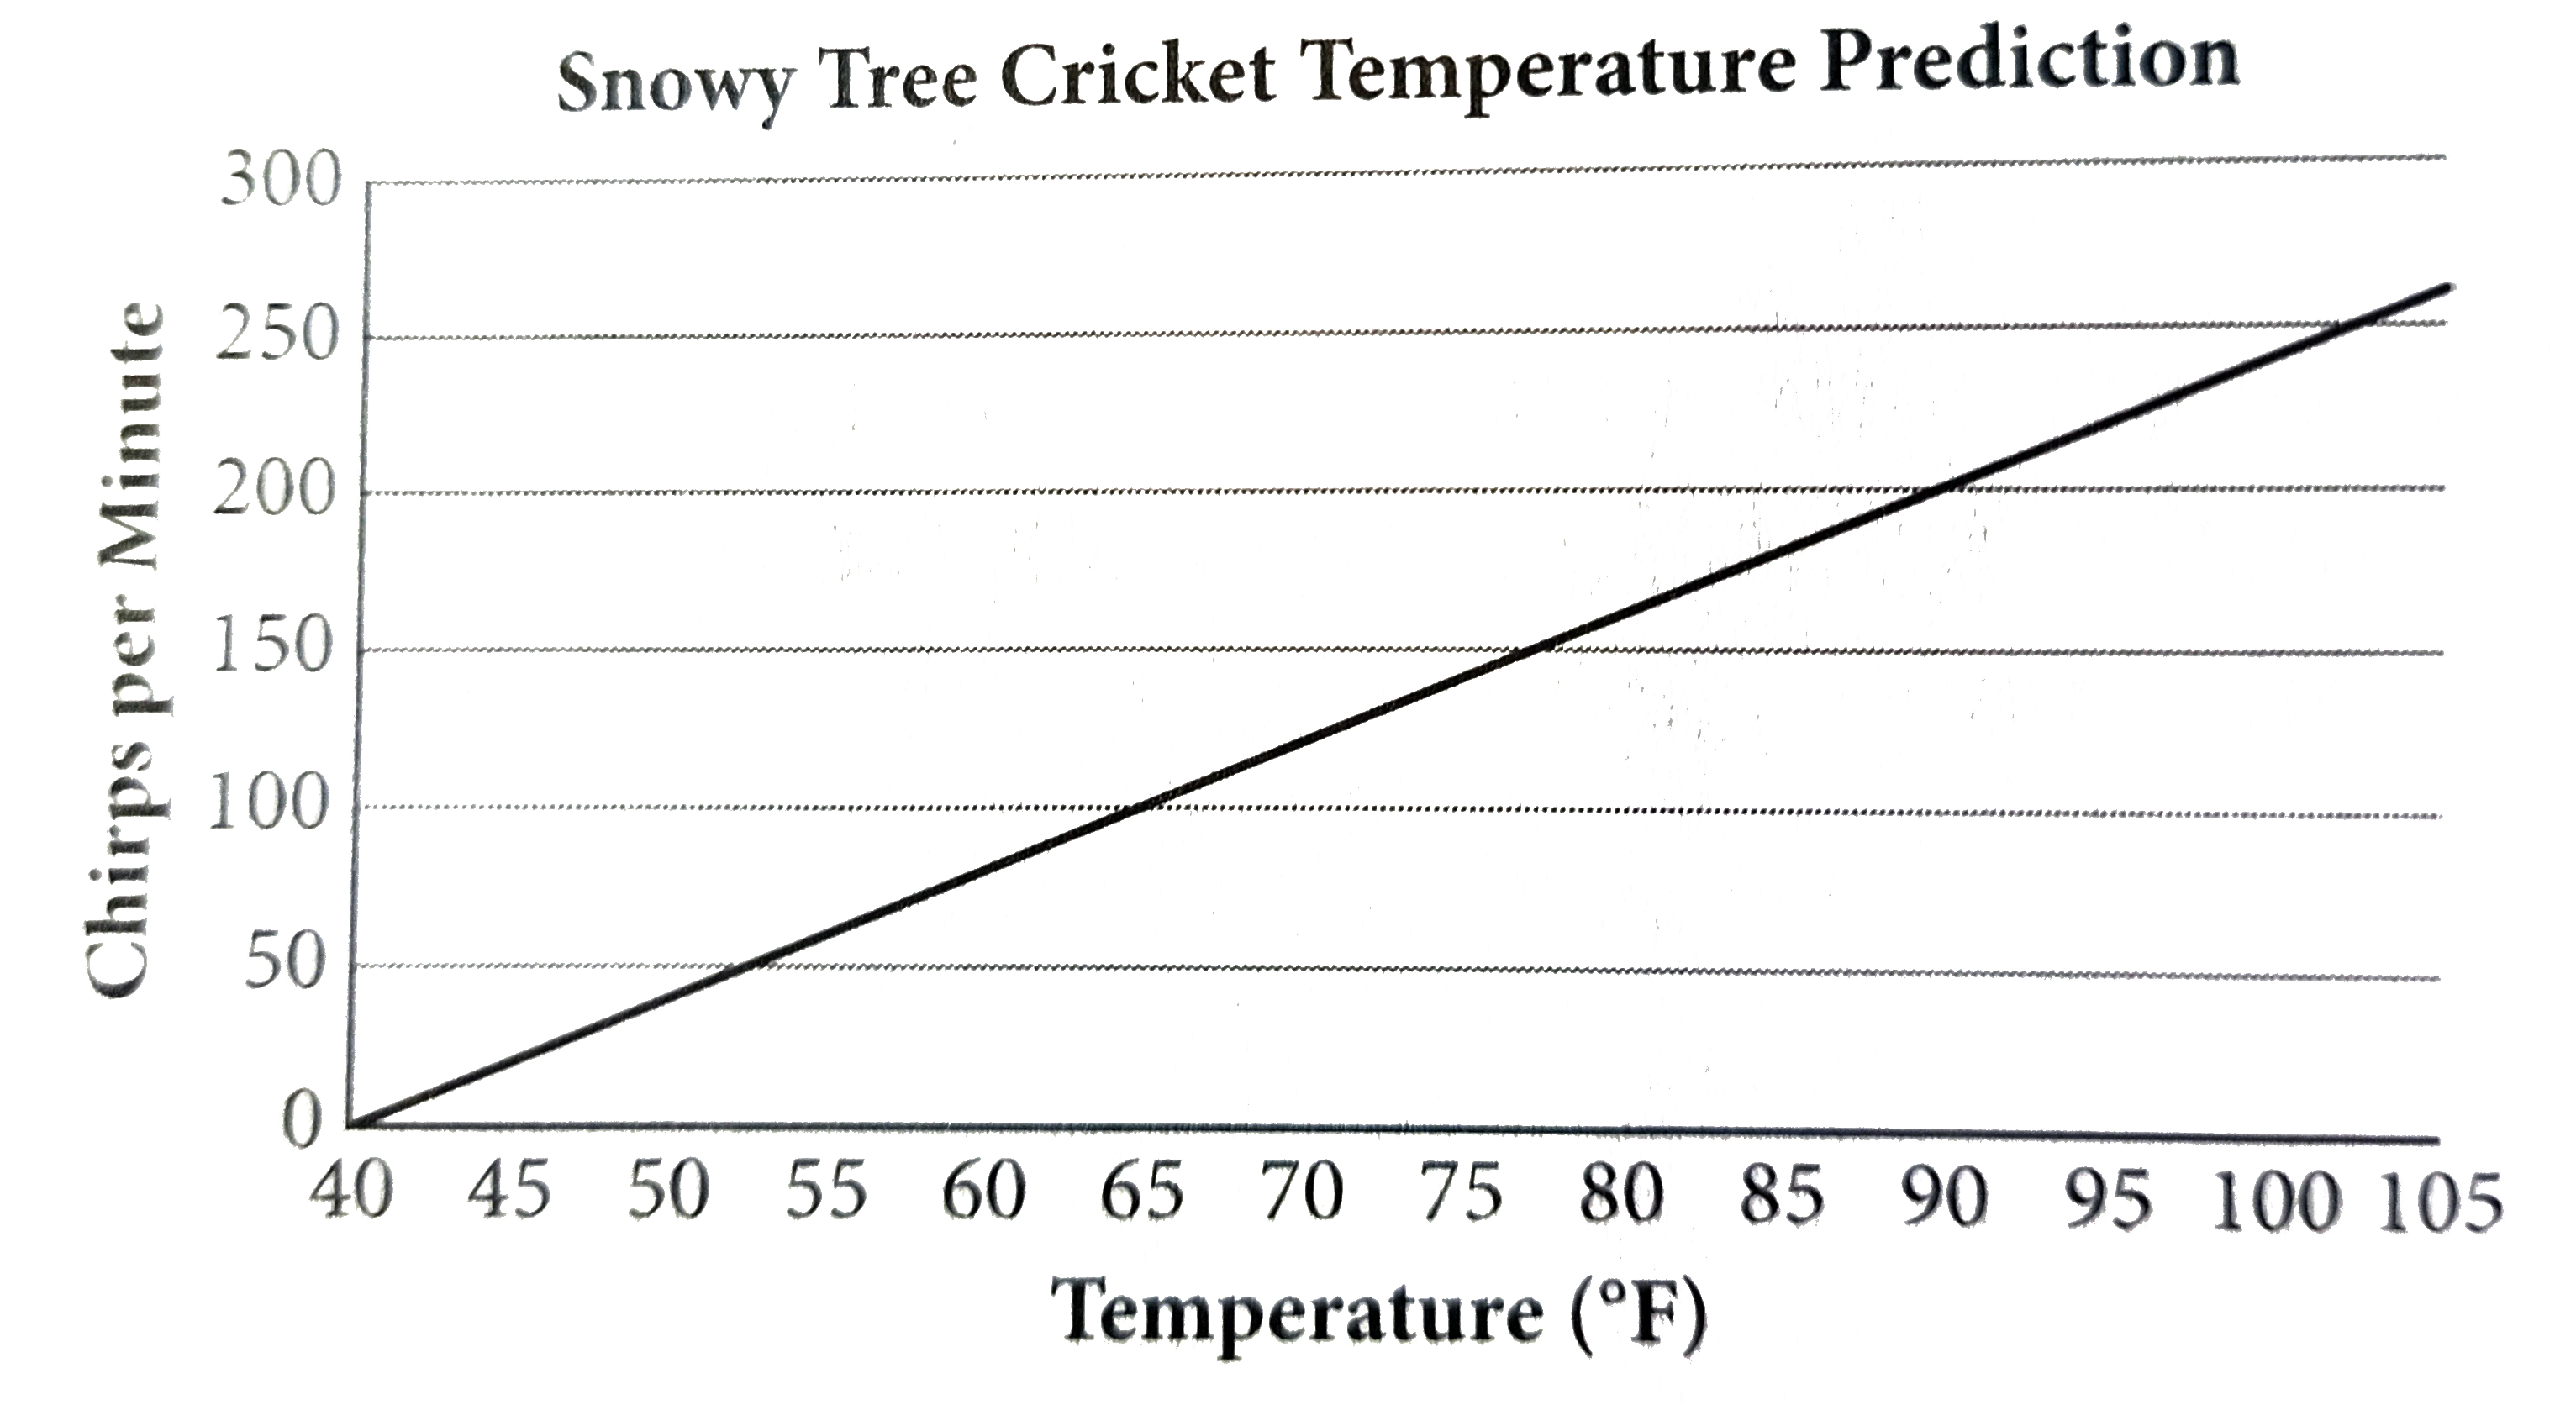
The graph shows the correlation between ambient air temperature, t, in degress Fahrenheit and the number of chirps, c, per minute that a snowy tree cricket makes at that temperature. Which of the following equations represents the line shown in the graph ?
View Solution
