The given graph shows pressure changes in the left side of the heart during a single heart beat

Between points W and X, which of the following valves are open or closed respectively ?
Atrio-ventricular valves Semilunar valves Closed Closed
Atrio-ventricular valves Semilunar valves Closed Open
Atrio-ventricular valves Semilunar valves Open Closed
Atrio-ventricular valves Semilunar valves Open Open
The correct Answer is:B
Topper's Solved these Questions
- TEST PAPERBOOK - NCERT FINGERTPS ENGLISHCHAPTER - TEST PAPEREXERCISE - Test Paper 1
50 Videos
- TEST PAPERBOOK - NCERT FINGERTPS ENGLISHCHAPTER - TEST PAPEREXERCISE - Test Paper 2
50 Videos
- TEST PAPERBOOK - NCERT FINGERTPS ENGLISHCHAPTER - TEST PAPEREXERCISE - Practice Paper-2
50 Videos
- STRUCTURAL ORGANISATION IN ANIMALSBOOK - NCERT FINGERTPS ENGLISHCHAPTER - STRUCTURAL ORGANISATION IN ANIMALSEXERCISE - Structural Organisation In Animals
129 Videos
- THE LIVING WORLDBOOK - NCERT FINGERTPS ENGLISHCHAPTER - THE LIVING WORLDEXERCISE - The Living World
130 Videos
Similar Questions
Knowledge Check
The given graph shows the change in DNA content in a single cell during the mitosis which stage occurs between the time x and y ?
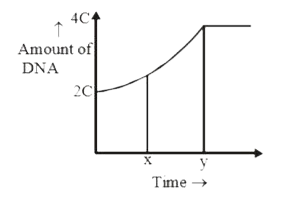 AInterphaseBProphaseCAnaphaseDTelophase
Narrowing of which of the following heart valves would cause blood to accumulate in the left atrium ?
ATricuspid valveBAortic valveCMitral valveDPulmonic valveThe given P-U graph shows the variation of internal energy of an ideal gas with increase in pressure. Which of the following pressure-volume graph is equivalent to this graph?
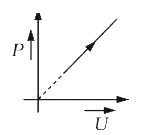 A
A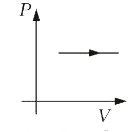 B
B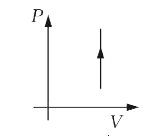 C
C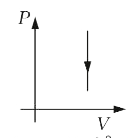 D
D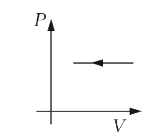
At the instant following the second heart sound,which heart valves are open ?
View SolutionNarrowing of which of the following heart valves would cause blood to accumulate in the left atrium ?
View SolutionThe given (p - U) graph shows the variation of internal energy of an ideal gas with increase in pressure. Which of the following pressure - volume graph is equivalent to this graph ?
 .
.
View SolutionA graph between vapour pressure and temperature of few liquids is given below . Study the graph and answer the following :
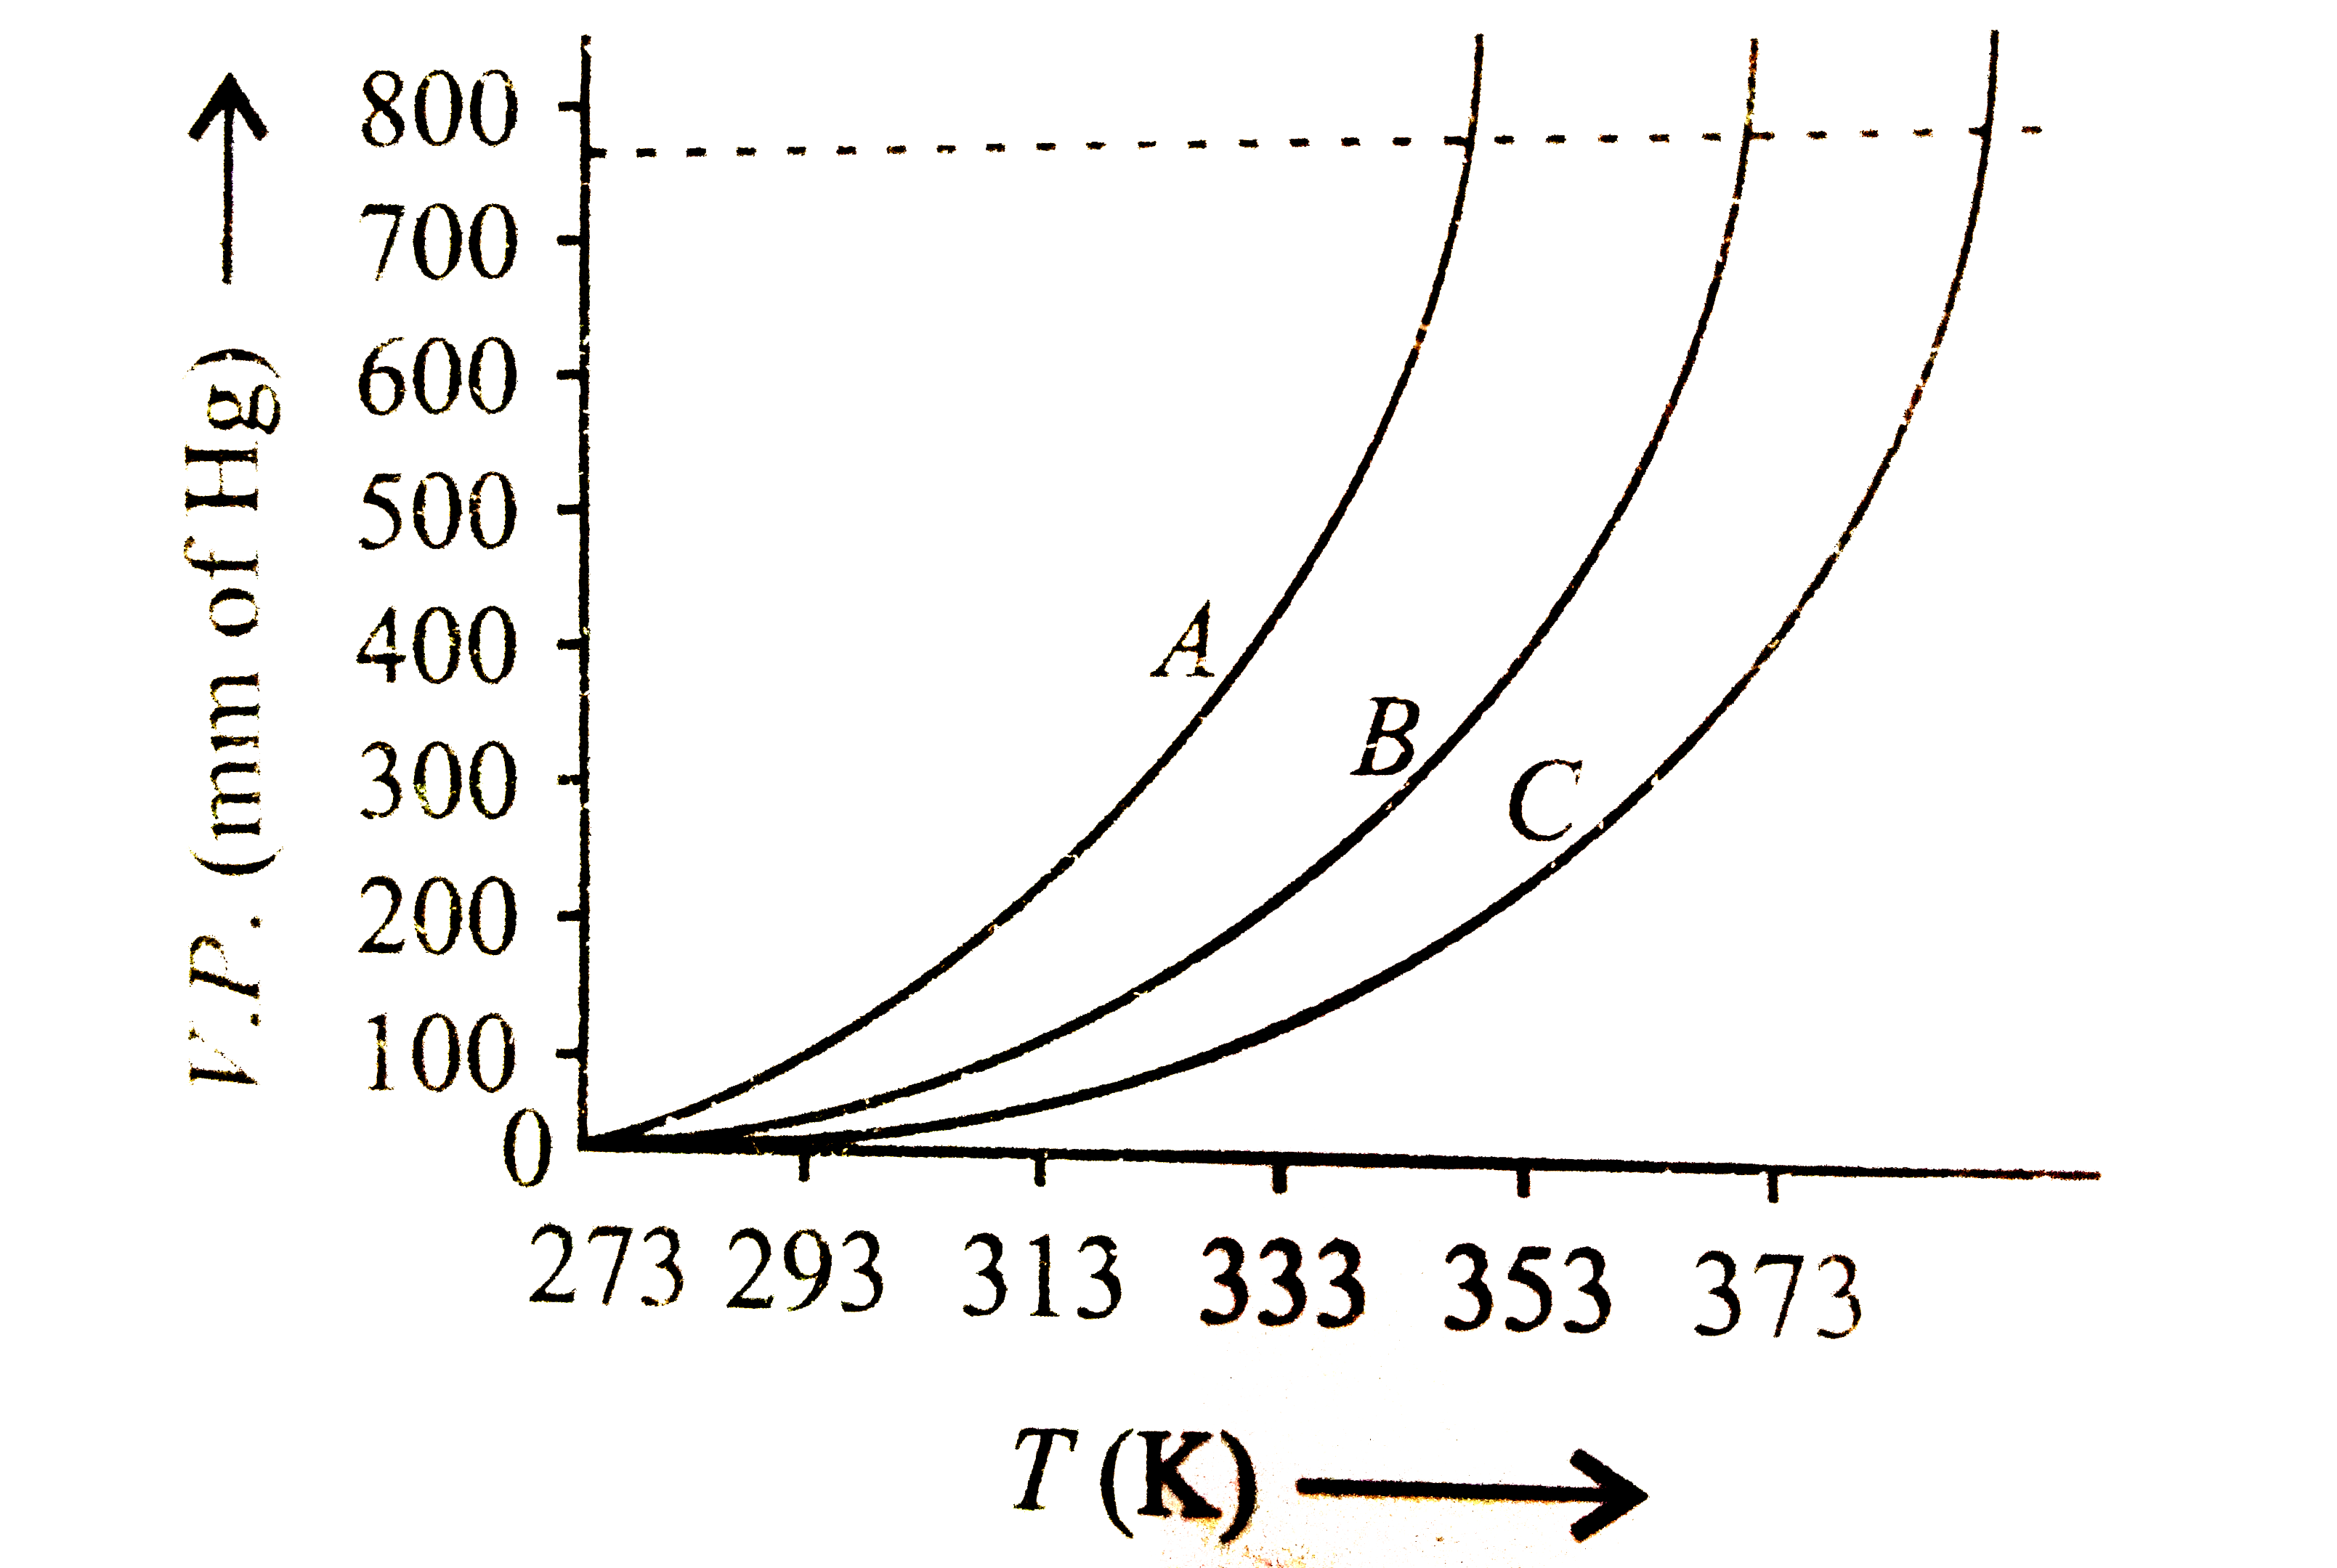
Which of the following statements is true ?
View SolutionWhich of the following graphs shows a stong positive association between x and y?
View Solution
