The given graph shows the change in DNA content in a single cell during the mitosis which stage occurs between the time x and y ?
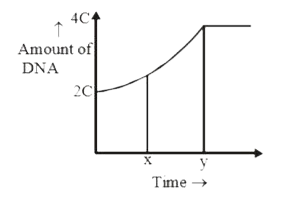
Interphase
Prophase
Anaphase
Telophase
The correct Answer is:A
Step by step video & image solution for The given graph shows the change in DNA content in a single cell during the mitosis which stage occurs between the time x and y ? by Biology experts to help you in doubts & scoring excellent marks in Class 12 exams.
Updated on:21/07/2023Topper's Solved these Questions
Similar Questions
Knowledge Check
The given graph shows the change in DNA content during various phases (A to D) in a typical mitotic cell cycle. Identify the phases and select the correct option.
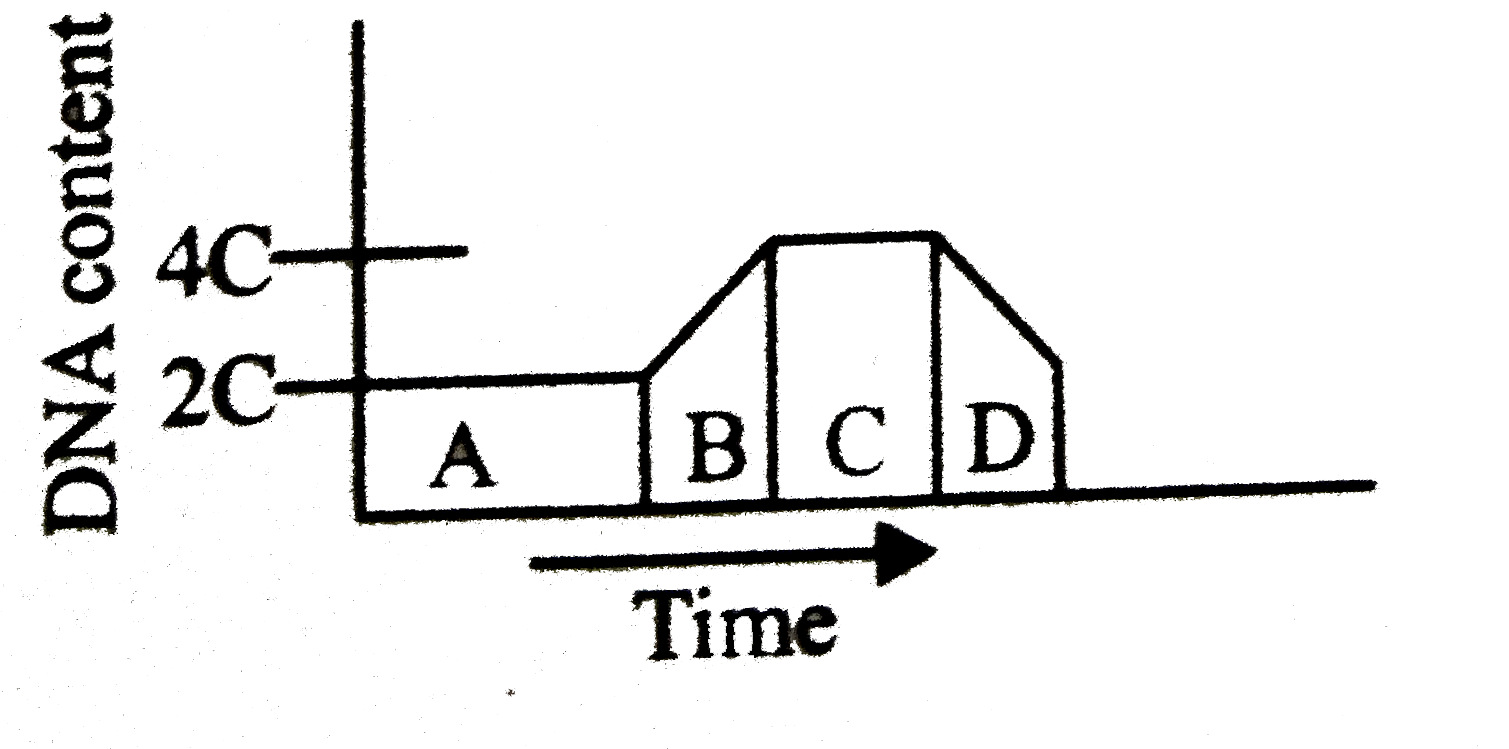 AABCDG2G1SMBABCDG2SG1MCABCDG1SG2MDABCDMG1SG2
The given graph shows pressure changes in the left side of the heart during a single heart beat

Between points W and X, which of the following valves are open or closed respectively ?AAtrio-ventricular valves Semilunar valves Closed ClosedBAtrio-ventricular valves Semilunar valves Closed OpenCAtrio-ventricular valves Semilunar valves Open ClosedDAtrio-ventricular valves Semilunar valves Open OpenGiven diagram shows a pair of homologous chromosomes during meiosis
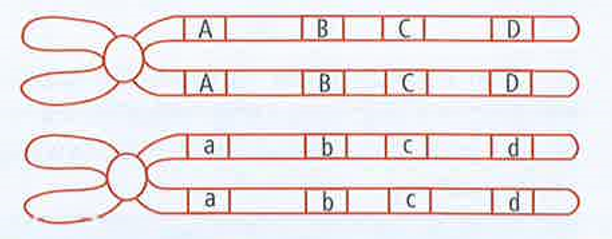
Maximum crossing over will occur between genesAA and a,D and dBC and d, c and DCB and c, b and CDA and d, a and D
The given diagram shows a stage during mitotic division in an animal cell:
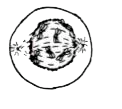
Identify the stage. Give a reason to support your answer.
View SolutionThe given diagram shows a stage during mitotic division in an animal cell:
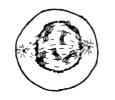
Name the type of cell division that occurs during:
A. Growth of a shoot
B. Formation of pollen grains.
View SolutionLook at the change of state diagram from gas to solid given here carefully, and answer the following questions.
a. During freezing, certain amount of heat is given out without any change in temperature. Which part of the graph shows this change?
b. During condensation, certain amount of heat is given out without any change in temperature. Which part of the graph shows this change?
c. Which point on the graph corresponds to
İ. condensation point? ii. freezing point?
d. What do ab and cd on the graph represent?
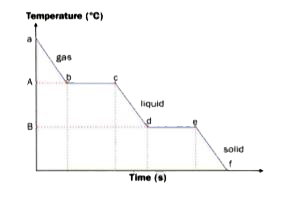
View SolutionThe given diagram shows a stage during mitotic division in an animal cell:
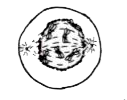
In what two ways is mitotic division in an animal cell different from the mitotic division in a plant cell?
View SolutionThe ion which shows active influx into guard cells during day time in a photoactive stomata
View Solution

