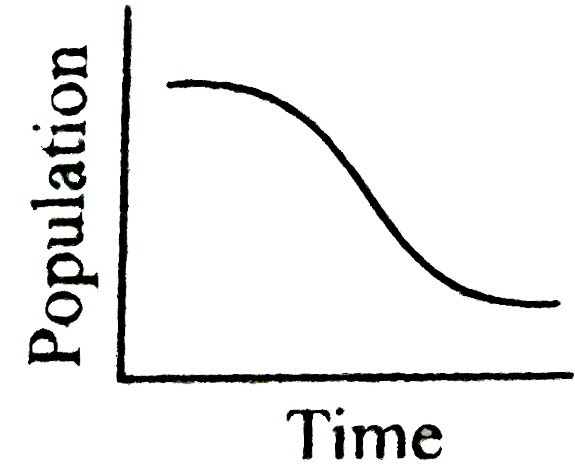
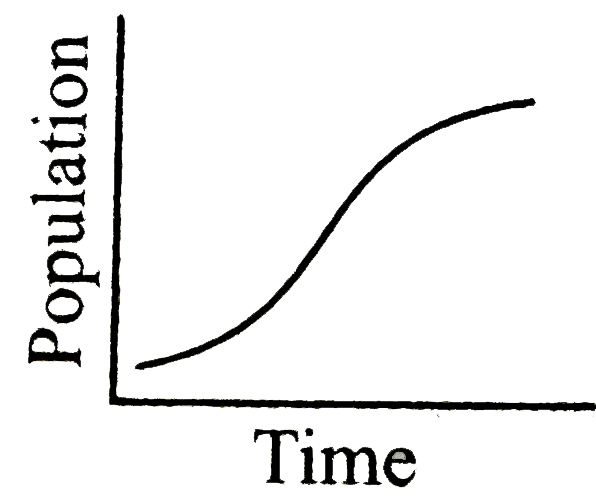
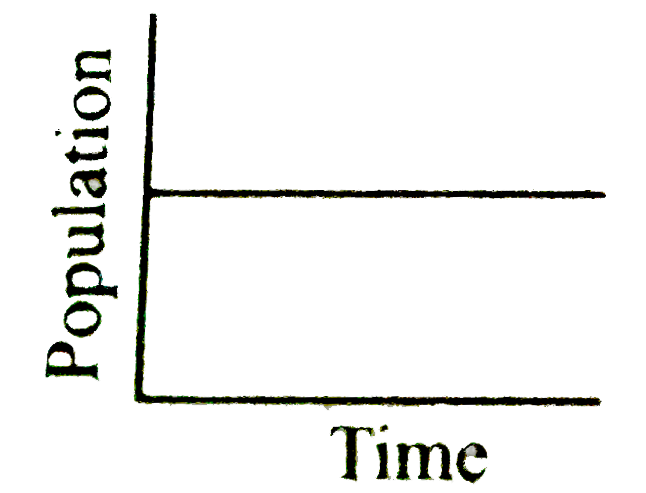
In a given population of 2000 indivials, 80 births and 125 deaths were reported over a given period of time. Which of the following graphs will correspond to it ?
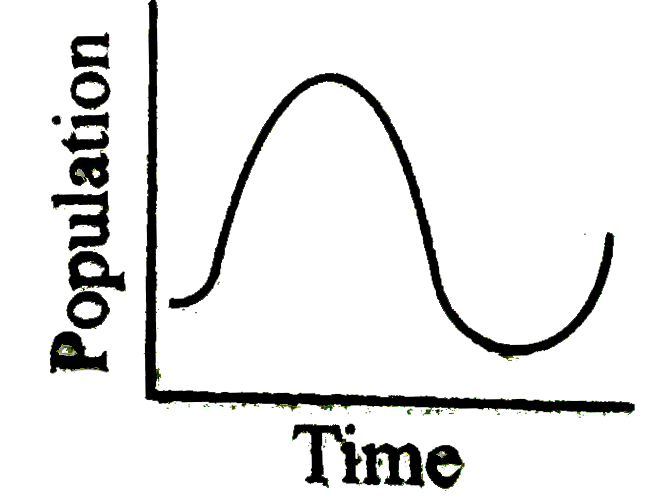
The correct Answer is:A
To solve the question regarding the population dynamics of a given population of 2000 individuals with 80 births and 125 deaths, we can follow these steps:
1. Identify the Initial Population:
- The initial population is given as 2000 individuals.
2. Calculate the Net Change in Population:
- To find the net change in population, we subtract the number of deaths from the number of births:
Net Change=Births−Deaths=80−125=−45
- This indicates that the population has decreased by 45 individuals.
3. Determine the New Population Size:
- To find the new population size after accounting for births and deaths:
New Population=Initial Population+Net Change=2000−45=1955
4. Analyze Population Trend:
- Since the number of deaths (125) is greater than the number of births (80), the overall trend indicates a decline in the population.
5. Select the Appropriate Graph:
- Given the declining trend in population, we need to identify which graph among the options represents a declining population over time.
- The correct graph will show a downward slope, indicating a decrease in population size.
Conclusion:
- After analyzing the options, the correct graph corresponds to a declining population, which is represented in Option 1.
- The initial population is given as 2000 individuals.
- To find the net change in population, we subtract the number of deaths from the number of births:
Net Change=Births−Deaths=80−125=−45
- This indicates that the population has decreased by 45 individuals.
- To find the new population size after accounting for births and deaths:
New Population=Initial Population+Net Change=2000−45=1955
- Since the number of deaths (125) is greater than the number of births (80), the overall trend indicates a decline in the population.
- Given the declining trend in population, we need to identify which graph among the options represents a declining population over time.
- The correct graph will show a downward slope, indicating a decrease in population size.
- After analyzing the options, the correct graph corresponds to a declining population, which is represented in Option 1.
Topper's Solved these Questions
- BOOK - NCERT FINGERTPS ENGLISHCHAPTER - ORGANISMS AND POPULATIONEXERCISE - HOTS5videos
ORGANISMS AND POPULATION
- BOOK - NCERT FINGERTPS ENGLISHCHAPTER - ORGANISMS AND POPULATIONEXERCISE - NCERT20videos
ORGANISMS AND POPULATION
- BOOK - NCERT FINGERTPS ENGLISHCHAPTER - MOLECULAR BASIS OF INHERITANCEEXERCISE - Molecular Basis Of Inheritance151videos
MOLECULAR BASIS OF INHERITANCE
- BOOK - NCERT FINGERTPS ENGLISHCHAPTER - PRACTICE PAPERSEXERCISE - Practice paper150videos
PRACTICE PAPERS
Similar Questions
Knowledge Check
- Question 1 - Select One
Which of the following is incorrect about the given graph ?
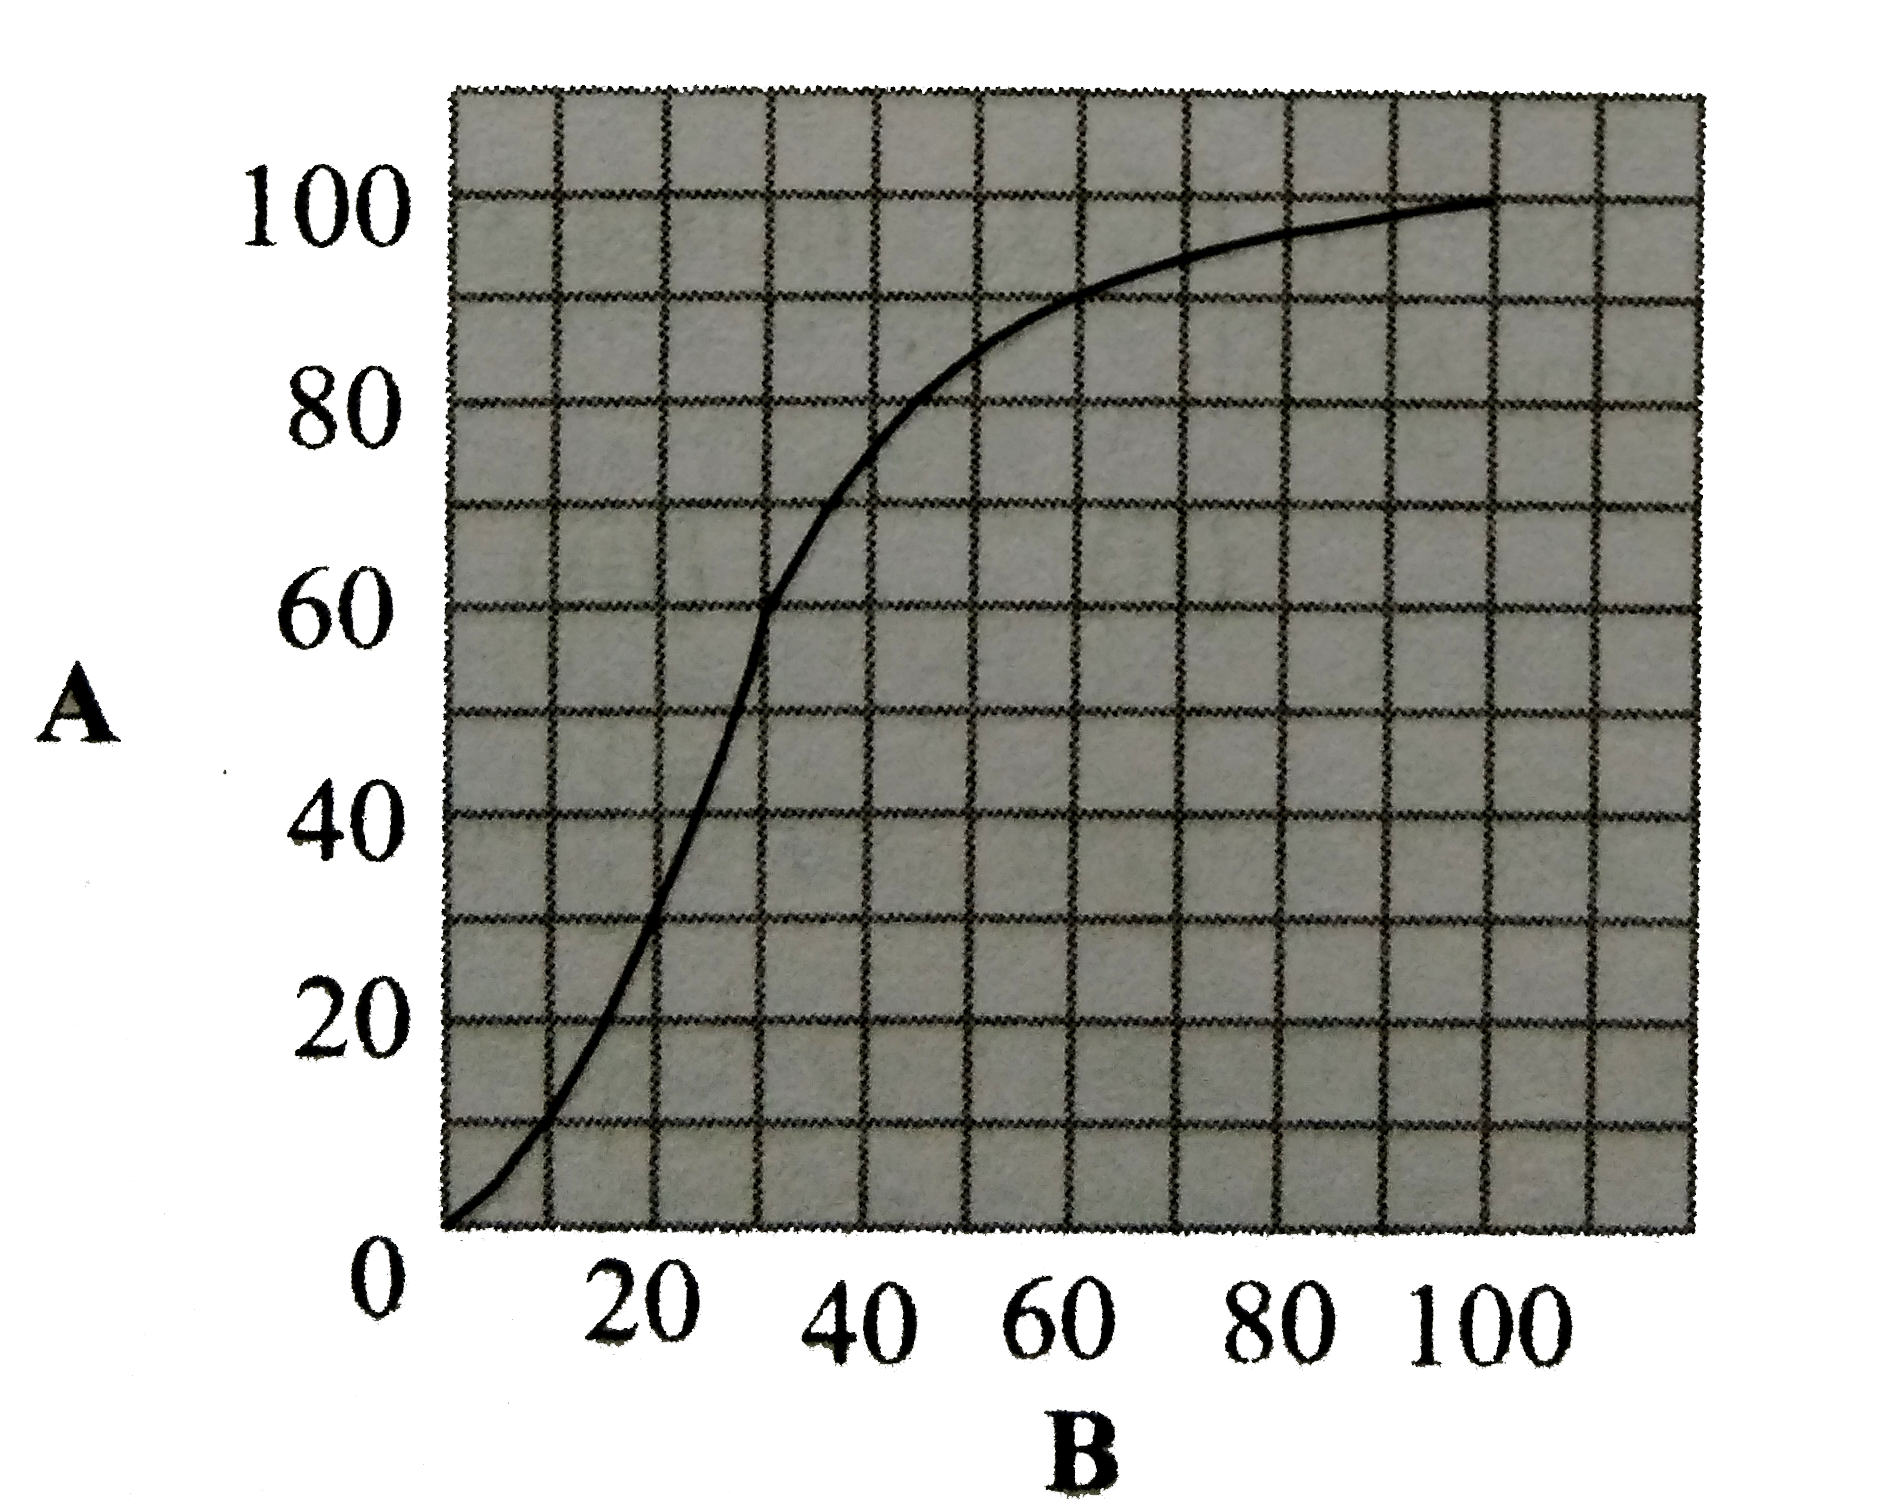 AThe curve is called oxygen dissociation curve.BThe part 'A' represents percentage saturation of haemologbin with oxygen.CThe part 'B' represents partial pressure of carbon dioxide.DThis curve is highly useful in studying the effect of factors like PCO2,H+ concentration, etc. on binding of CO2 with haemoglobin.
 - Question 2 - Select One
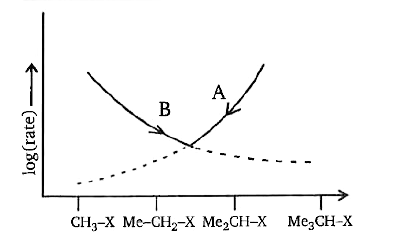
Which of the following is true about given graphs A and B ?AA→SN1 B→SN2BA→SN1 B→SN2CAandB→E1DAandB→E2
From the given graph
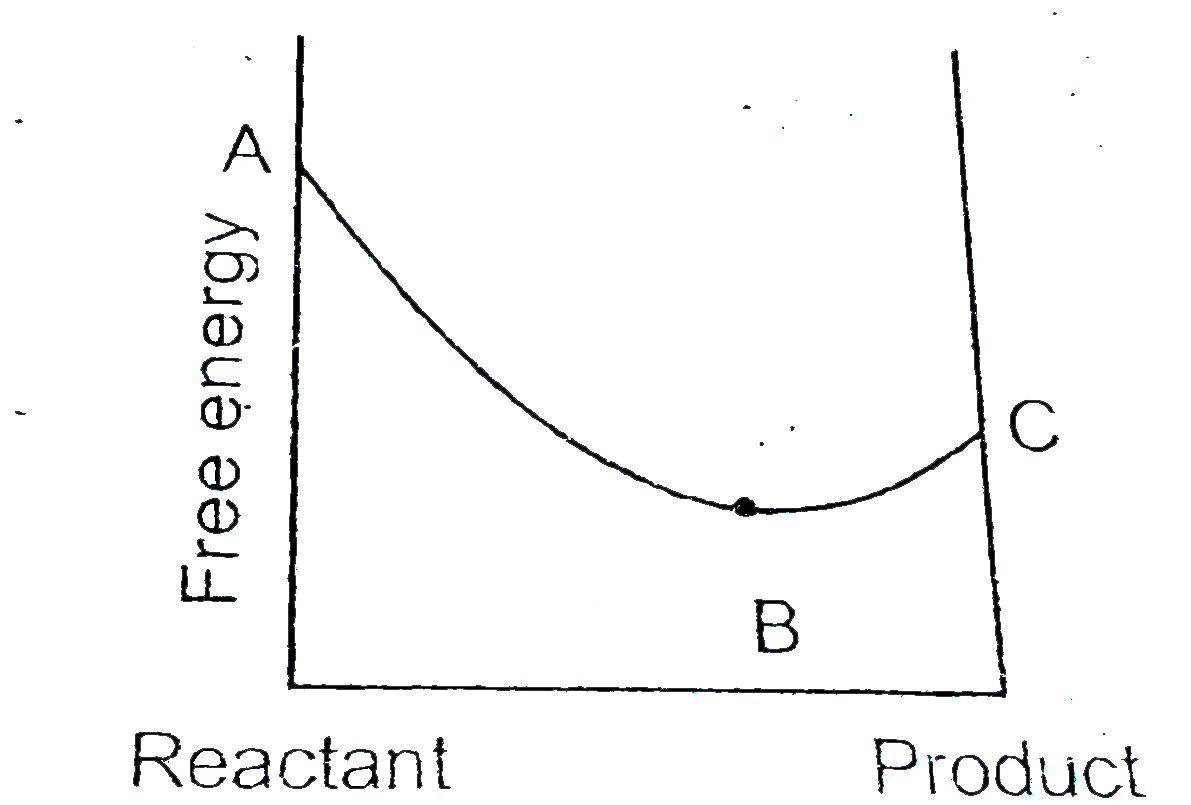
Which of the following statement is correct ?View SolutionWhich of the following describes the given graph correctly ?
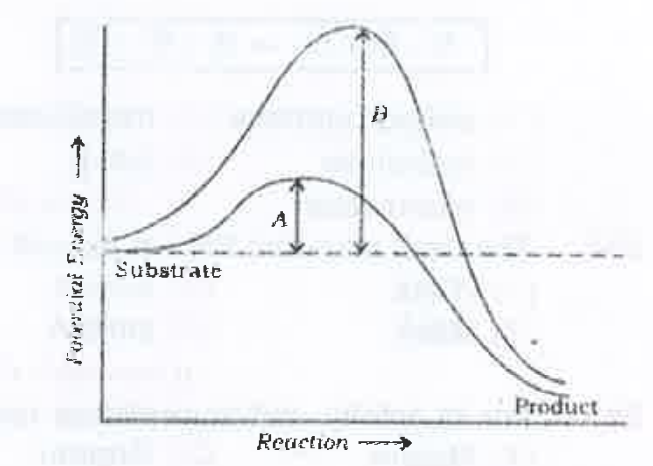 View Solution
Which of the following gates correspond to the truth table given below ?
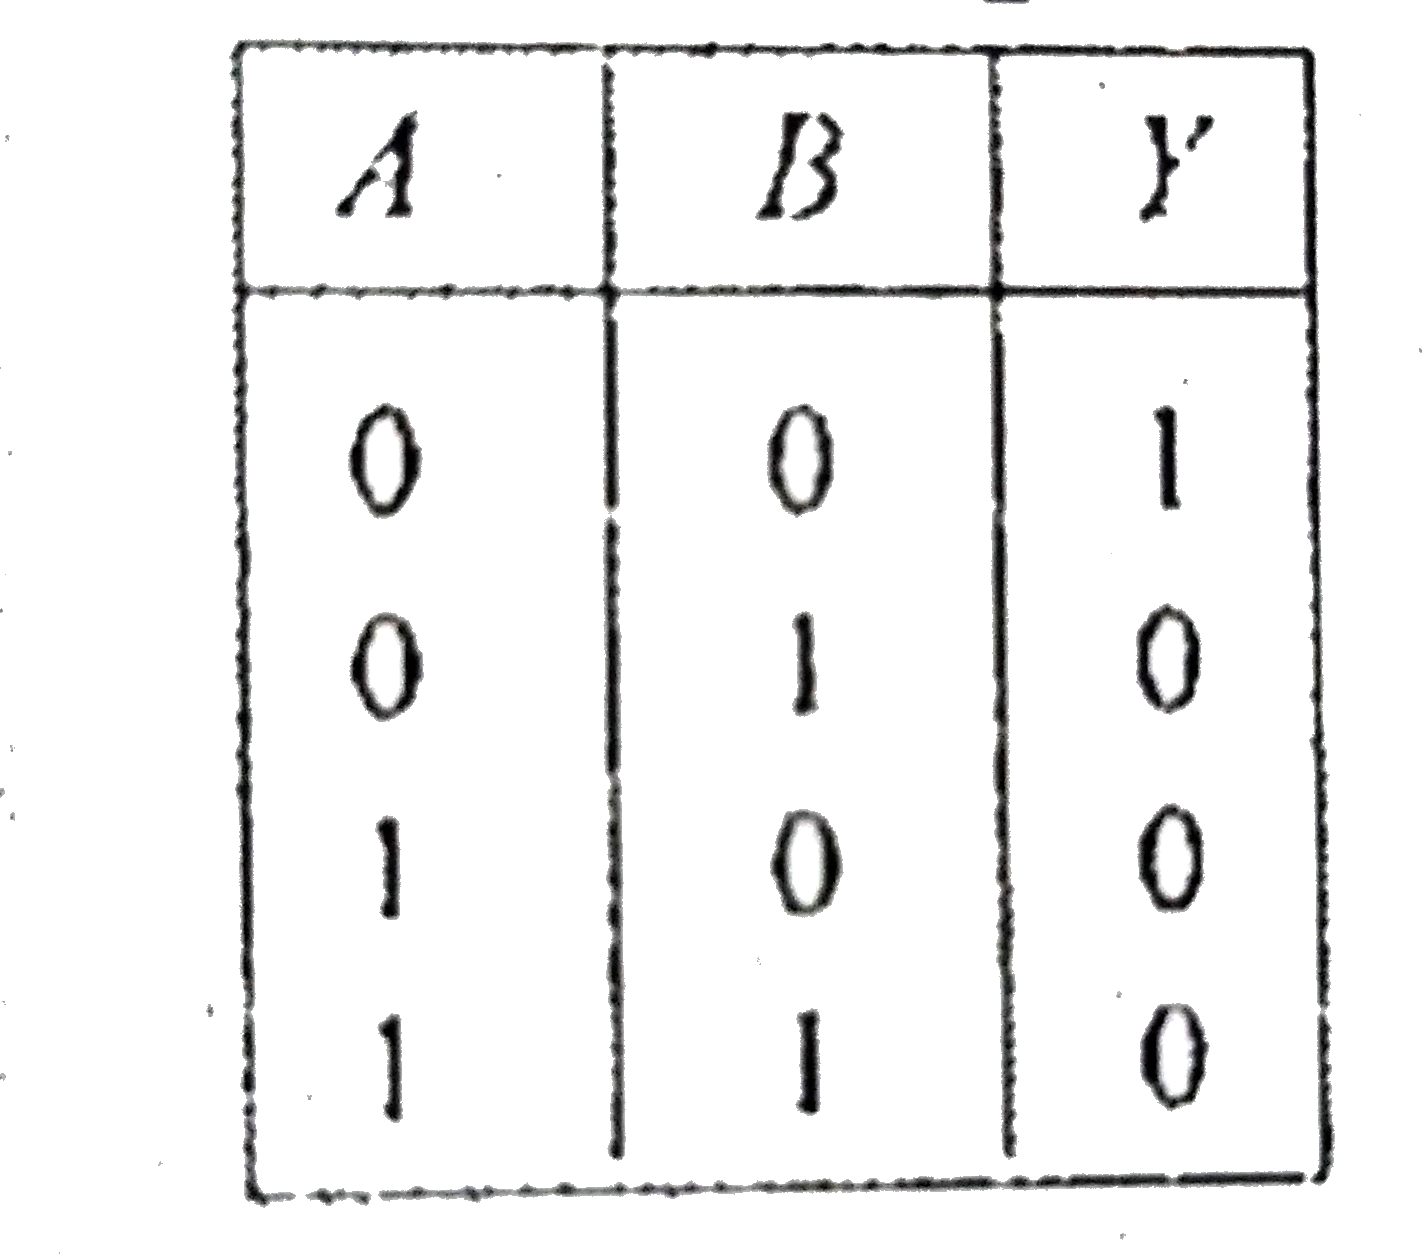 View Solution
Which of the following gates corresponds to the truth table given below?
 View Solution
Which of the following gates corresponds to the truth table given below ?
 View Solution
Which of the following graphs given below show (s) adiabatic process?
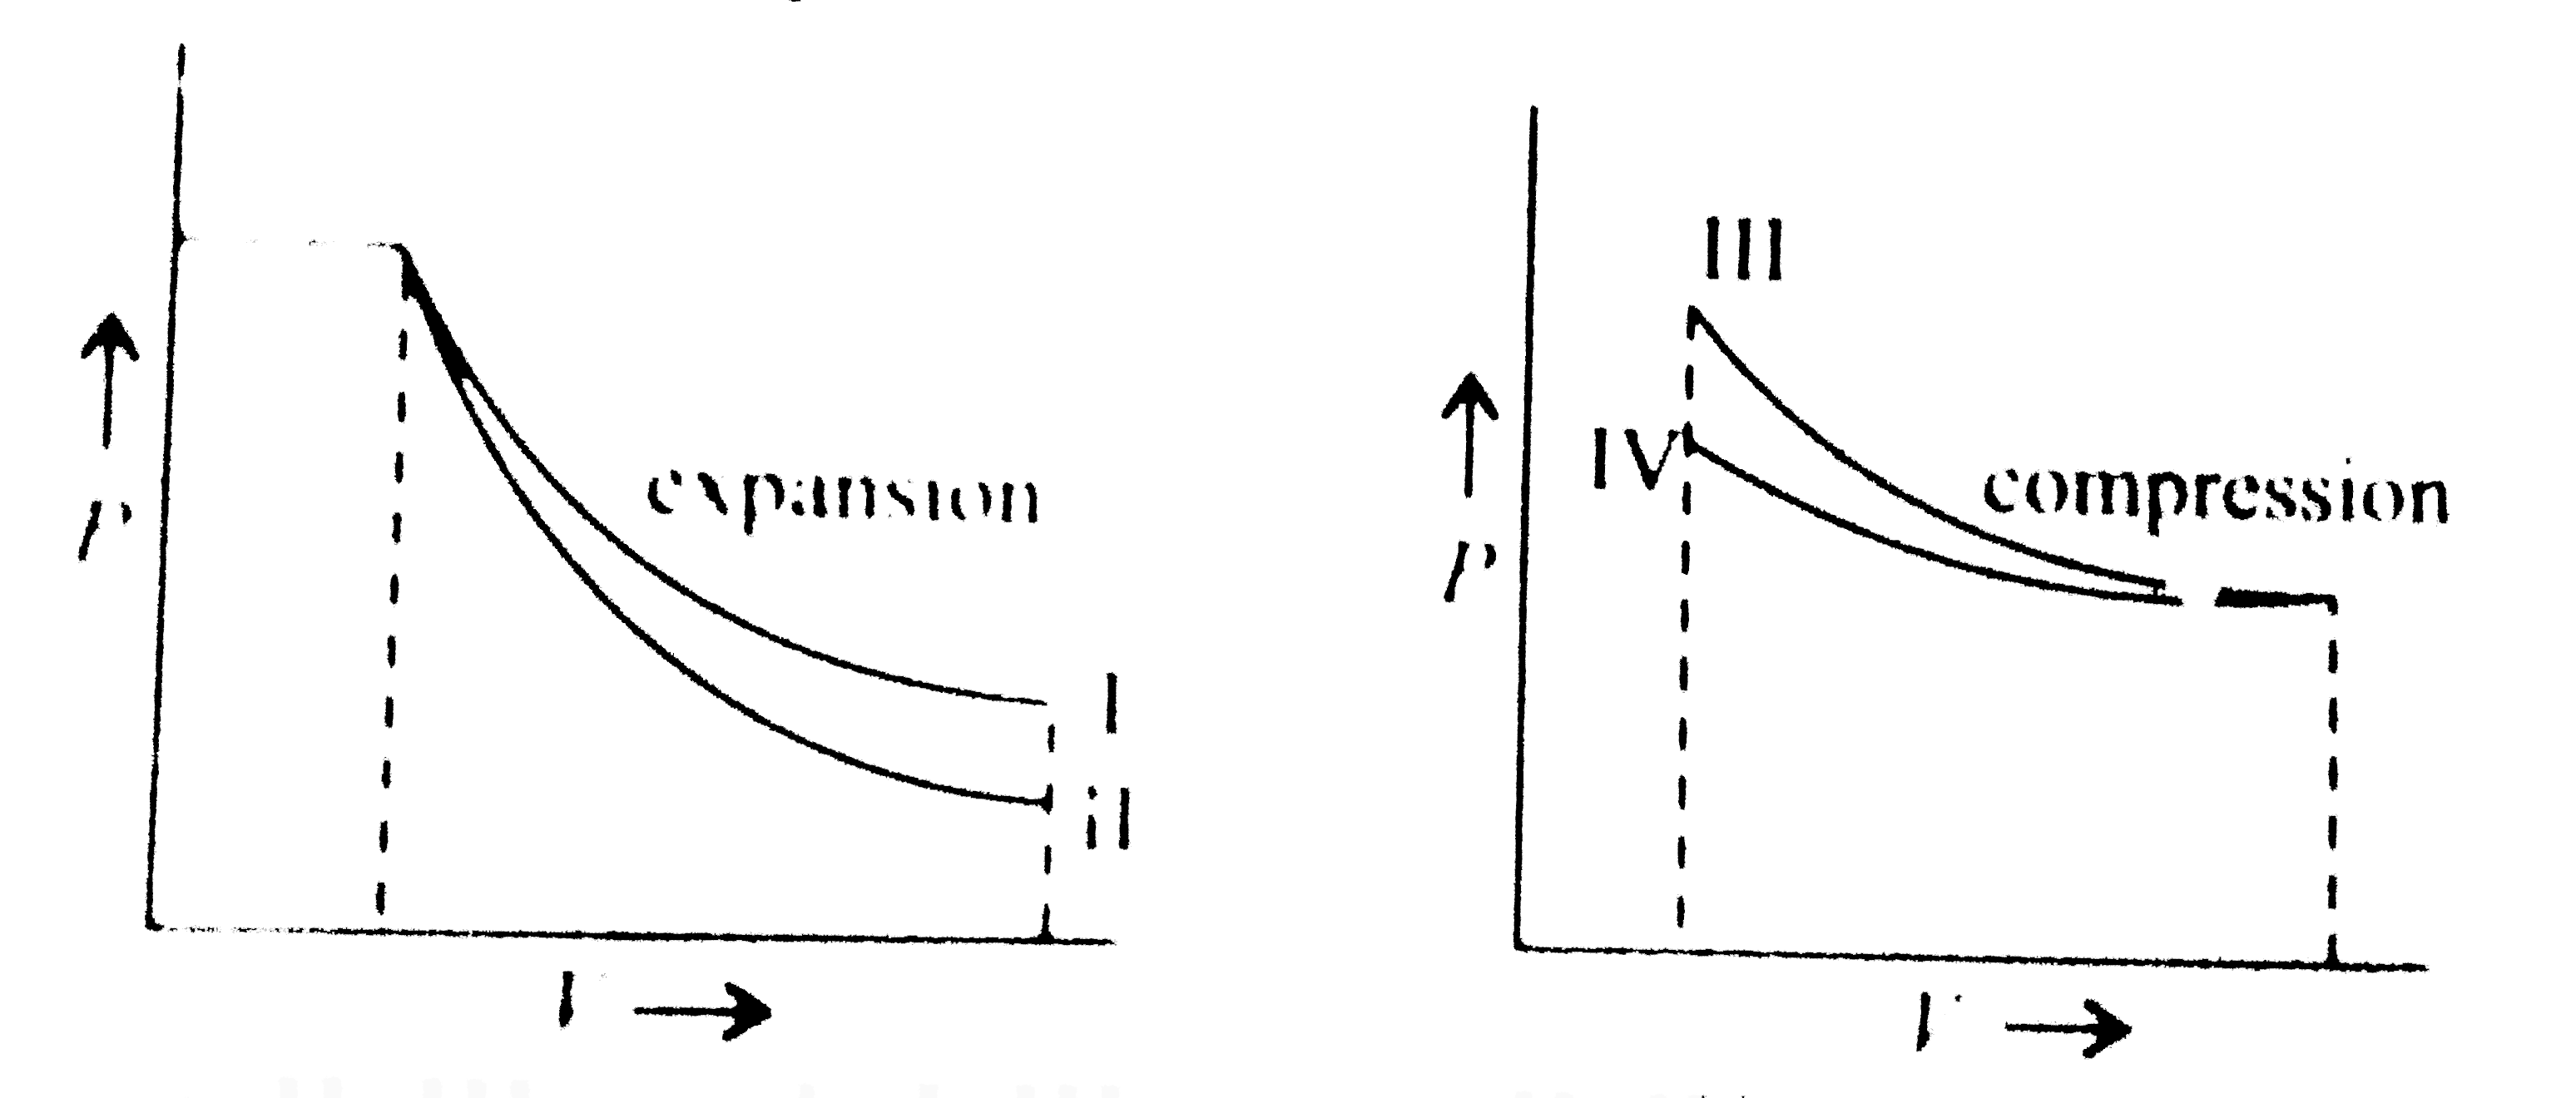 View Solution


