Which of the following graph corresponds to a population of 2000 individuals, with 800 births and 1200 deaths over a given period of time?
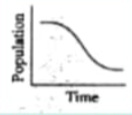
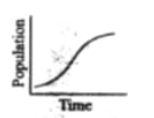
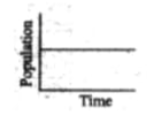
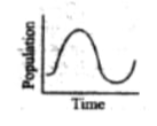
The correct Answer is:A
To solve the problem, we need to analyze the population dynamics based on the given data: a population of 2000 individuals, with 800 births and 1200 deaths over a specific period of time.
Step 1: Calculate the Net Population Change
First, we need to determine the net change in the population by subtracting the number of deaths from the number of births.
Net Change=Births−Deaths=800−1200=−400
Step 2: Determine the New Population Size
Next, we calculate the new population size after accounting for the births and deaths.
New Population=Initial Population+Net Change=2000−400=1600
Step 3: Calculate the Birth Rate and Death Rate
Now, we can calculate the crude birth rate and crude death rate.
- Crude Birth Rate (CBR):
CBR=BirthsTotal Population=8002000=0.4
- Crude Death Rate (CDR):
CDR=DeathsTotal Population=12002000=0.6
Step 4: Analyze Population Trends
Since the death rate (0.6) is greater than the birth rate (0.4), this indicates that the population is decreasing over time.
Step 5: Identify the Correct Graph
Now, we need to find the graph that represents a decreasing population. Among the options provided, we look for a graph that shows a downward trend.
Based on the analysis, the correct option is the one that shows a decrease in population, which corresponds to the first graph.
Final Answer
The graph that corresponds to the population dynamics described is Option 1.
---
First, we need to determine the net change in the population by subtracting the number of deaths from the number of births.
Next, we calculate the new population size after accounting for the births and deaths.
Now, we can calculate the crude birth rate and crude death rate.
CBR=BirthsTotal Population=8002000=0.4
CDR=DeathsTotal Population=12002000=0.6
Since the death rate (0.6) is greater than the birth rate (0.4), this indicates that the population is decreasing over time.
Now, we need to find the graph that represents a decreasing population. Among the options provided, we look for a graph that shows a downward trend.
The graph that corresponds to the population dynamics described is Option 1.
Similar Questions
Knowledge Check
In a given population of 2000 indivials, 80 births and 125 deaths were reported over a given period of time. Which of the following graphs will correspond to it ?
A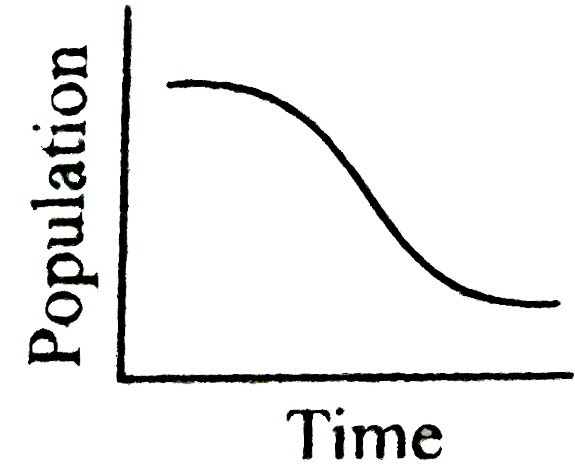 B
B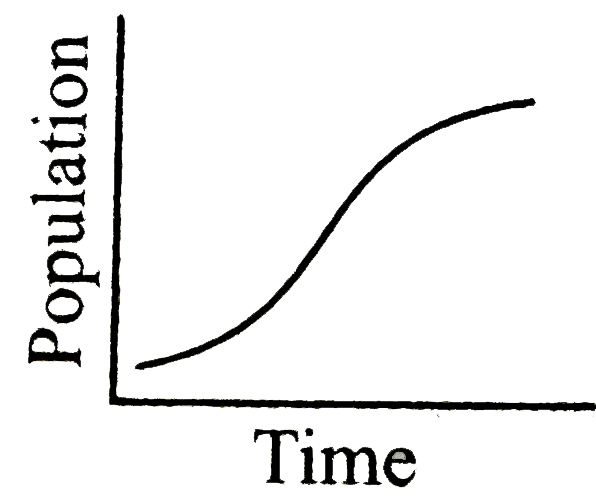 C
C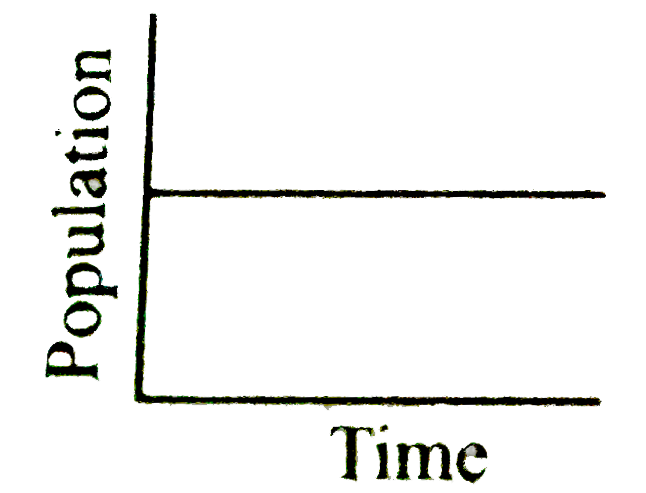 D
D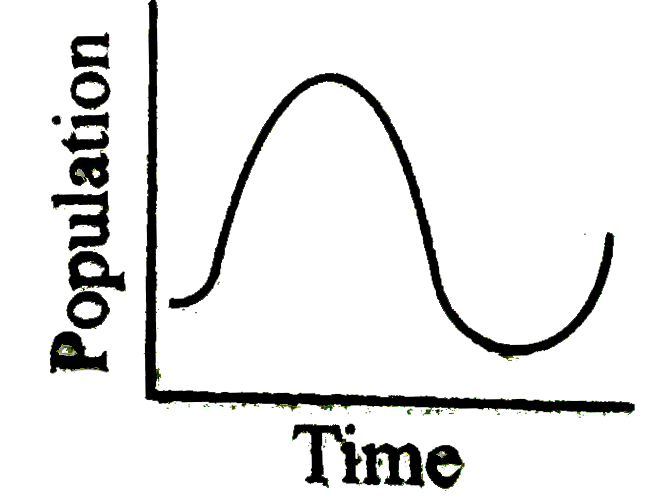
Which of the following x-t graphs does not represent periodic motion?
A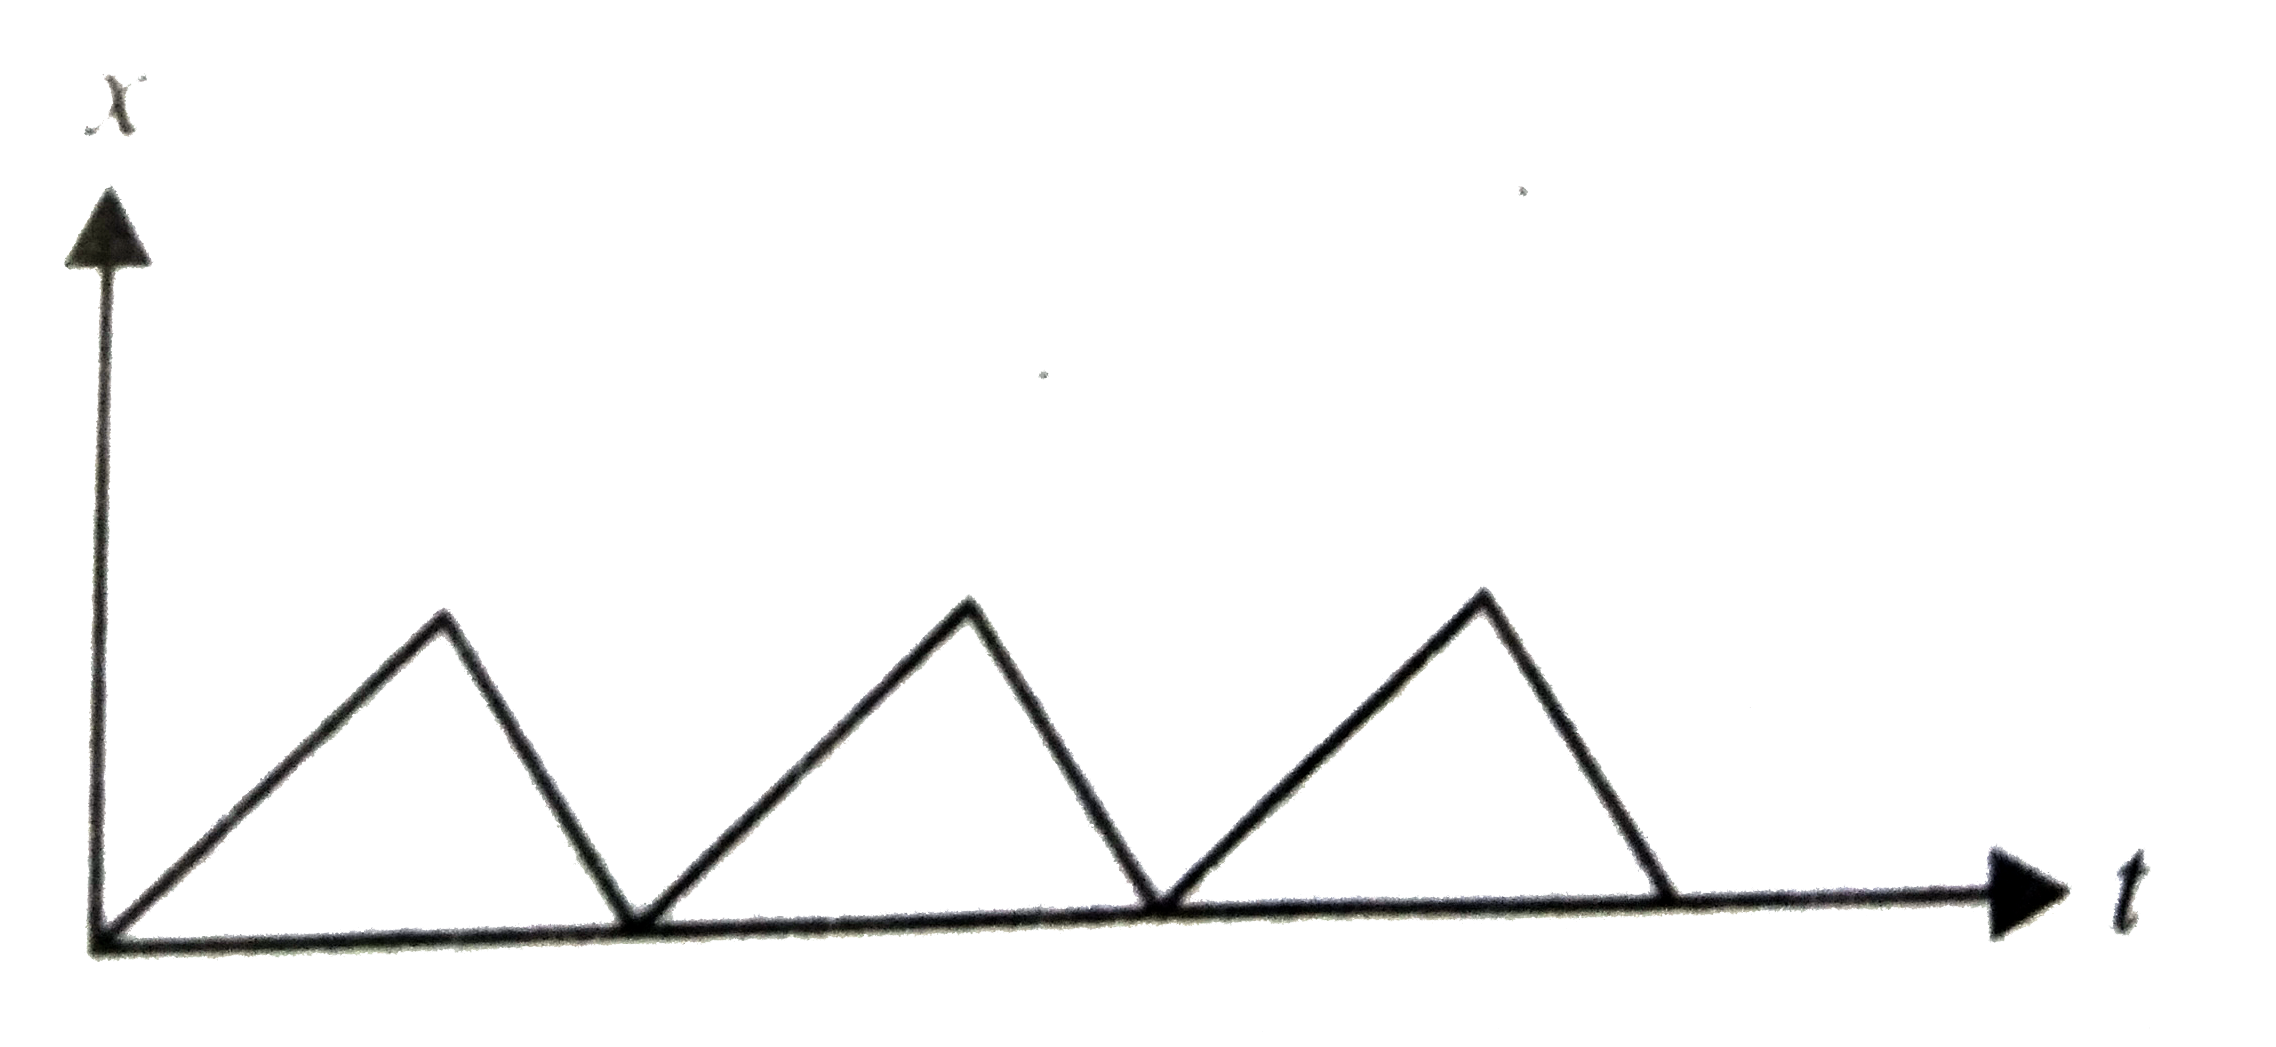 B
B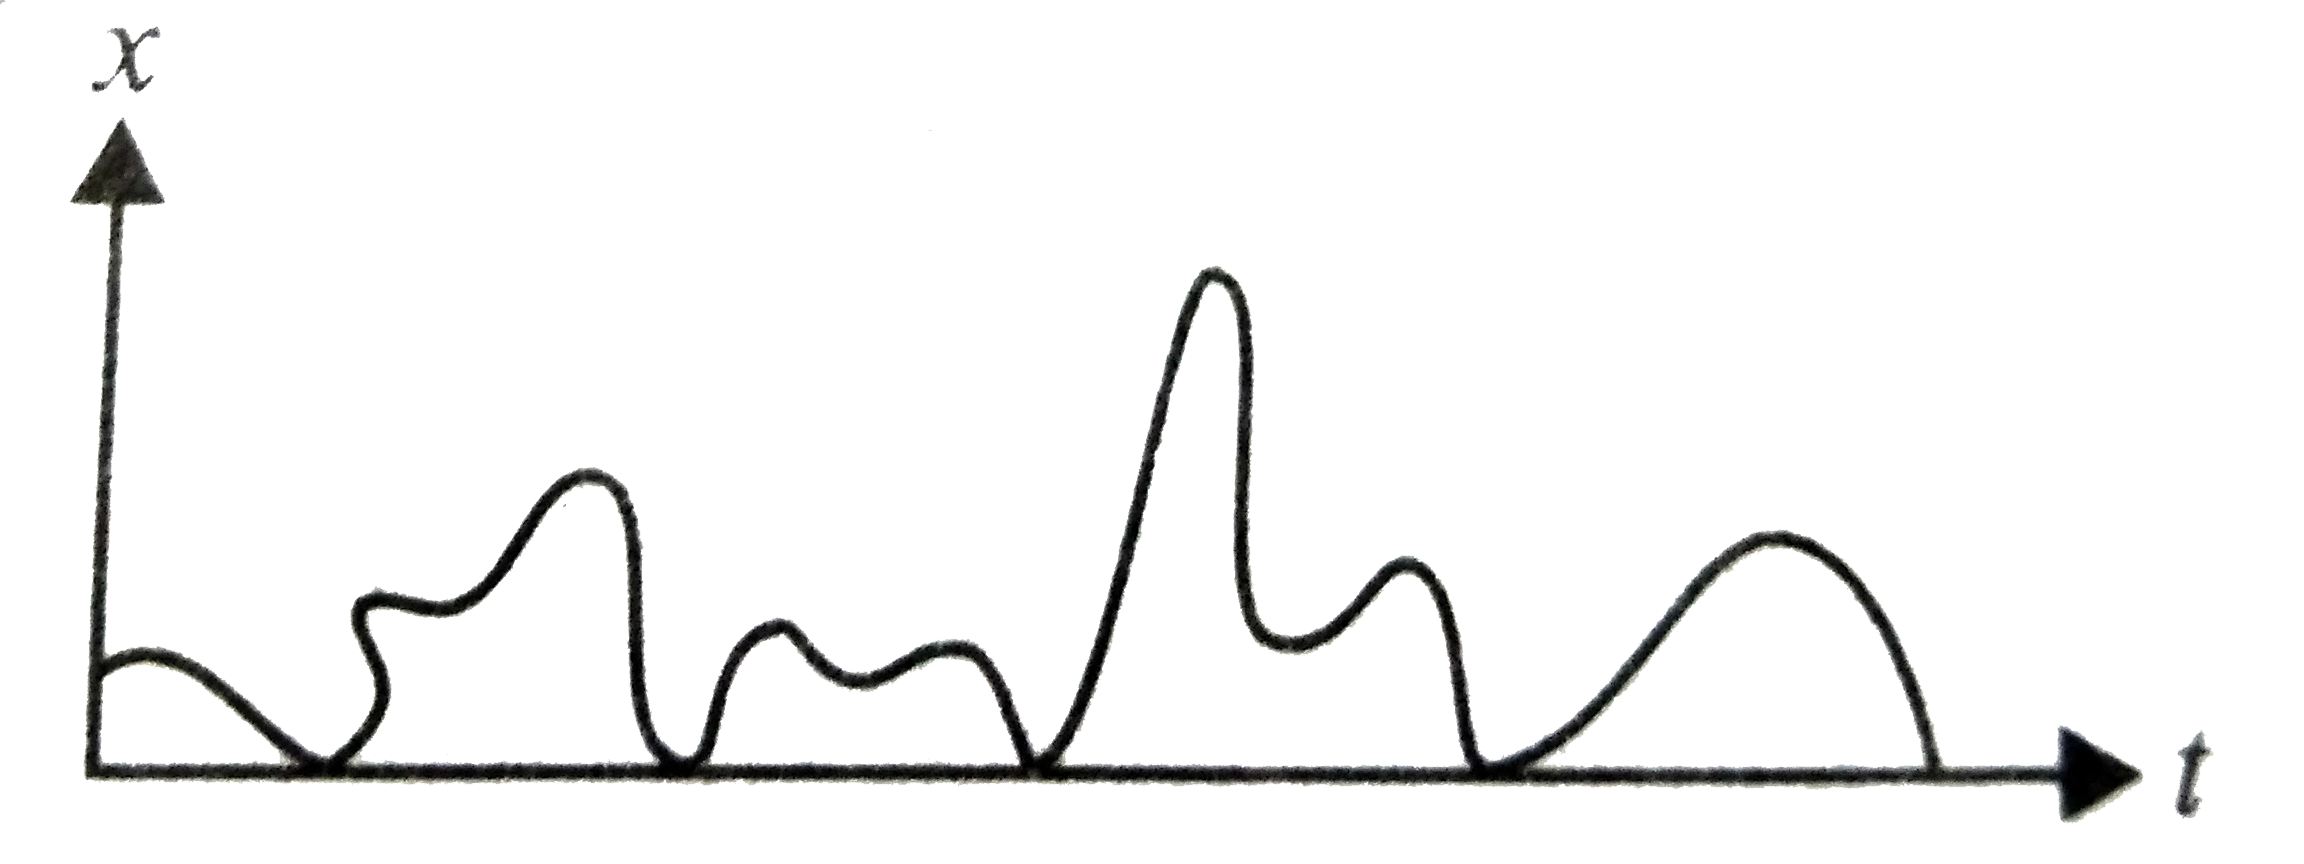 C
C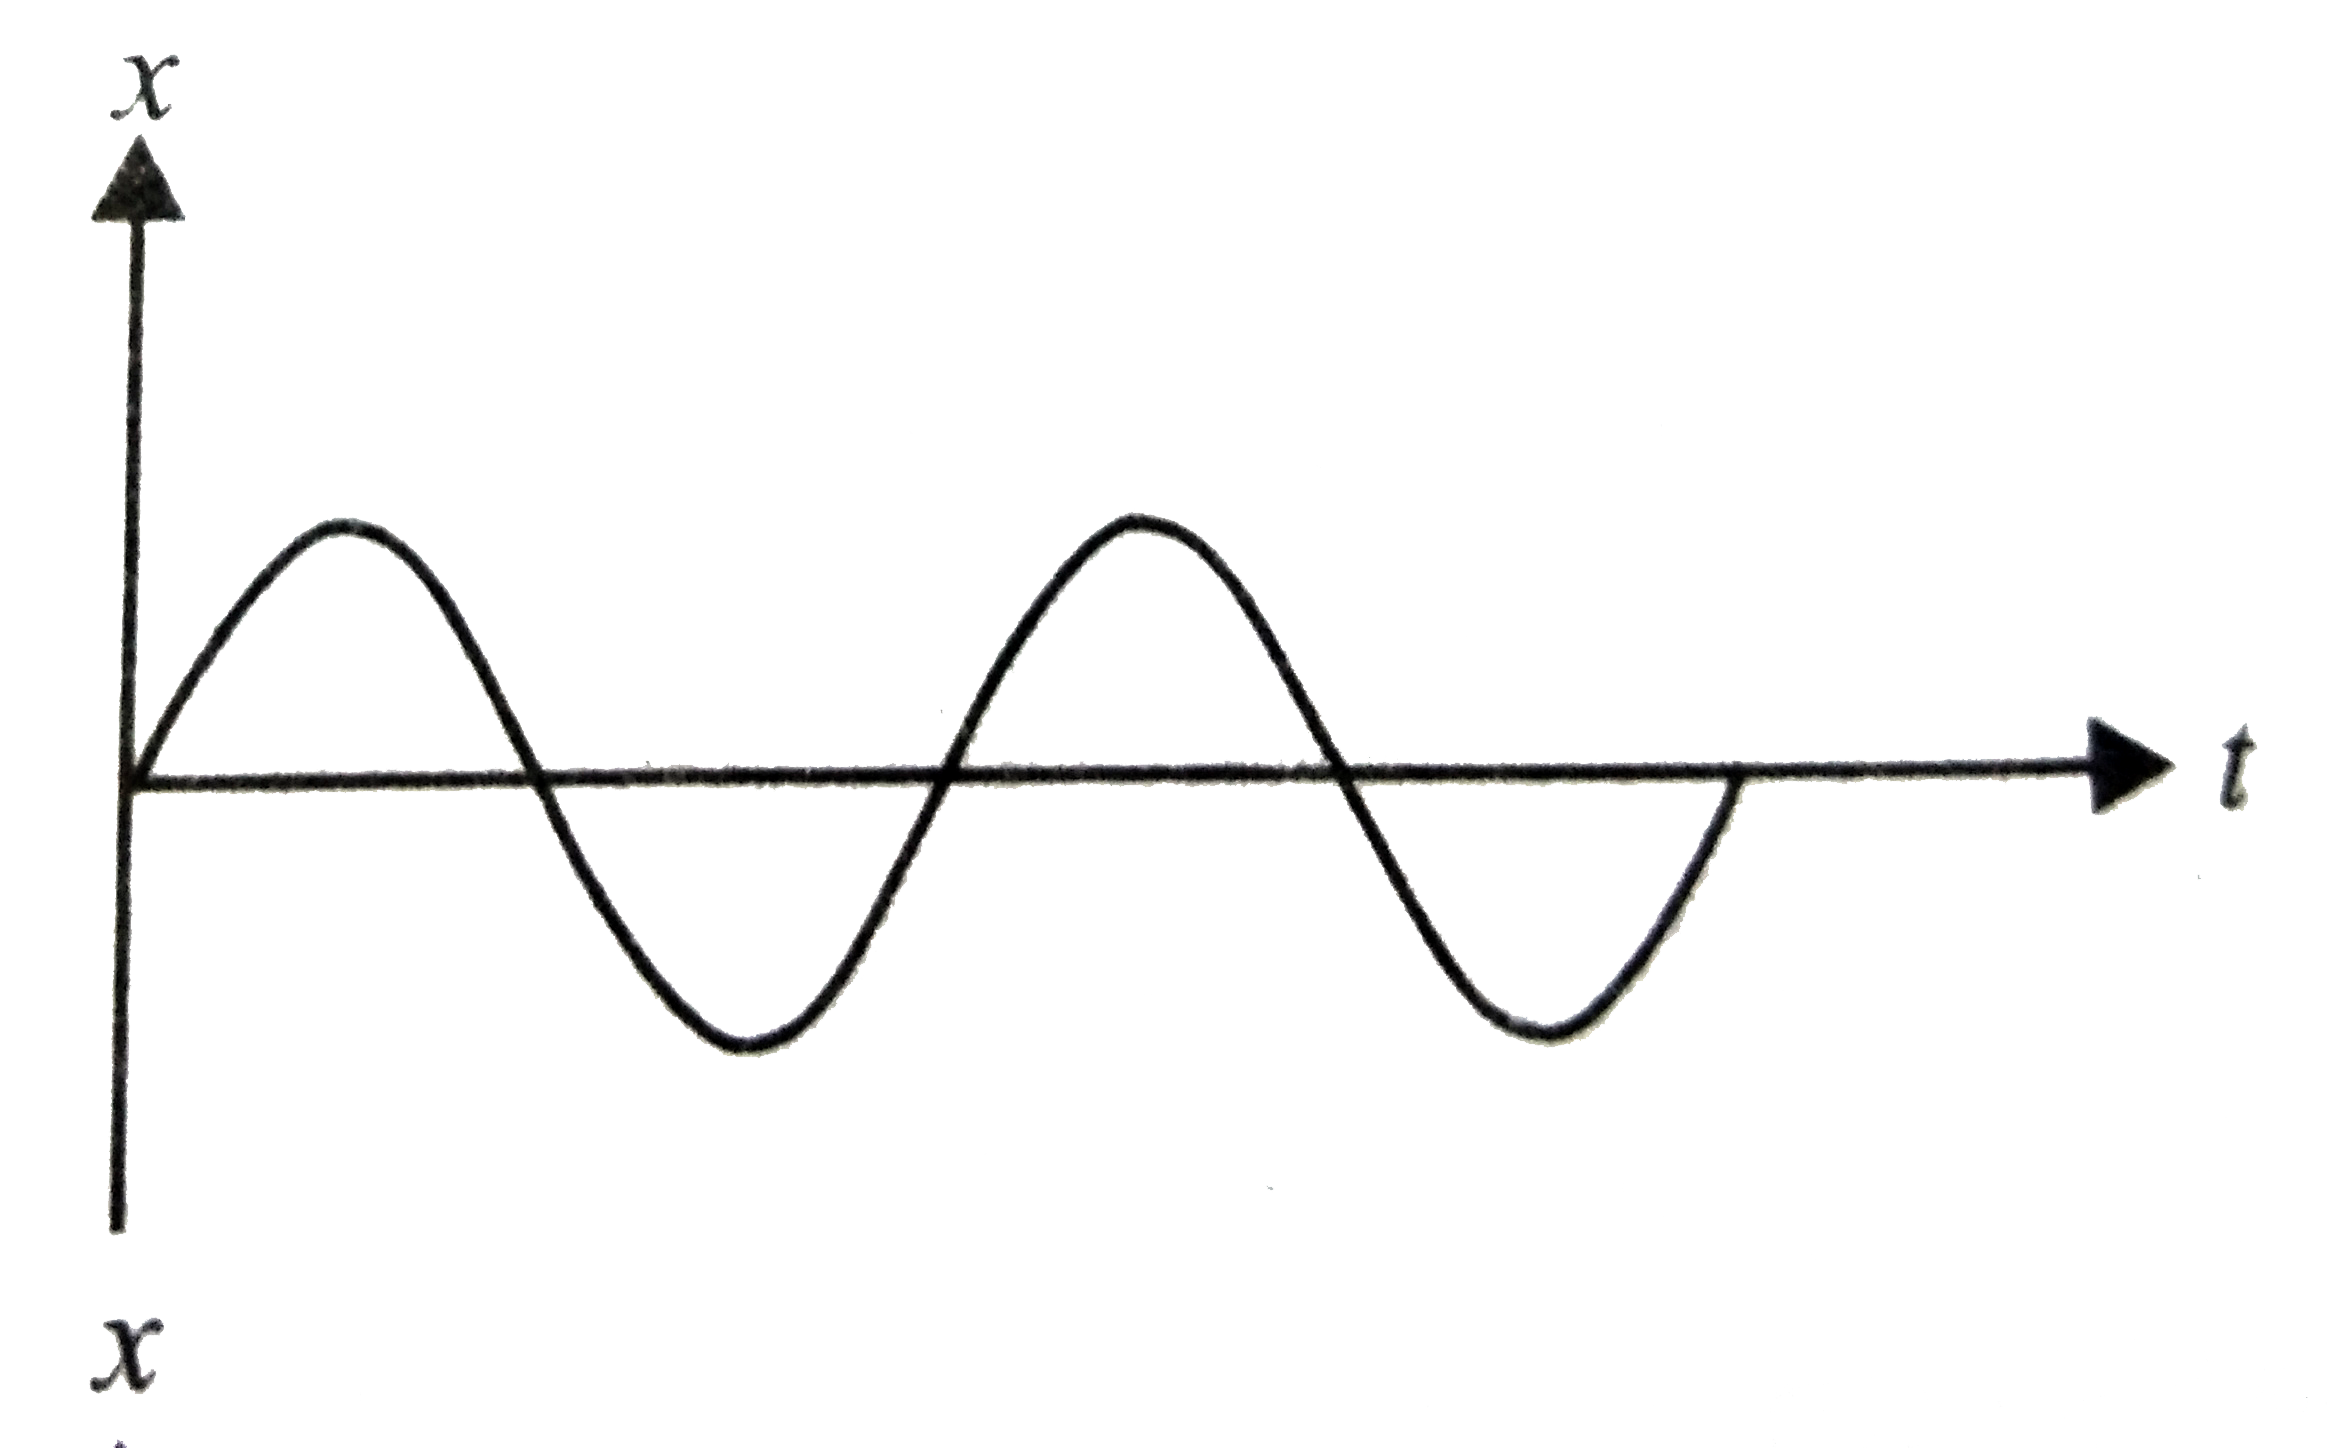 D
D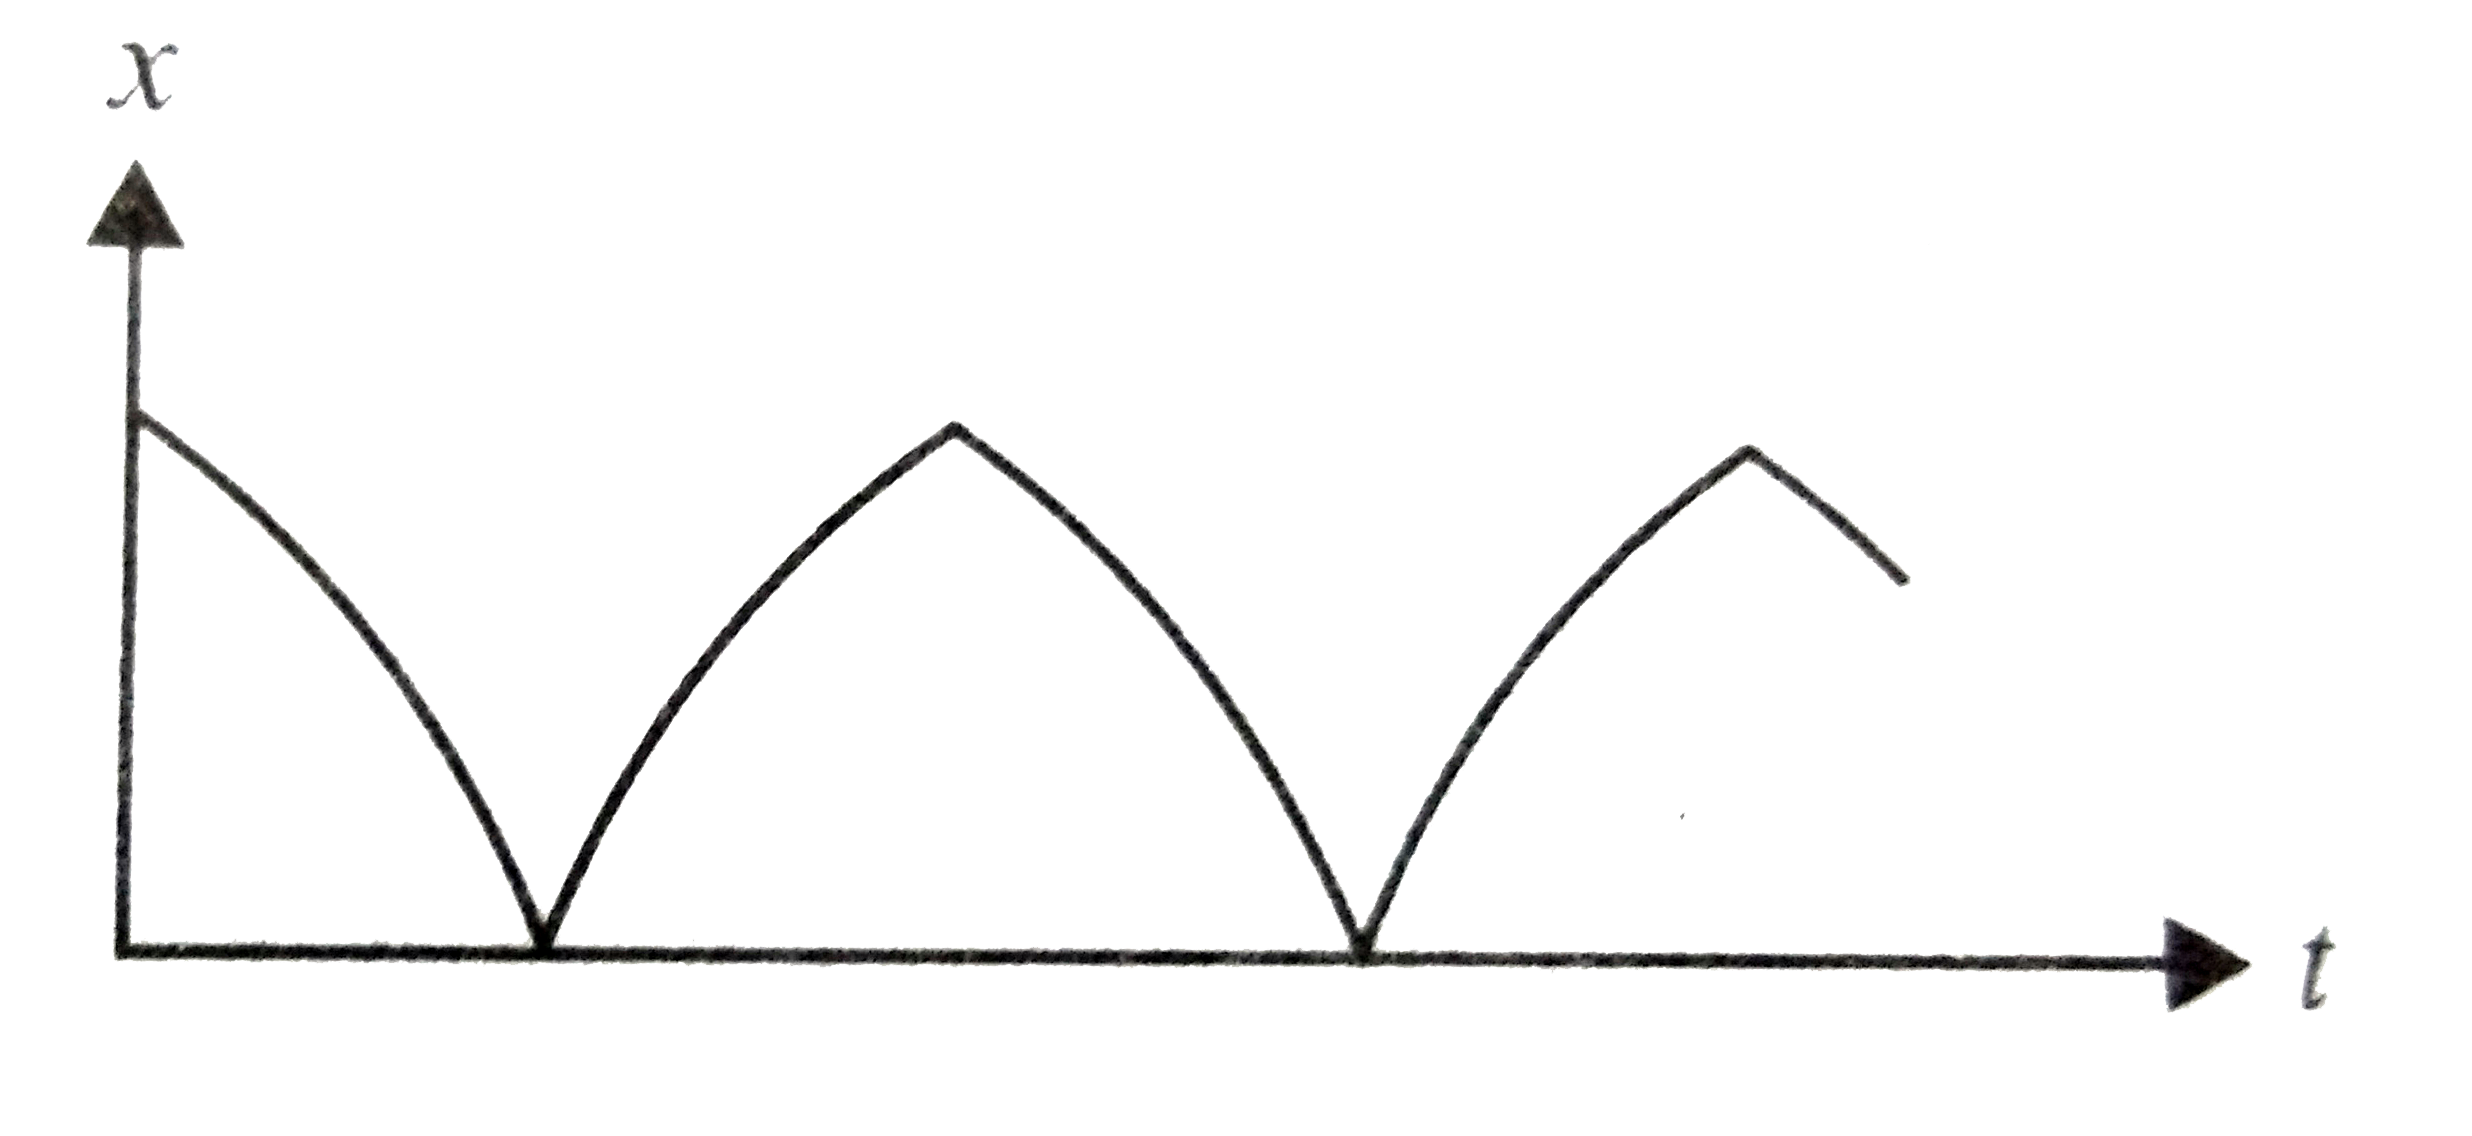
Which of the following measures can be used to control over population?
View SolutionWhich of the following will decrease the density of population in a given area ?
View SolutionWhich of the following distance time graphs is possible ?
View SolutionWhich of the following is correct regarding the consequences of over population ?
View SolutionWhich of the following equation is best representation of given graph's?
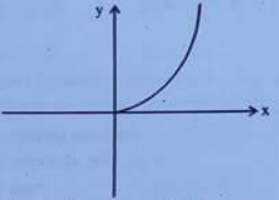
View SolutionWhich of the following equation is best representation of given graph's?
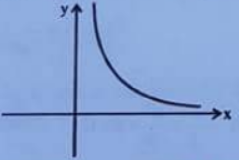
View Solution

