The soap bubble formed at the end of the tube is blown very slowly. Draw the graph between excess of pressure inside the bubble with time.
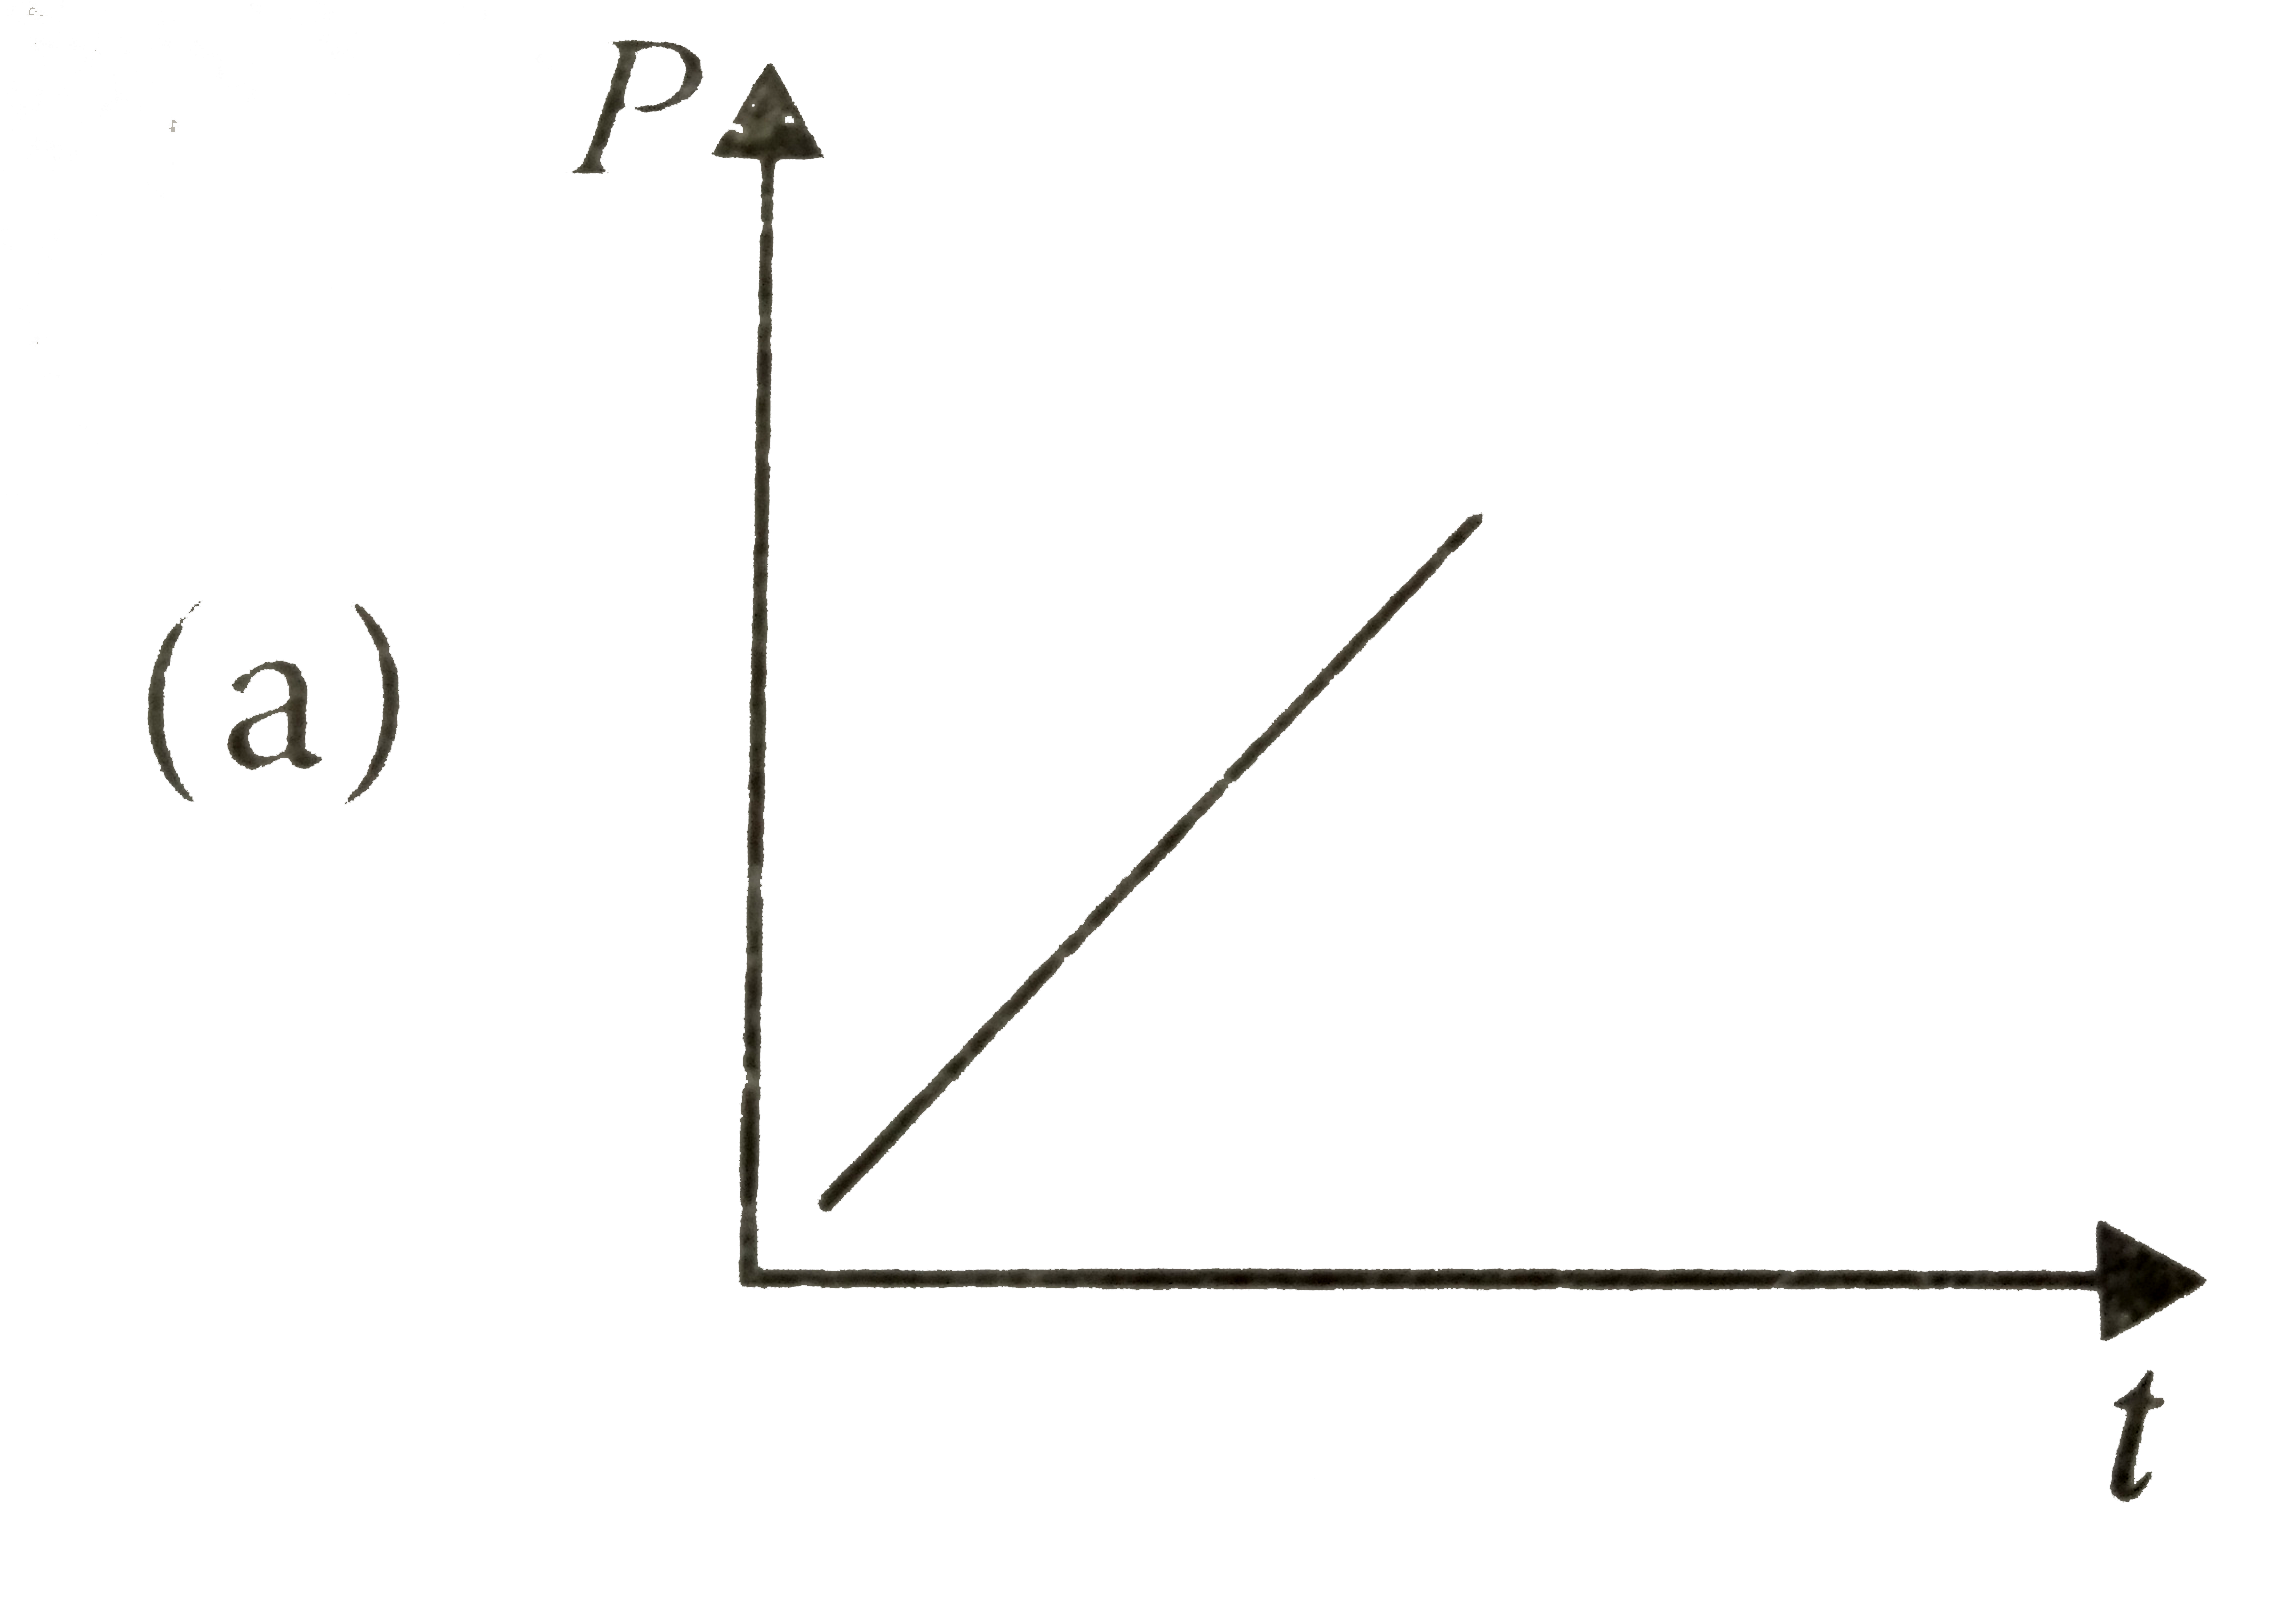
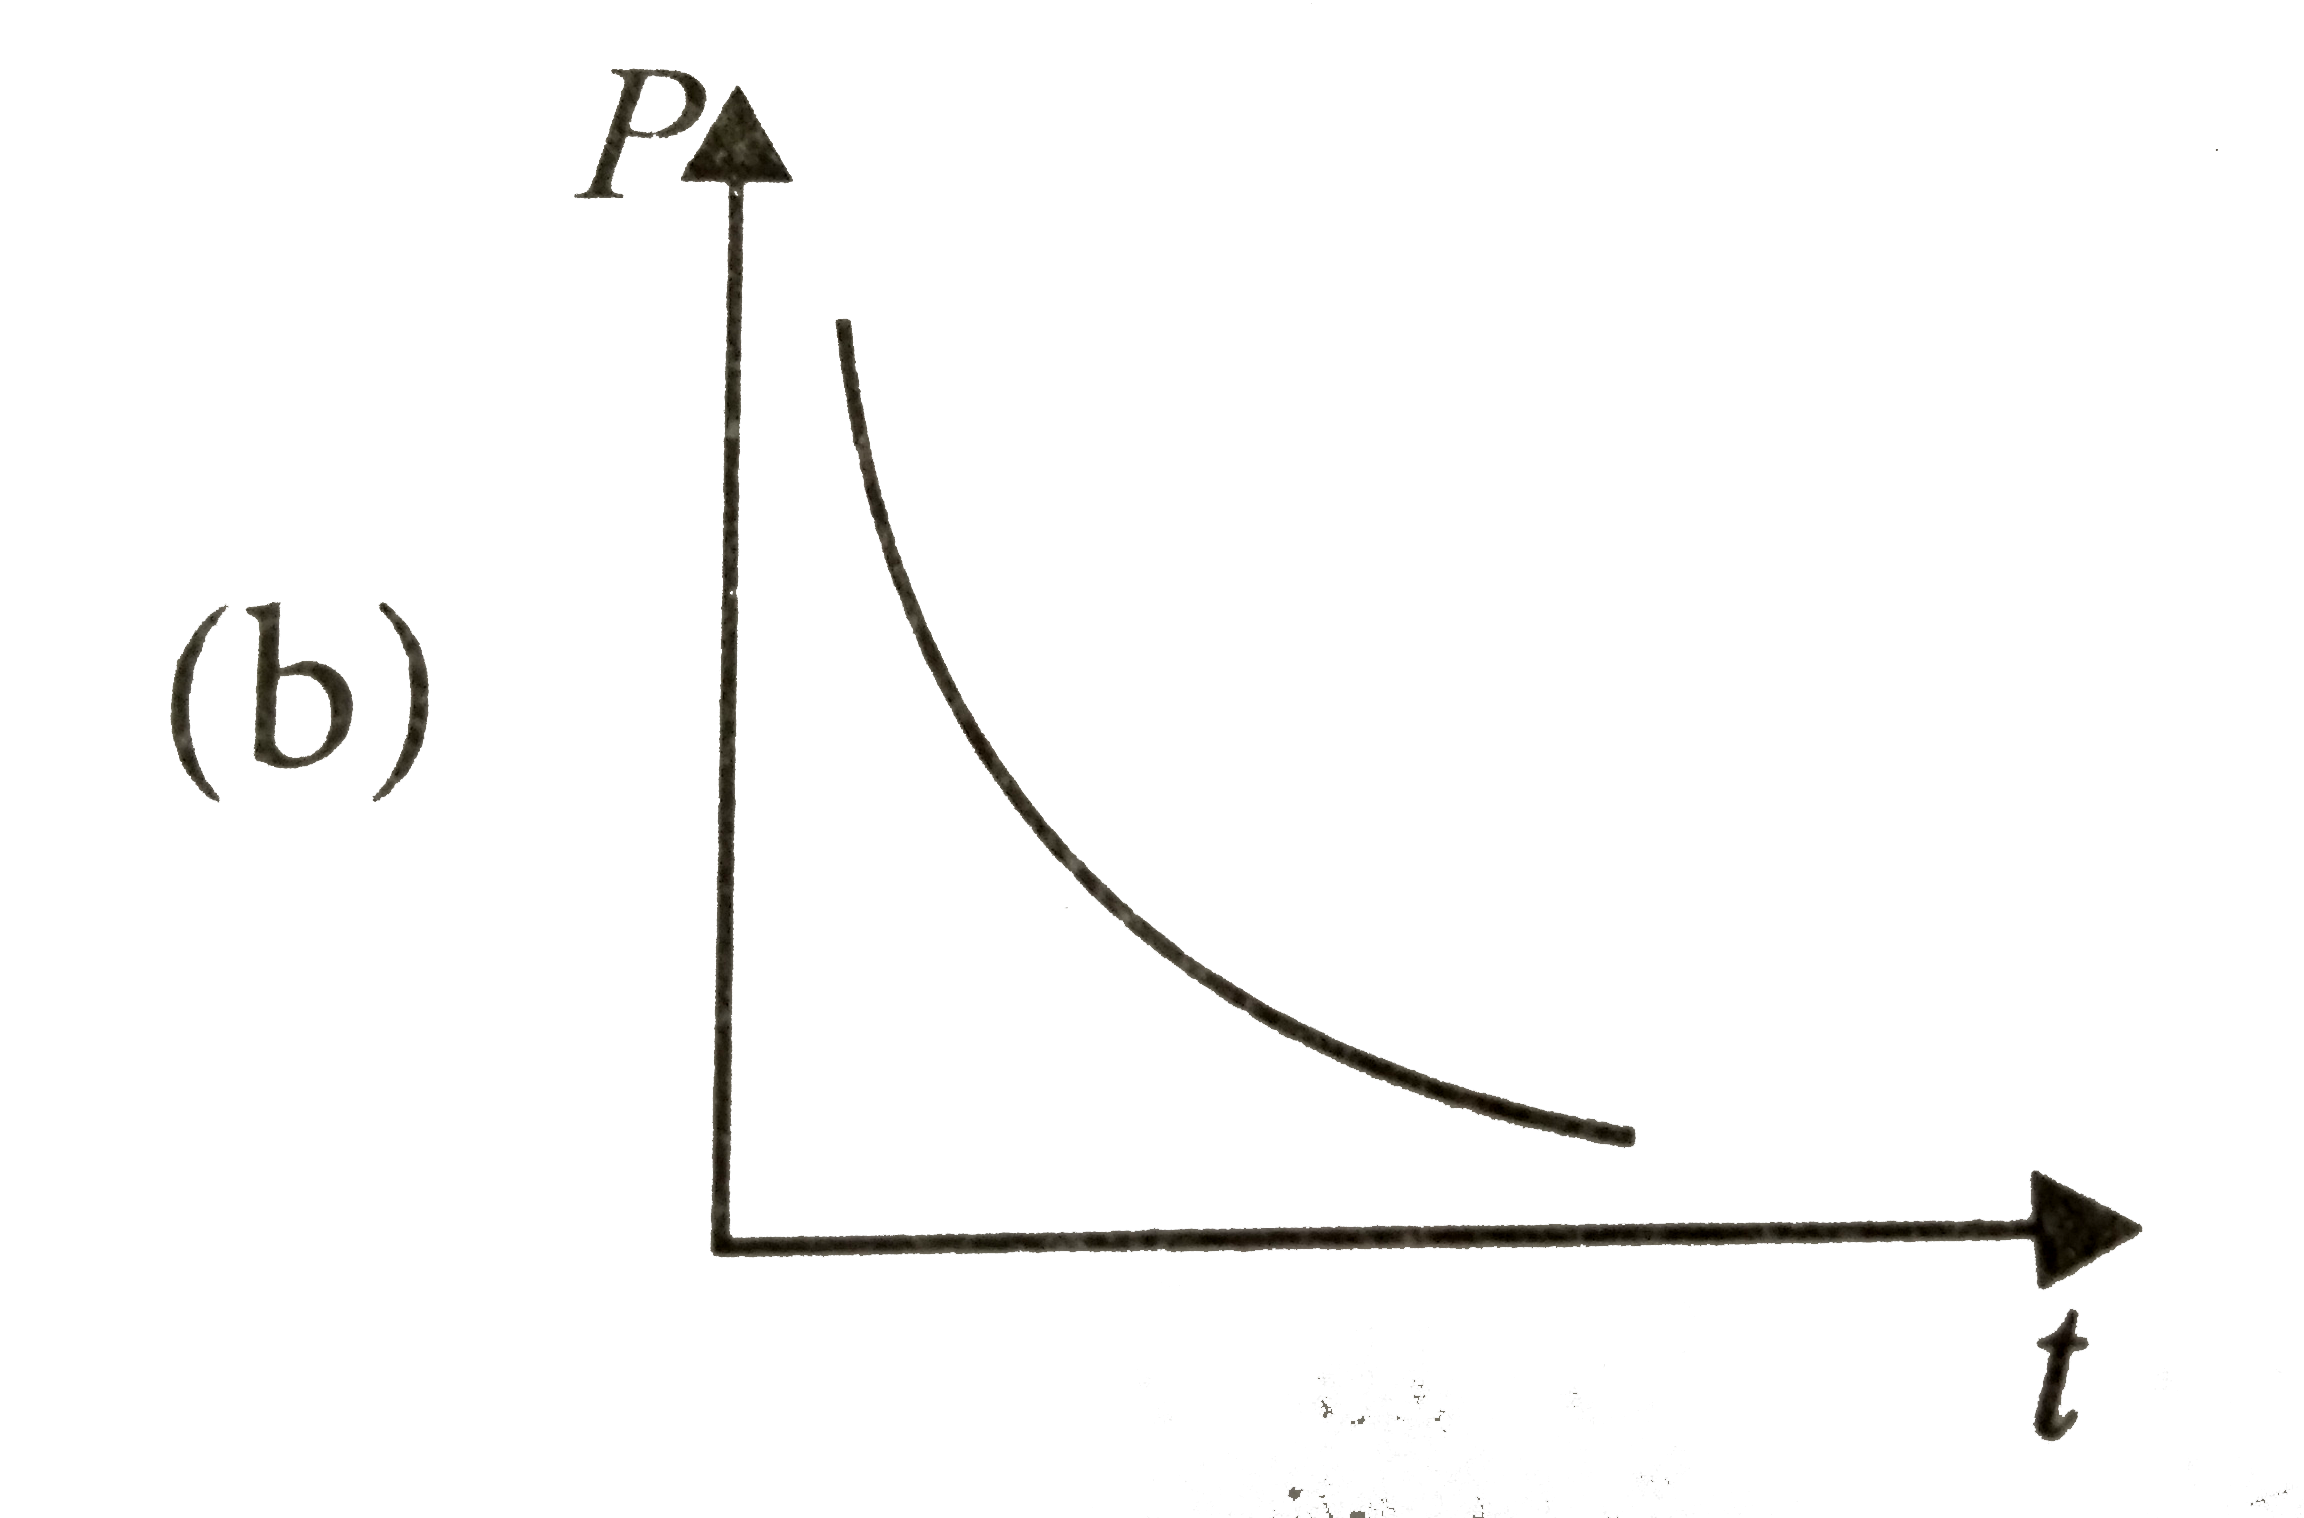
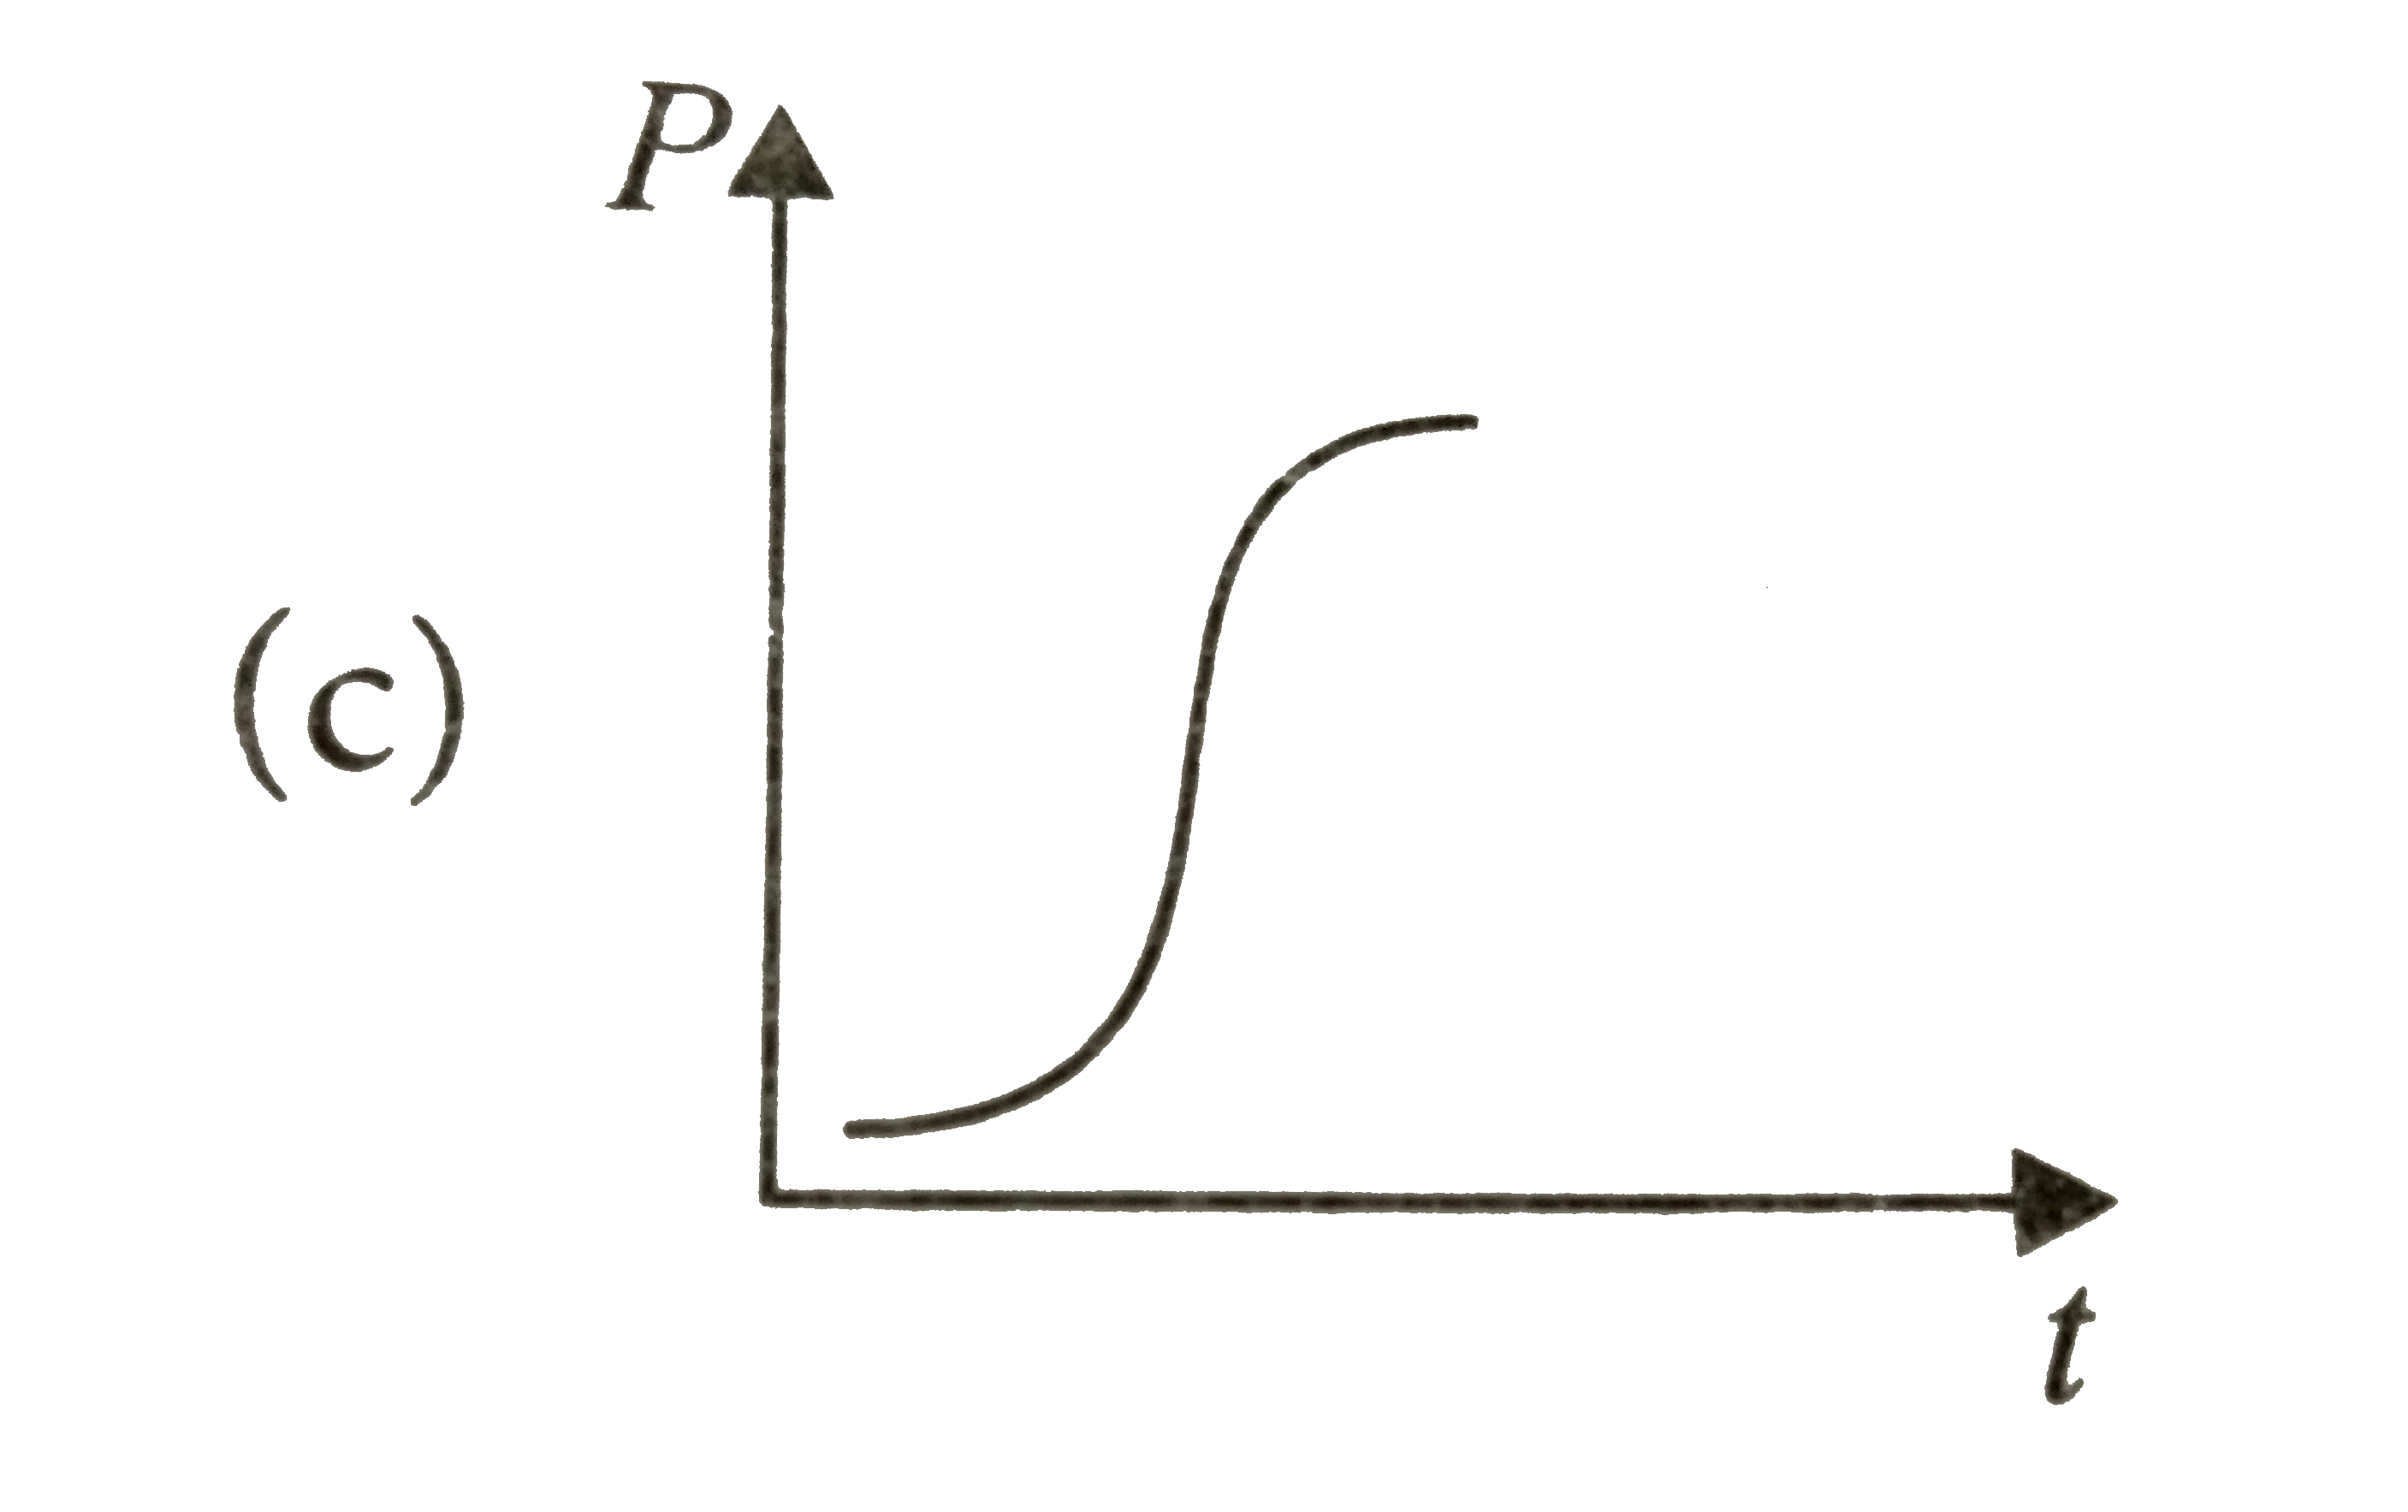
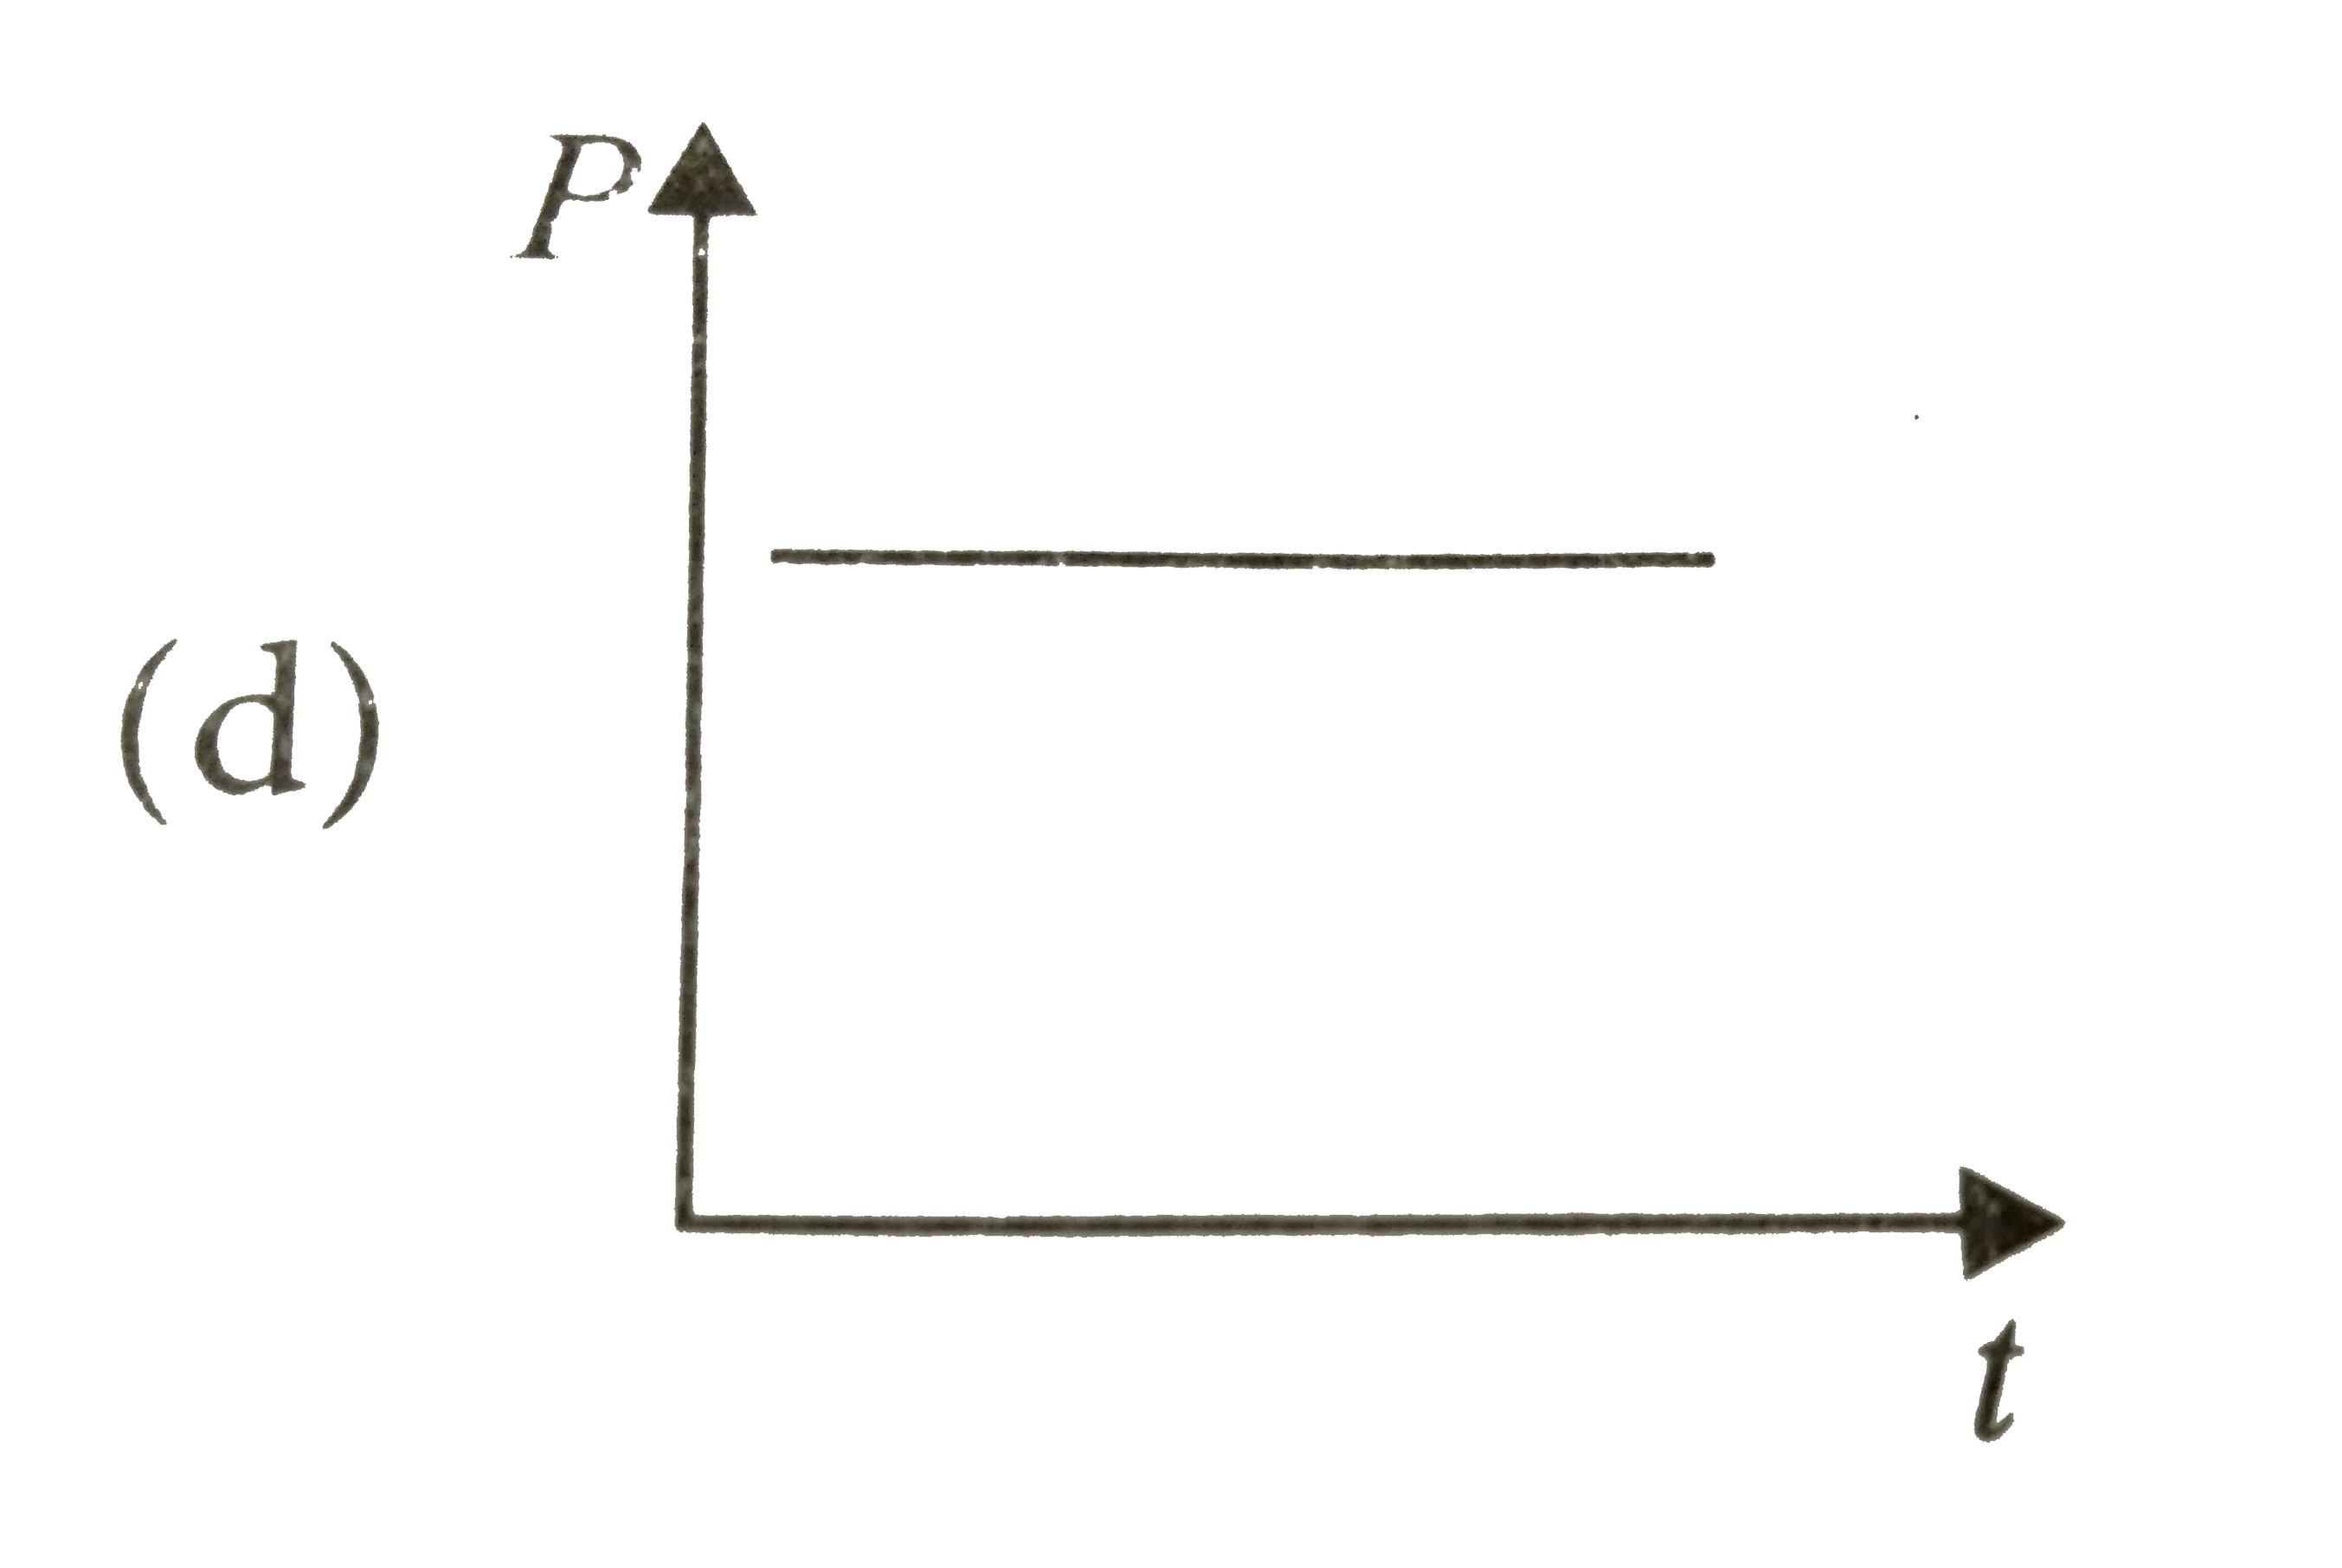
The correct Answer is:B
To solve the problem of drawing the graph between the excess pressure inside a soap bubble and time as the bubble is blown slowly, we can follow these steps:
1. Understanding Excess Pressure in a Soap Bubble:
- The excess pressure P inside a soap bubble of radius r is given by the formula:
P=4Sr
where S is the surface tension of the soap solution.
2. Behavior of the Bubble:
- When a soap bubble is blown slowly, the radius r of the bubble increases over time. As the radius increases, we can analyze how the excess pressure changes.
3. Relationship Between Pressure and Radius:
- From the formula, we can see that the excess pressure P is inversely proportional to the radius r:
P∝1r
- This means that as the radius r increases, the excess pressure P decreases.
4. Graphical Representation:
- Since P decreases as r increases, we can represent this relationship graphically.
- The graph of excess pressure P versus time t will show a decreasing trend. As time progresses and the bubble expands, the pressure will drop.
5. Shape of the Graph:
- The relationship is not linear; instead, it can be represented as a parabolic curve that approaches the time axis as time increases, indicating that the pressure approaches zero as the bubble continues to expand indefinitely.
6. Identifying the Correct Graph:
- Upon reviewing the options provided, the graph that shows a parabolic decrease of pressure over time is the correct one.
Conclusion:
The graph of excess pressure inside the soap bubble versus time will be a downward-opening parabola, reflecting the inverse relationship between pressure and radius as the bubble expands.
- The excess pressure P inside a soap bubble of radius r is given by the formula:
P=4Sr
where S is the surface tension of the soap solution.
- When a soap bubble is blown slowly, the radius r of the bubble increases over time. As the radius increases, we can analyze how the excess pressure changes.
- From the formula, we can see that the excess pressure P is inversely proportional to the radius r:
P∝1r
- This means that as the radius r increases, the excess pressure P decreases.
- Since P decreases as r increases, we can represent this relationship graphically.
- The graph of excess pressure P versus time t will show a decreasing trend. As time progresses and the bubble expands, the pressure will drop.
- The relationship is not linear; instead, it can be represented as a parabolic curve that approaches the time axis as time increases, indicating that the pressure approaches zero as the bubble continues to expand indefinitely.
- Upon reviewing the options provided, the graph that shows a parabolic decrease of pressure over time is the correct one.
The graph of excess pressure inside the soap bubble versus time will be a downward-opening parabola, reflecting the inverse relationship between pressure and radius as the bubble expands.
Topper's Solved these Questions
- MECHANICAL PROPERTIES OF FLUIDSBOOK - NCERT FINGERTPS ENGLISHCHAPTER - MECHANICAL PROPERTIES OF FLUIDSEXERCISE - Higher Order Thinking Skills
8 Videos
- MECHANICAL PROPERTIES OF FLUIDSBOOK - NCERT FINGERTPS ENGLISHCHAPTER - MECHANICAL PROPERTIES OF FLUIDSEXERCISE - Exemplar Problems
5 Videos
- LAWS OF MOTIONBOOK - NCERT FINGERTPS ENGLISHCHAPTER - LAWS OF MOTIONEXERCISE - Assertion And Reason
15 Videos
- MECHANICAL PROPERTIES OF SOLIDSBOOK - NCERT FINGERTPS ENGLISHCHAPTER - MECHANICAL PROPERTIES OF SOLIDSEXERCISE - Assertion And Reason
15 Videos
Similar Questions
The excess pressure inside a soap bubble is
View SolutionA soap bubble is blown with the help of mechanical pump at the mouth of a tube. The pump produces a cartain increase per minute in the volume of the bubble, irrespective of its internal pressure. The graph between the pressure inside the soap bubble and time t will be
View Solution
Knowledge Check
Two soap bubbles A and B have radii r1andr2 respectively. If r1<r2 than the excess pressure inside
Abubbles A and B will be equalBbubbles A will be less than that in bubbles BCbubbles A will be greater than that in bubble BDbubbles A and B will be zero.
The ratio of radii of two bubbles is 2:1. What is the ratio of excess pressures inside them ?
View SolutionAn air bubble of radius 1 mm is located at a depth of 20 cm below water level. The excess pressure inside the bubble above the atmospheric pressure is [Given, the surface tension of water is 0.075 Nm−1 and density is 1000 kg m−3]
View SolutionDescribe an experiment to demonstrate the excess pressure inside a soap bubble.
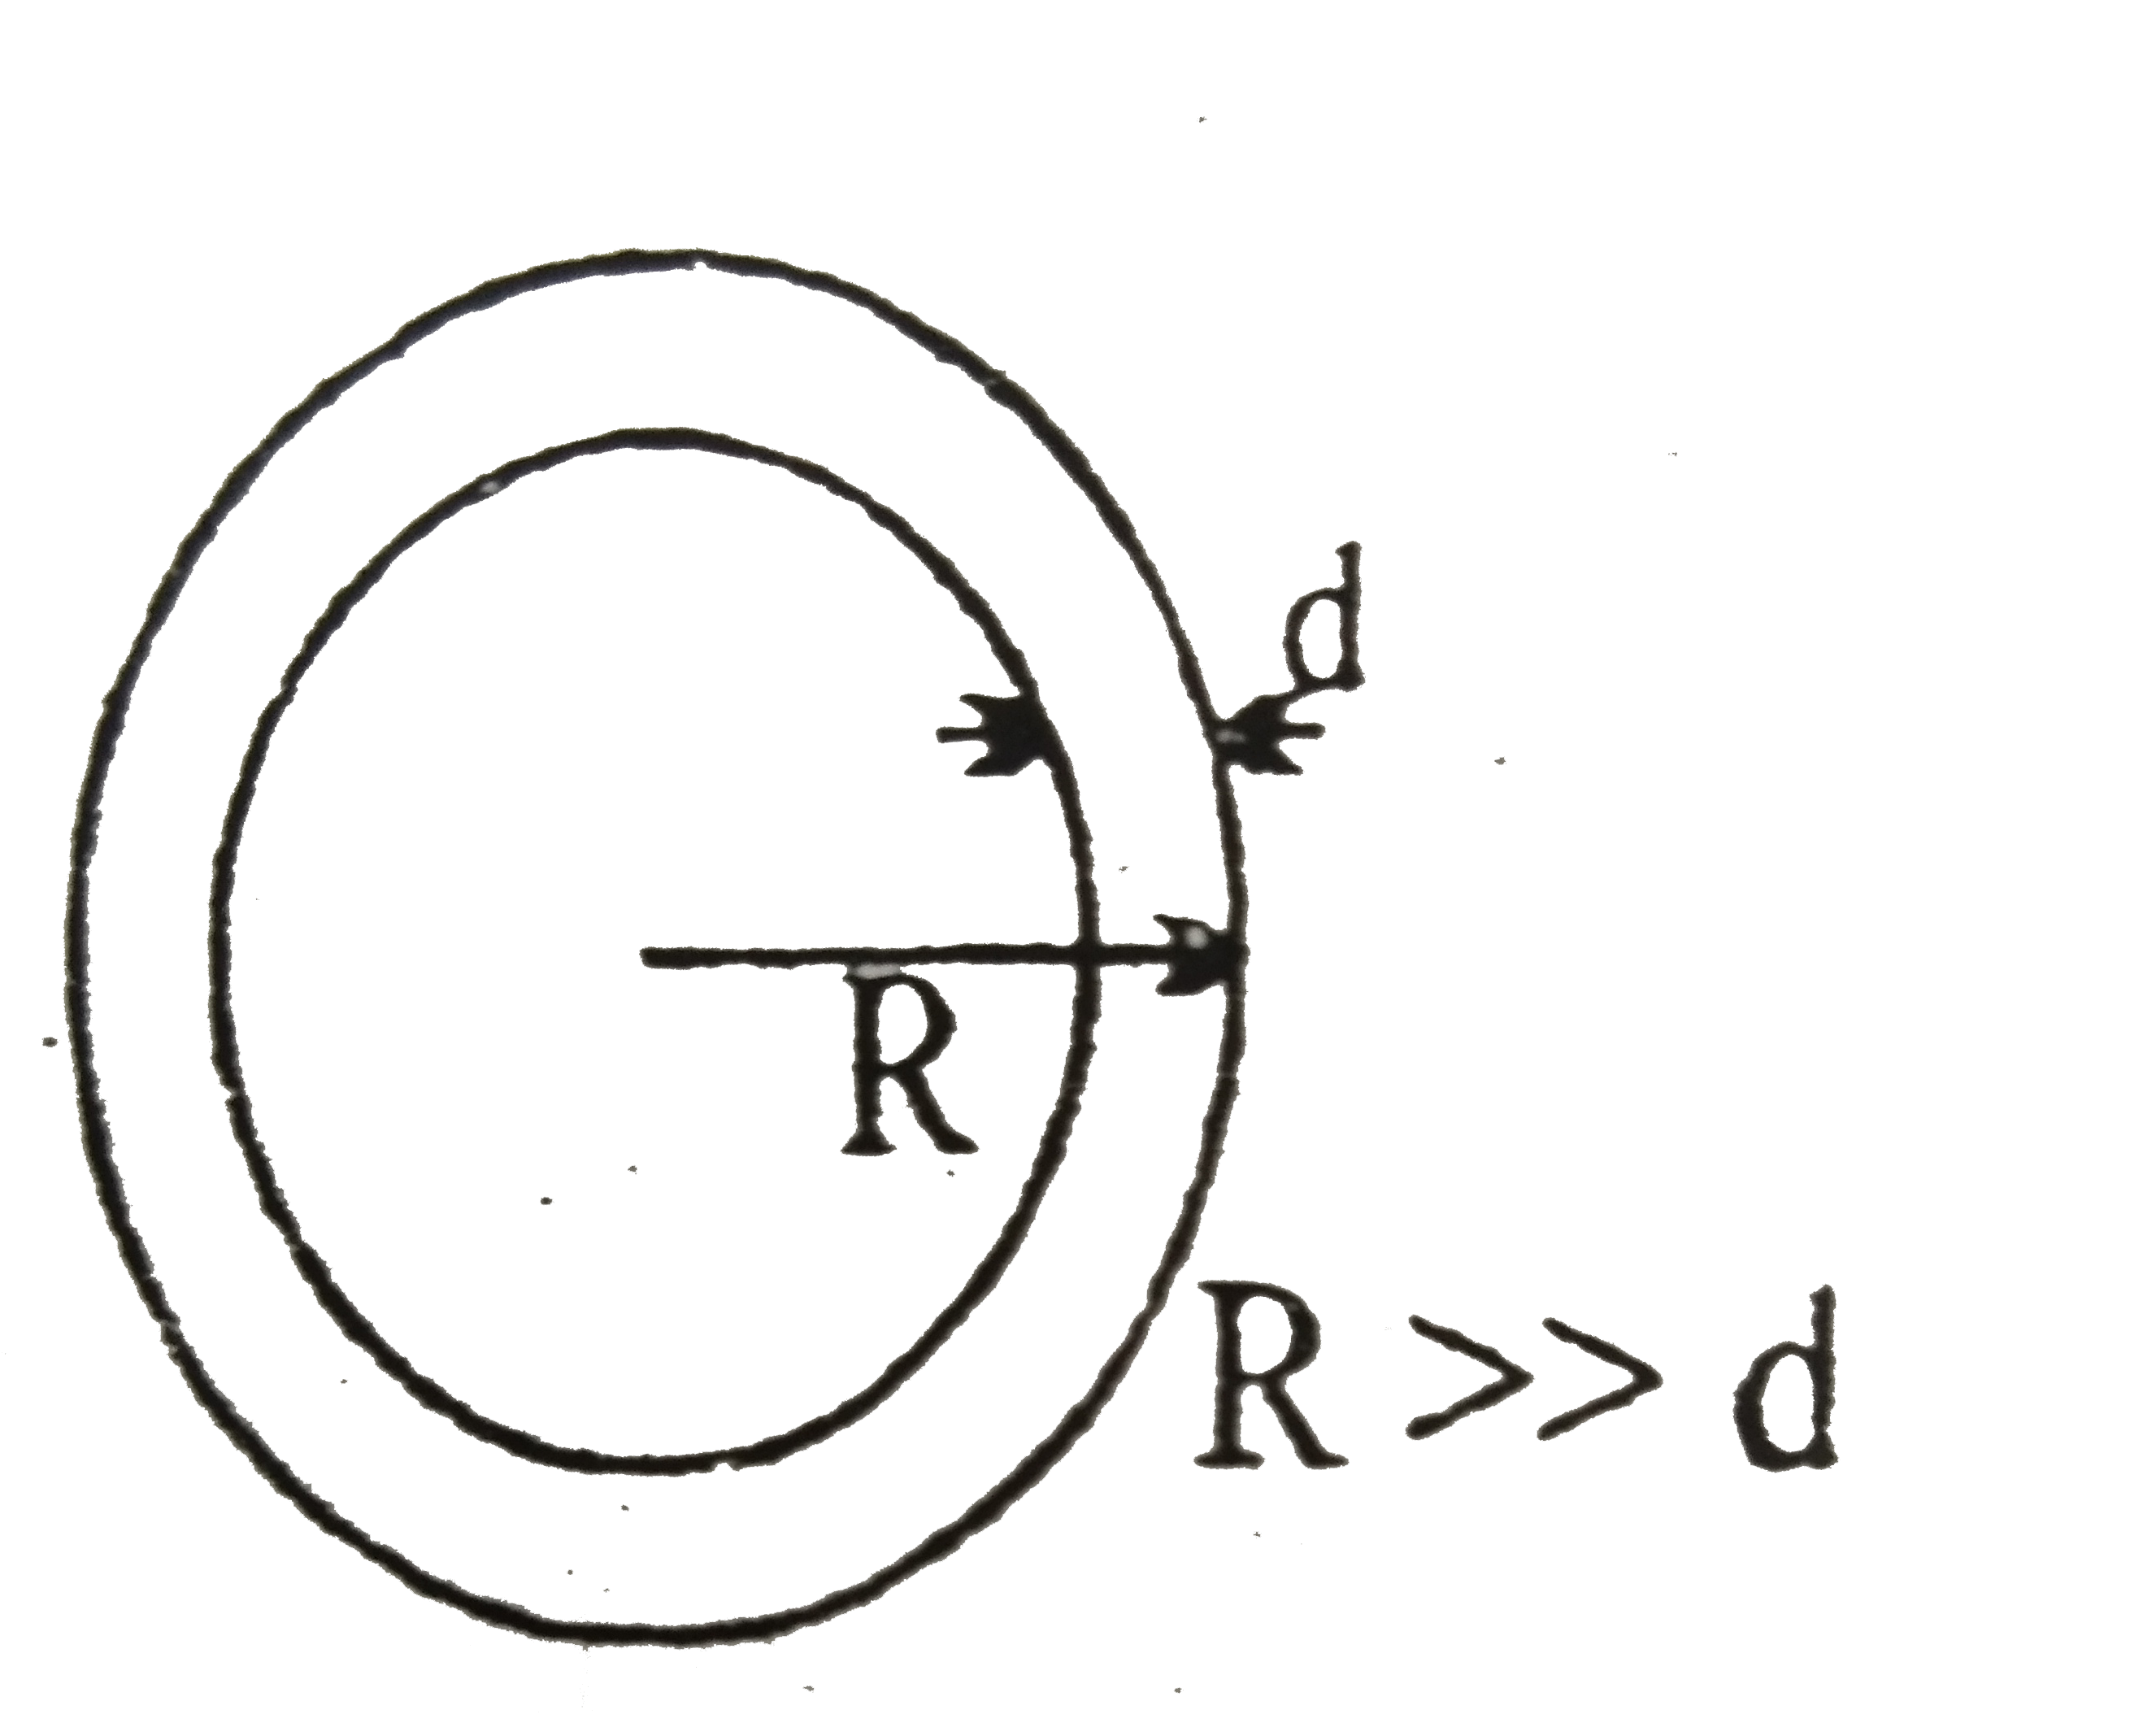
View SolutionA soap bubble has radius R and thickness d(<<R) as shown. It colapses into a spherical drop. The ratio of excess pressure in the drop to the excess pressure inside the bubble is
View SolutionIf R is the radius of a soap bubble and S its surface tension, then the excess pressure inside is
View SolutionStatement I: While blowing a soap bubble. to increase the size of soap bubble, we have to increase the air pressure within the soap bubble.
Statement II: To increase the size of soap bubble more air has to be pushed into the bubble.
View SolutionWhen an air bubble rise from the bottom of a deep lake to a point just below the water surface, the pressure of air inside the bubble
View Solution
