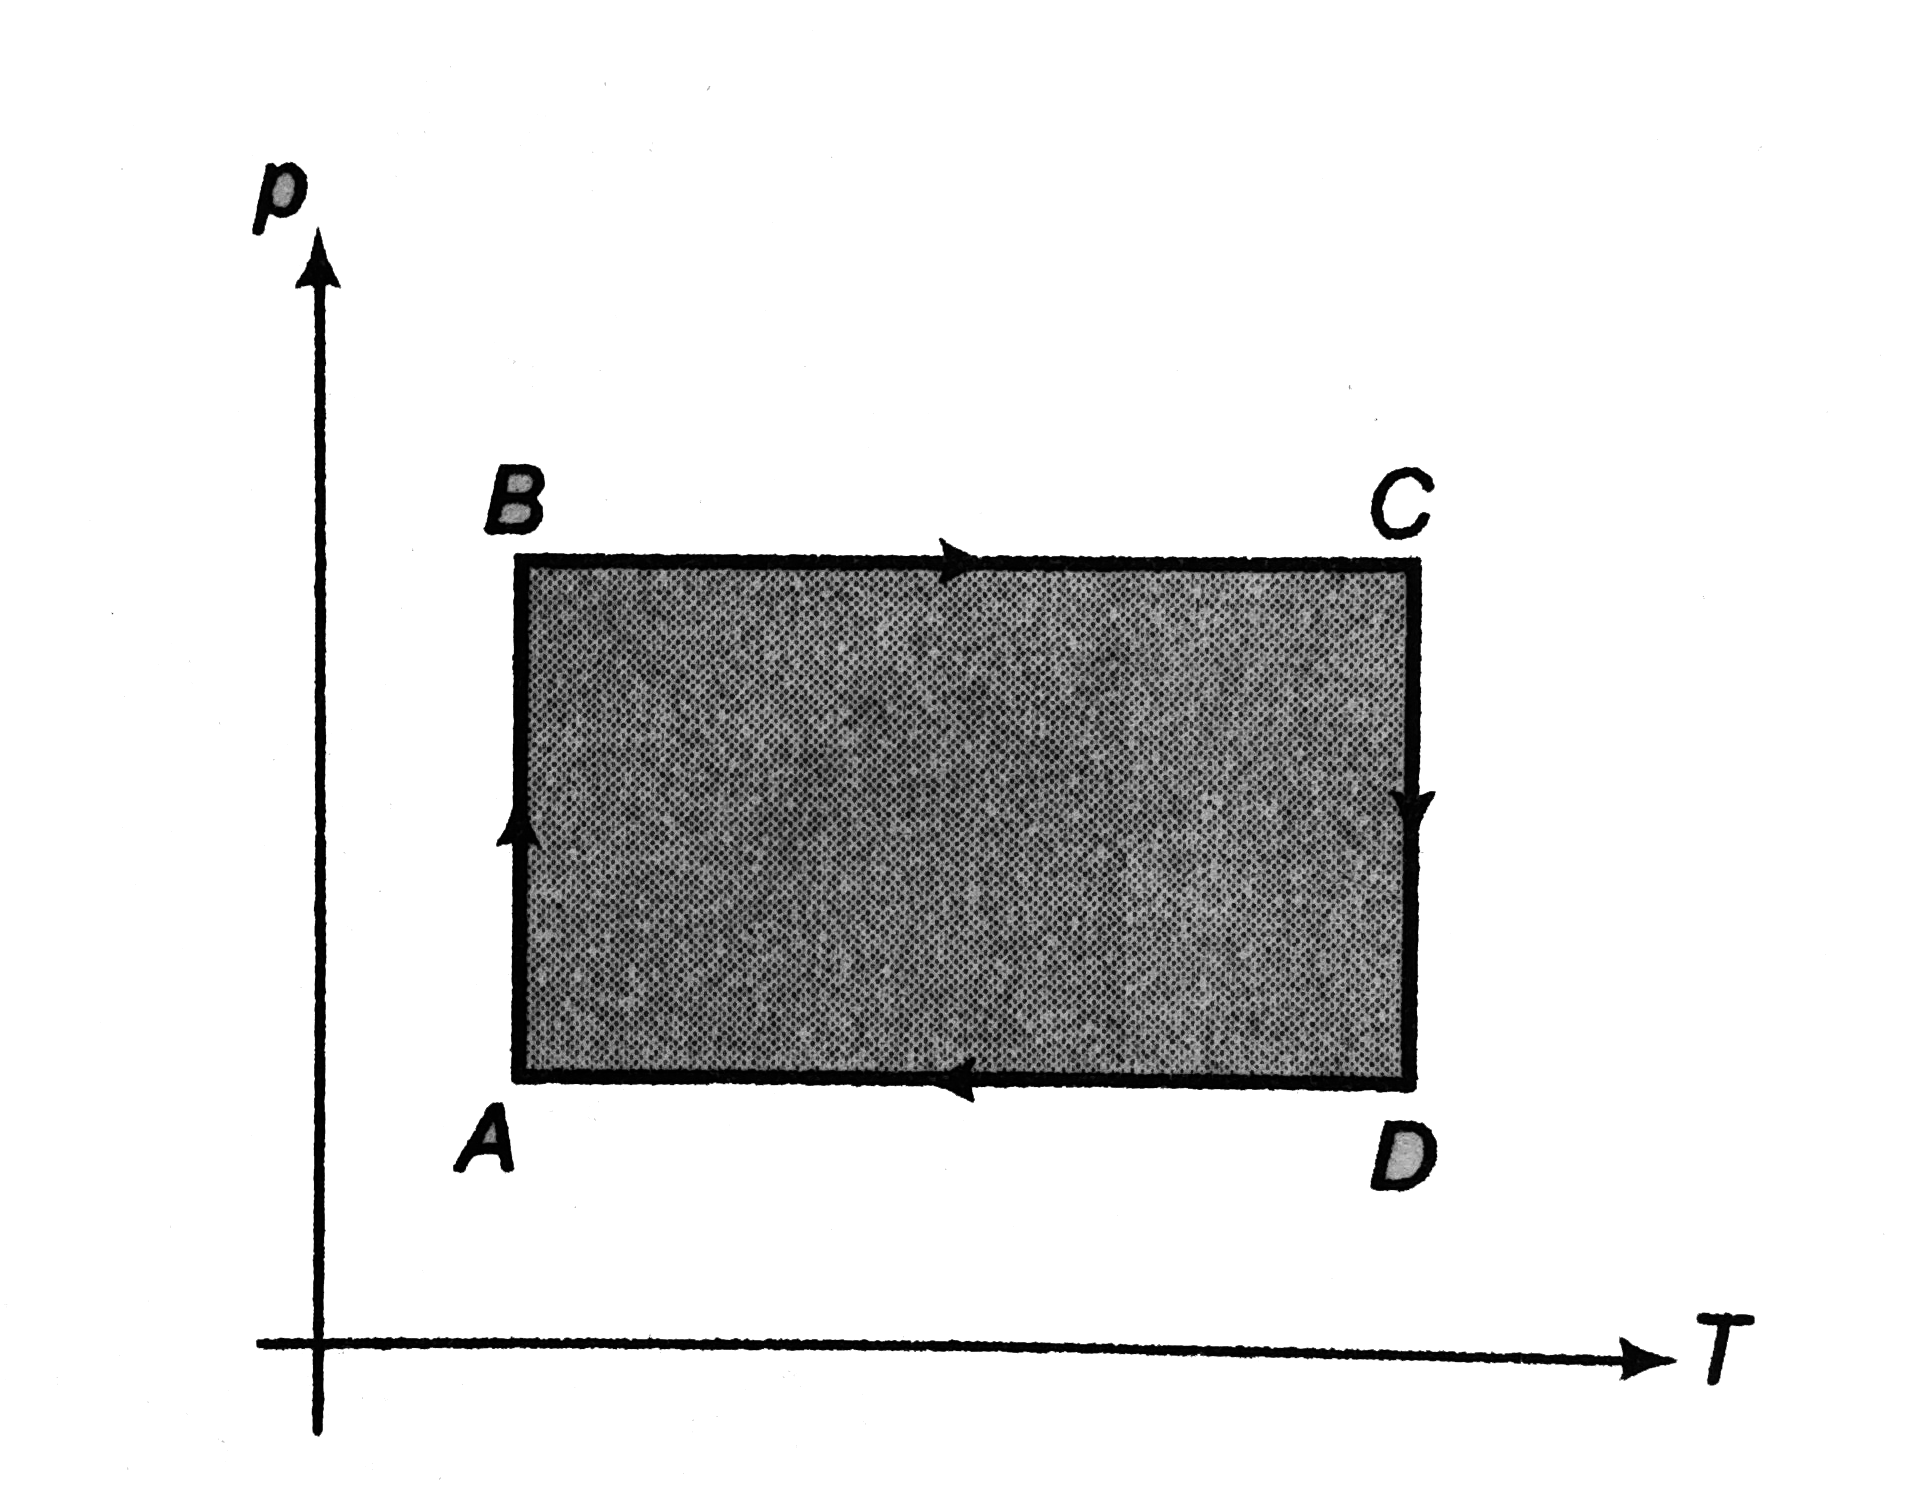
Plot P-V, V-T and p-T graph correspongidng to the P-T graph for an ideal gas shown in figure.
Text Solution
Graph- 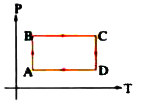
|
Topper's Solved these Questions
- THERMODYNAMICSBOOK - AAKASH SERIESCHAPTER - THERMODYNAMICSEXERCISE - NUMERICAL EXERCISE (LEVEL-1)
19 Videos
- THERMODYNAMICSBOOK - AAKASH SERIESCHAPTER - THERMODYNAMICSEXERCISE - NUMERICAL EXERCISE (LEVEL-2)
35 Videos
- THERMODYNAMICSBOOK - AAKASH SERIESCHAPTER - THERMODYNAMICSEXERCISE - SHORT ANSWER TYPE QUESTIONS
8 Videos
- THERMAL PROPERTIES OF MATTERBOOK - AAKASH SERIESCHAPTER - THERMAL PROPERTIES OF MATTEREXERCISE - ADDITIONAL PRACTICE EXERCISE (LEVEL - II) PRACTICE SHEET (ADVANCED) Integer/Subjective Type Questions
2 Videos
- THERMOMETRY BOOK - AAKASH SERIESCHAPTER - THERMOMETRY EXERCISE - Numerical Exercise (LEVEL- 1)
11 Videos
Similar Questions
Knowledge Check
What is the corresponding P-T diagram, If the P-T diagram for an ideal gas is as shown in the figure ?
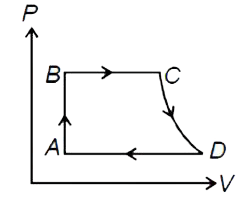 A
A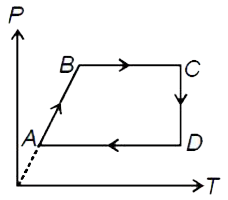 B
B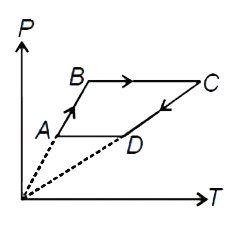 C
C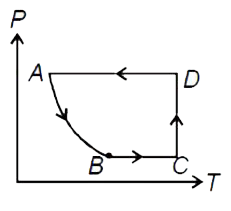 D
D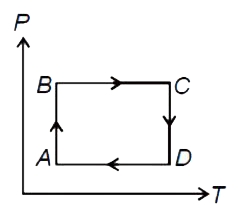
The P−T graph for the given mass of an ideal gas is shown in figure. Then the volume
_E01_022_Q01.png) AincreasesBdecreasesCremains constantDdata insuficient
AincreasesBdecreasesCremains constantDdata insuficientFor V versus T curves at constant pressure P1andP2 for and ideal gas shown in figure-
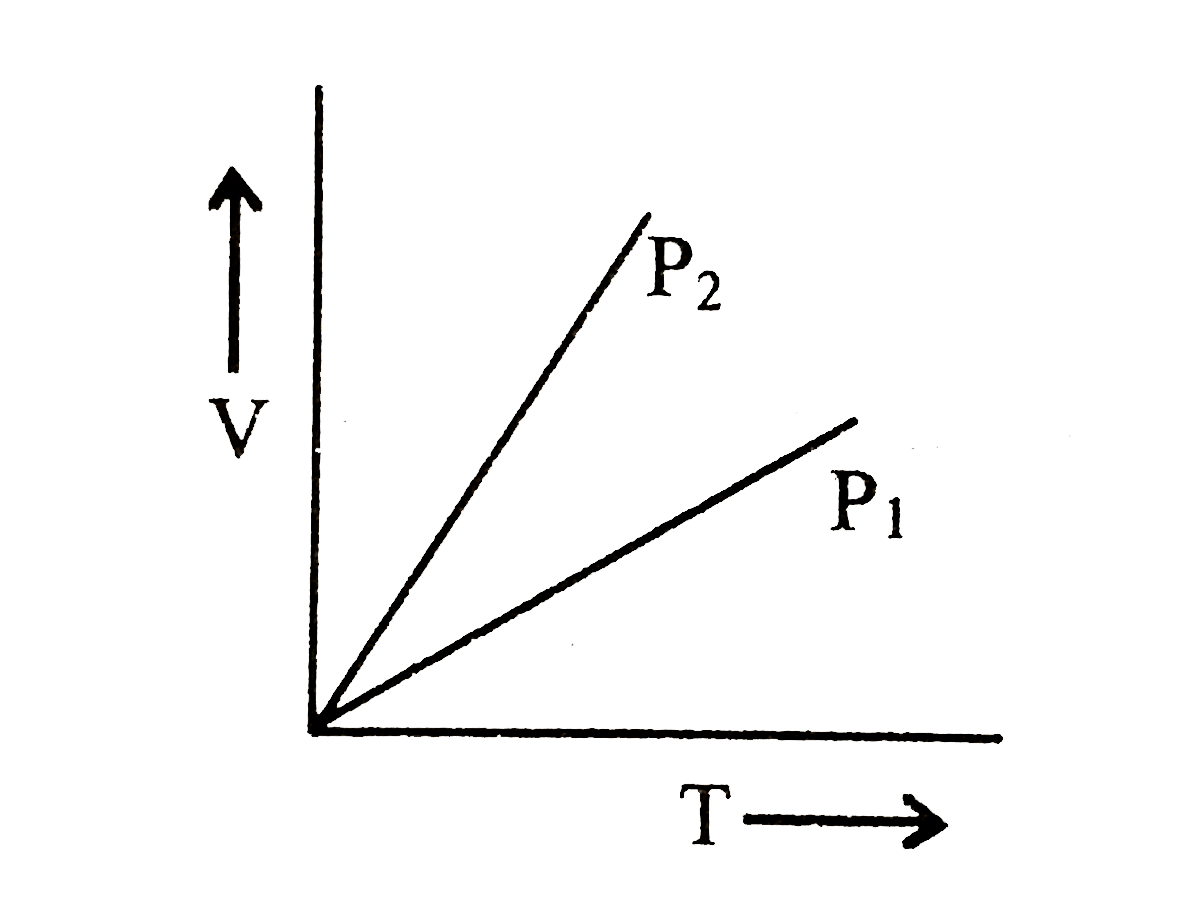 AP1>P2BP1<P2CP1=P2DP1P2
For V versus T curves at constant pressure P1andP2 for and ideal gas shown in figure-

View SolutionOn the P−T graph of an ideal gas, choose the correct option(s):
View SolutionIn the V-T graph shown in figure match the following.
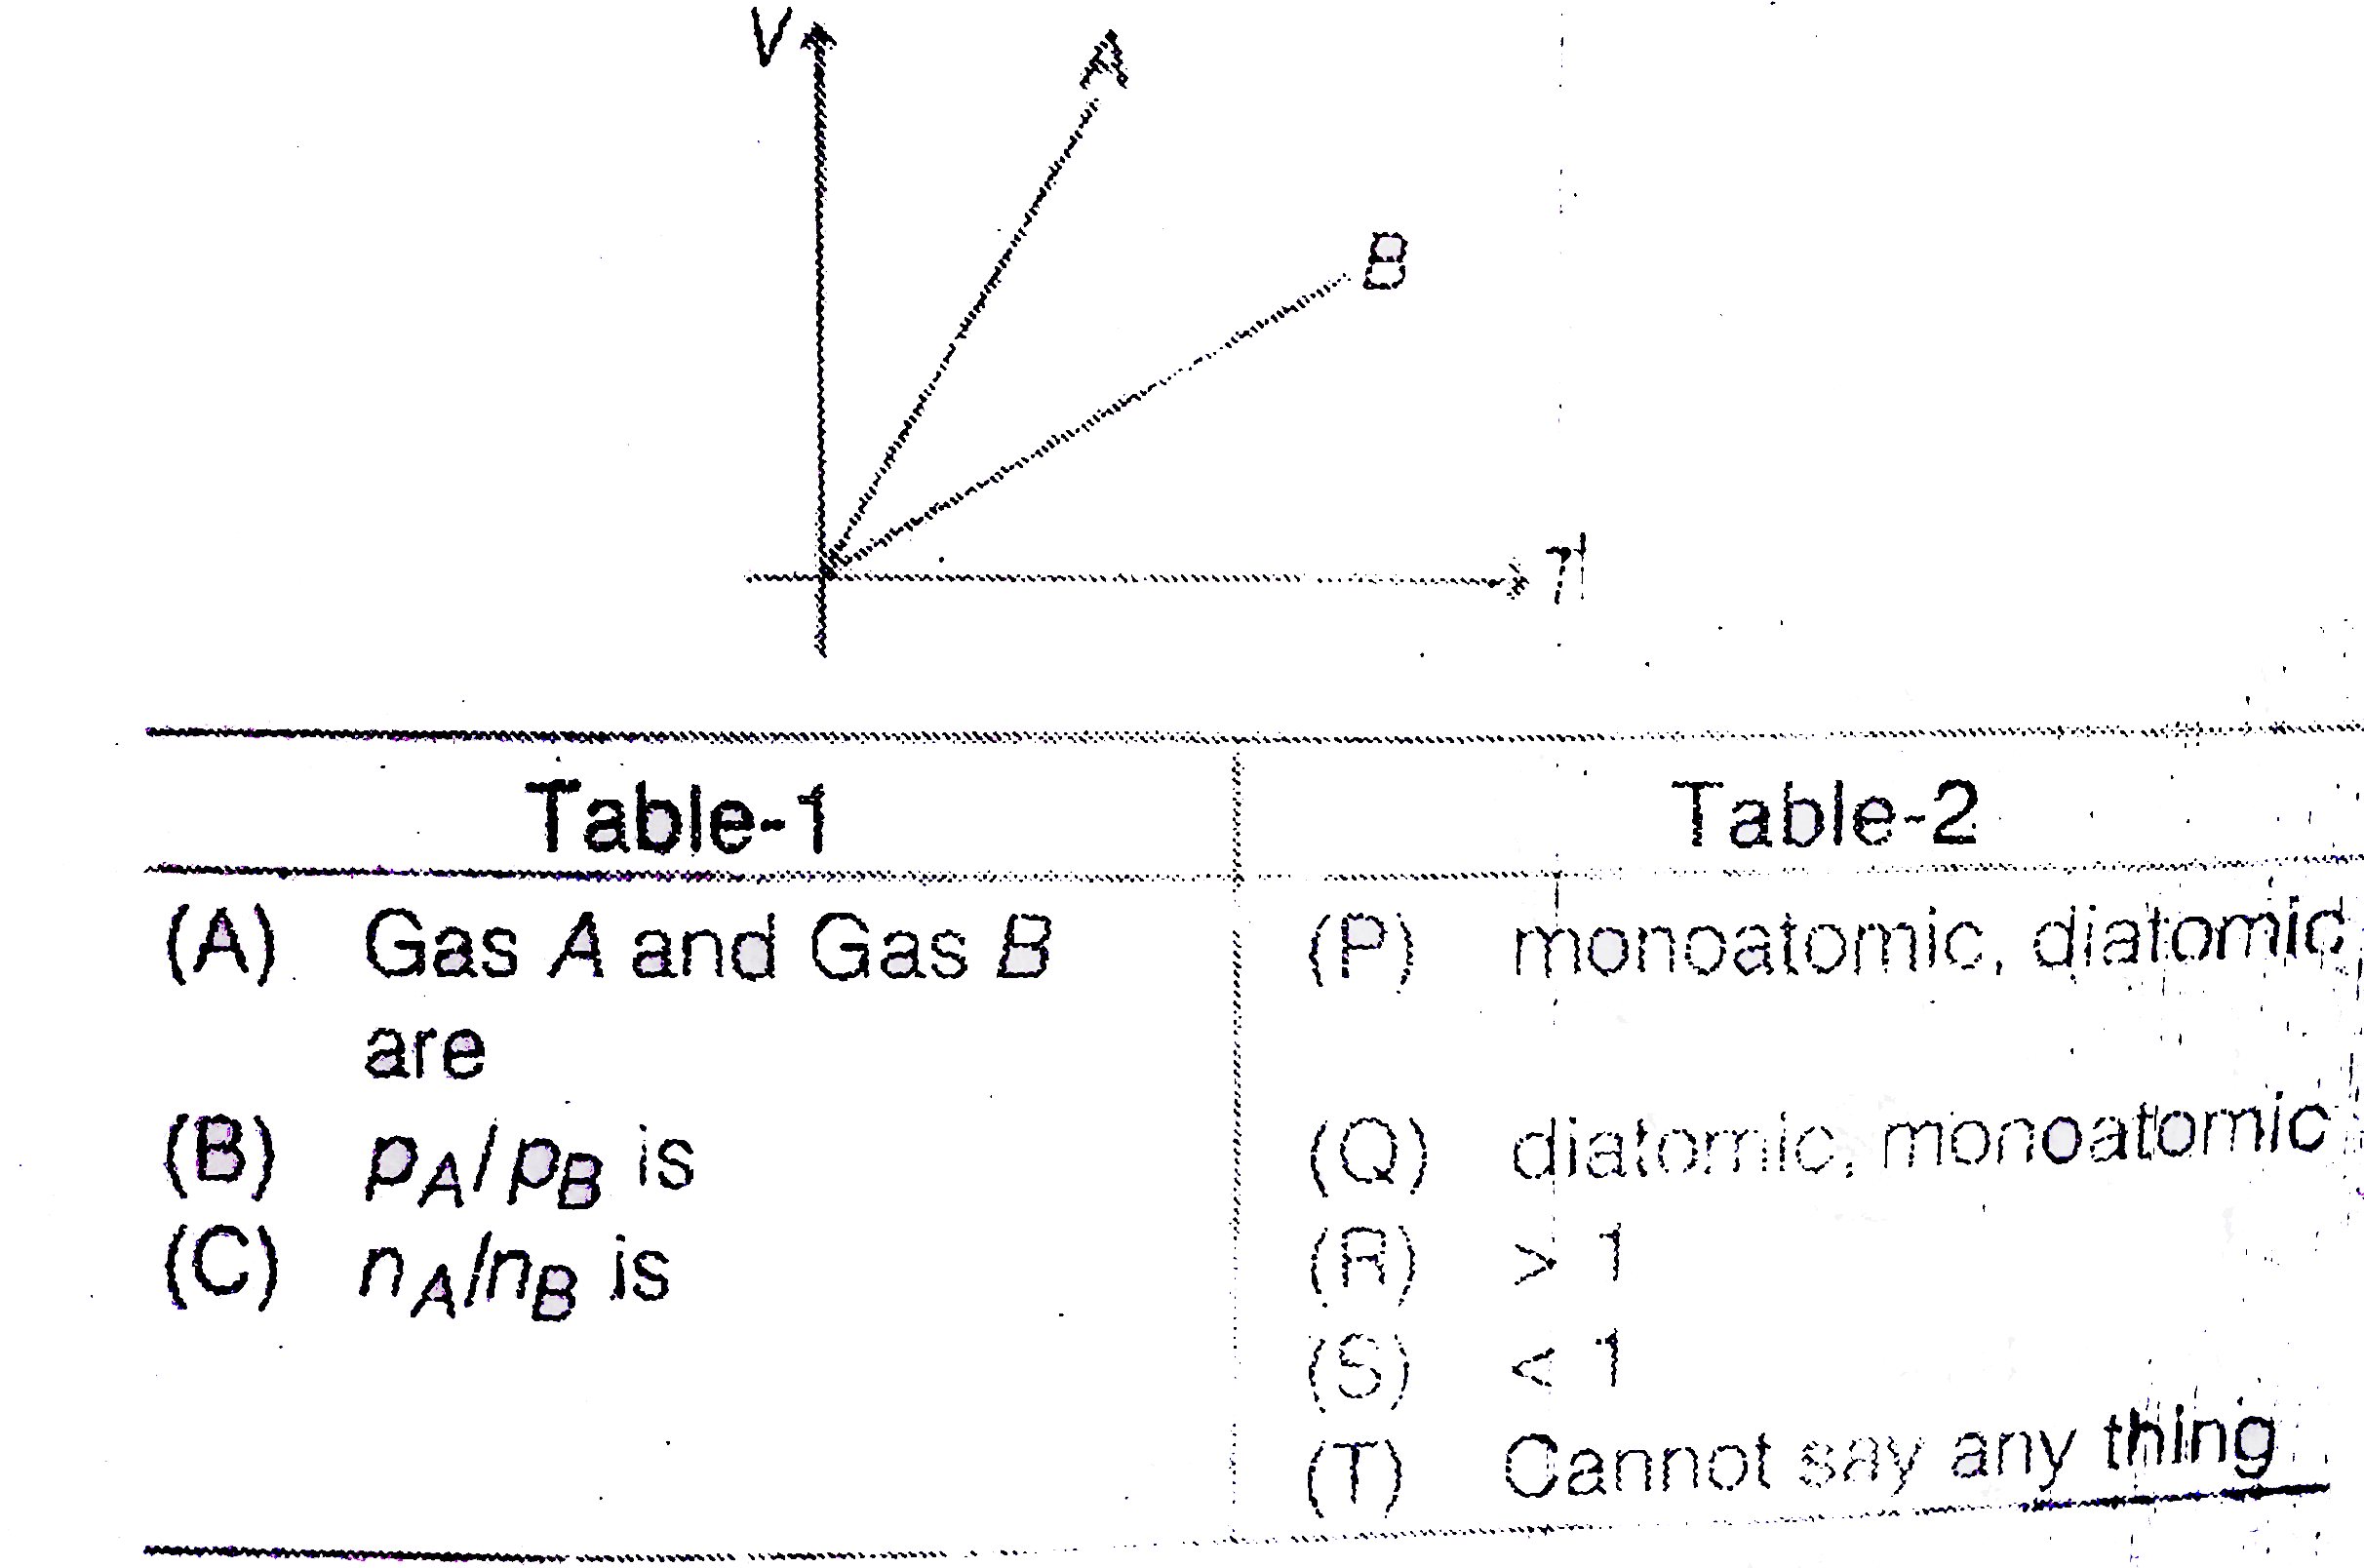
View SolutionIn the V-T graph shown in figure match the following.

View SolutionOn the P−T graph of an ideal gas, choose the correct option(s):
View Solution

_S01_065_Q01.png)
 .
.