P-V diagram of an ideal gas for a process ABC is as shown in the figure.

Find total heat absorbed or released by the gas during the process ABC.
QABC=−2P0V0
Topper's Solved these Questions
- THERMODYNAMICSBOOK - AAKASH SERIESCHAPTER - THERMODYNAMICSEXERCISE - Problem
60 Videos
- THERMODYNAMICSBOOK - AAKASH SERIESCHAPTER - THERMODYNAMICSEXERCISE - EXERCISE - 1A
135 Videos
- THERMODYNAMICSBOOK - AAKASH SERIESCHAPTER - THERMODYNAMICSEXERCISE - NUMERICAL EXERCISE (LEVEL-2)
35 Videos
- THERMAL PROPERTIES OF MATTERBOOK - AAKASH SERIESCHAPTER - THERMAL PROPERTIES OF MATTEREXERCISE - ADDITIONAL PRACTICE EXERCISE (LEVEL - II) PRACTICE SHEET (ADVANCED) Integer/Subjective Type Questions
2 Videos
- THERMOMETRY BOOK - AAKASH SERIESCHAPTER - THERMOMETRY EXERCISE - Numerical Exercise (LEVEL- 1)
11 Videos
Similar Questions
p-V diagram of an ideal gas for a process ABC is as shown in the figure.
(a) Find total heat absorbed or released by the gas during the process ABC.
(b) Change in internal energy of the gas during the process ABC.
(c) Plot pressure versus density graph of the gas for the process ABC.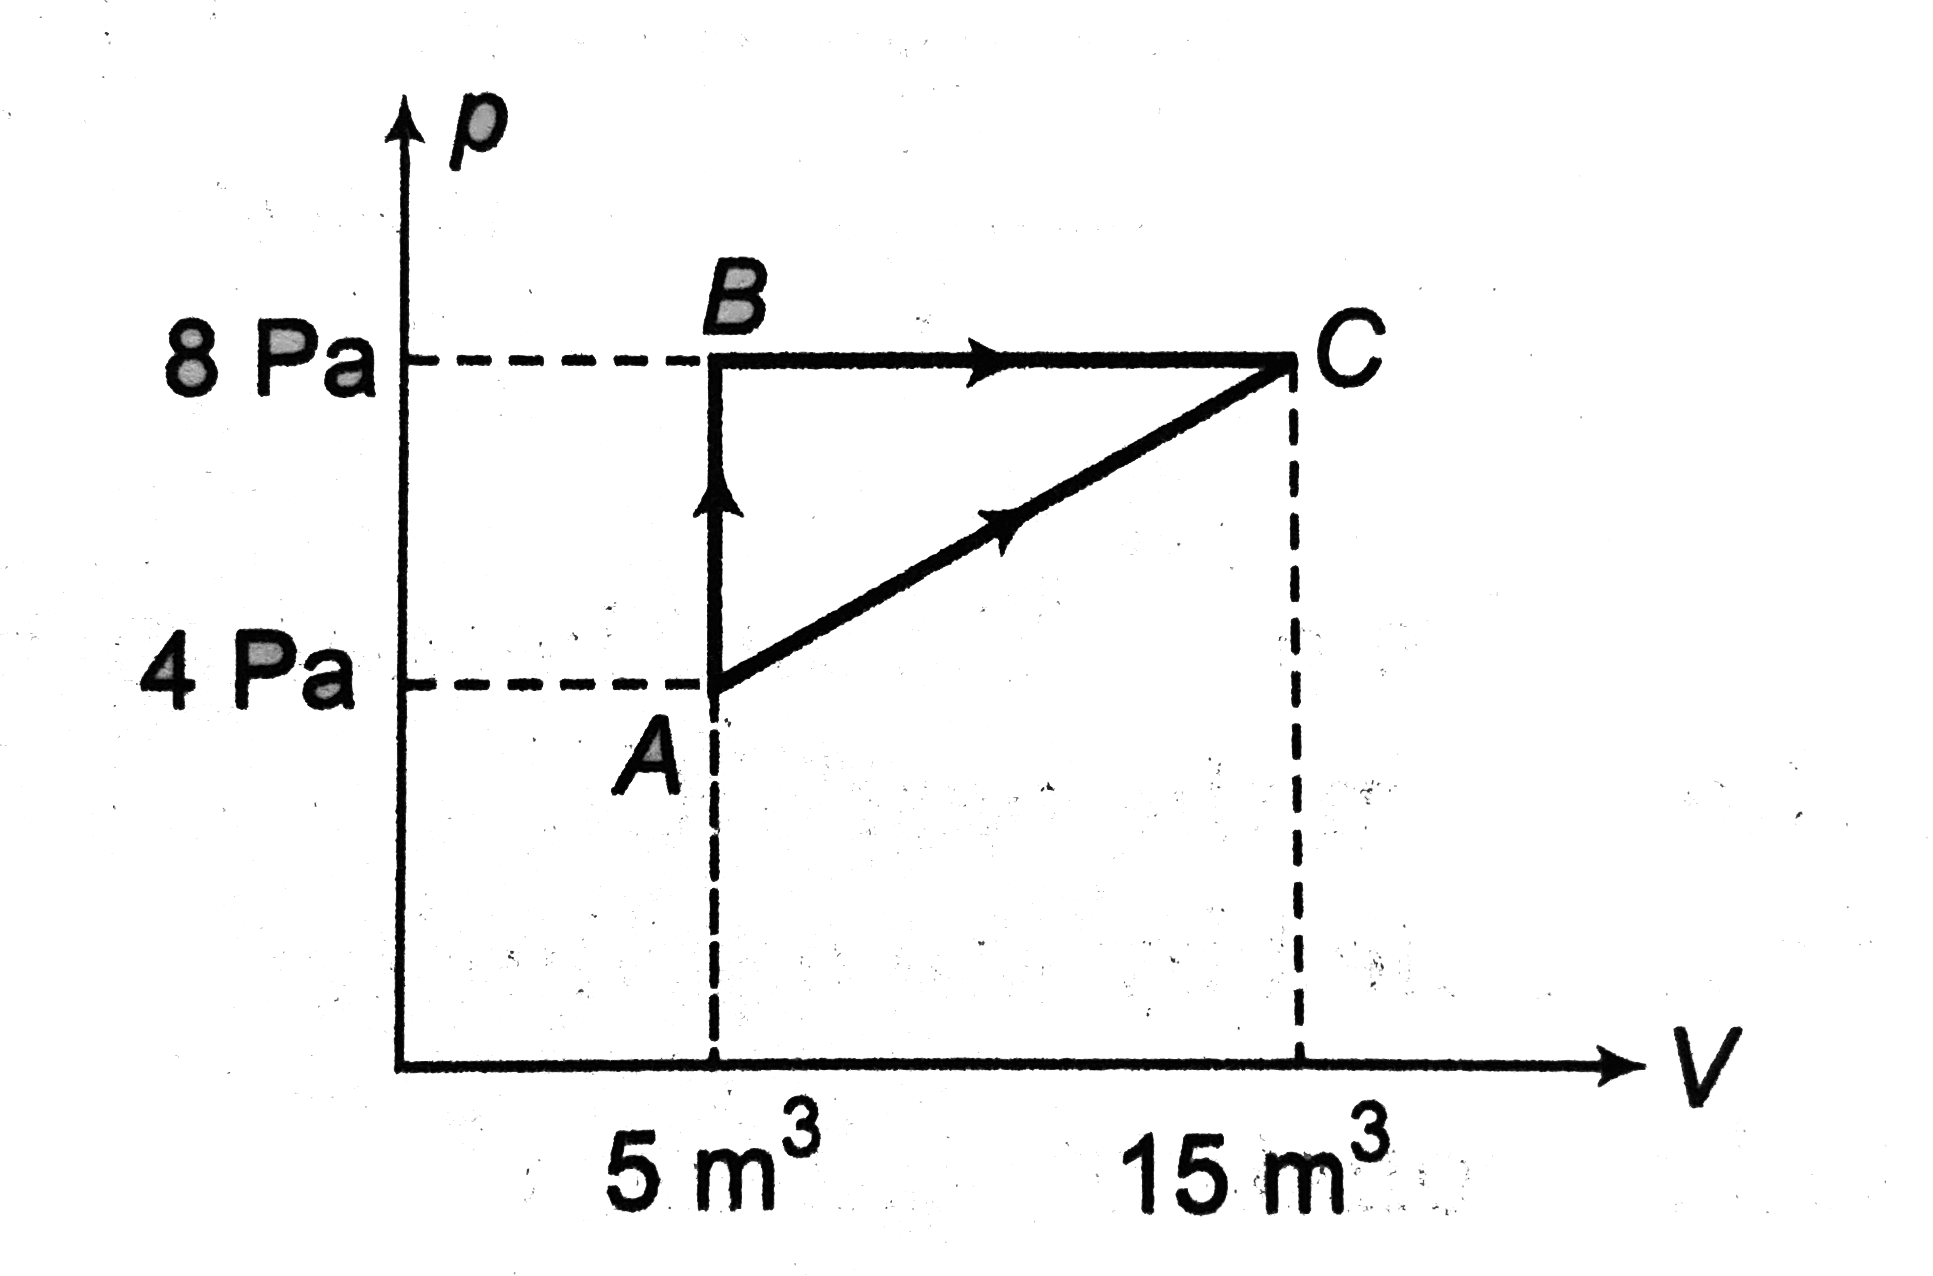
View Solutionp-V diagram of an ideal gas for a process ABC is as shown in the figure.

(a) Find total heat absorbed or released by the gas during the process ABC.
(b) Change in internal energy of the gas during the process ABC.
(c) Plot pressure versus density graph of the gas for the process ABC.
View Solution
Knowledge Check
The P−V diagram of 2 gm of helium gas for a certain process A→B is shown in the figure. What is the heat given to the gas during the process A→B?
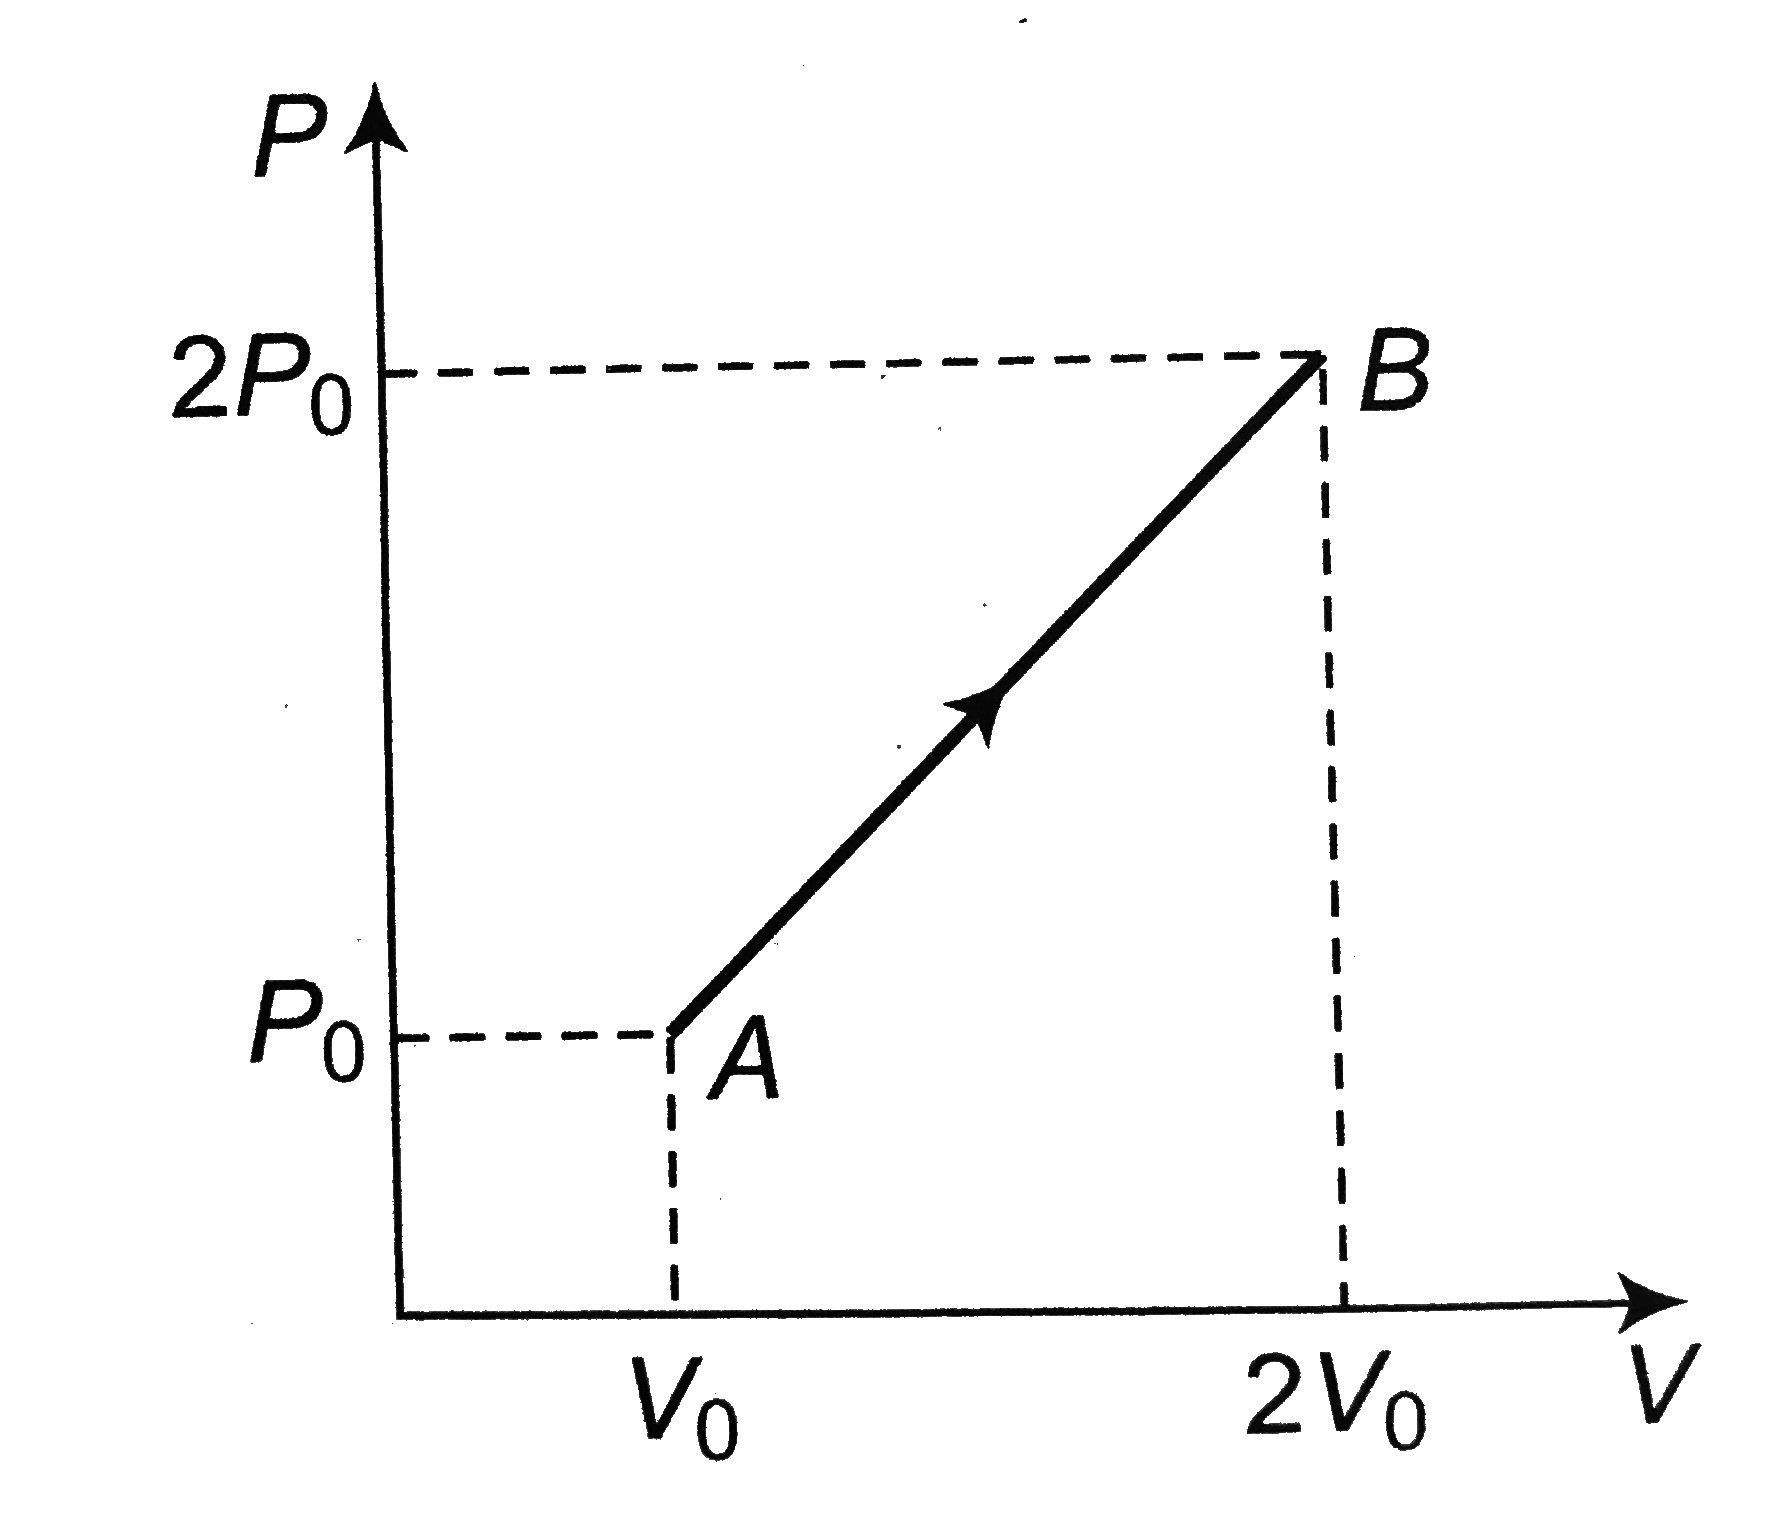 A4P0V0B6P0V0C4.5P0V0D2P0V0
n' moles of an ideal gas undergoes a process A→B as shown in the figure. The maximum temperature of the gas during the process will be:
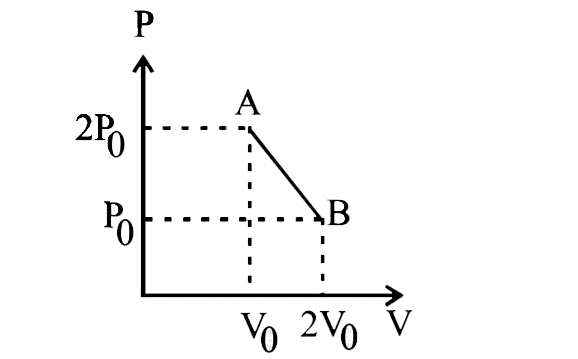 A9P0V02nRB9P0V0nRC9P0V04nRD3P0V02nR
P-V diagram of an ideal gas is as shown in figure. Work done by the gas in the process ABCD is
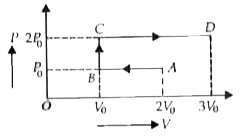 A4P0V0B2P0V0C3P0V0DP0V0
The P−V diagram of 2 gm of helium gas for a certain process A→B is shown in the figure. What is the heat given to the gas during the process A→B?

View Solutionn' moles of an ideal gas undergoes a process A→B as shown in the figure. The maximum temperature of the gas during the process will be:

View SolutionP-V diagram of an ideal gas is as shown in figure. Work done by the gas in the process ABCD is

View SolutionP−V diagram of an ideal gas is as shown in figure. Work done by the gas in process ABCD is
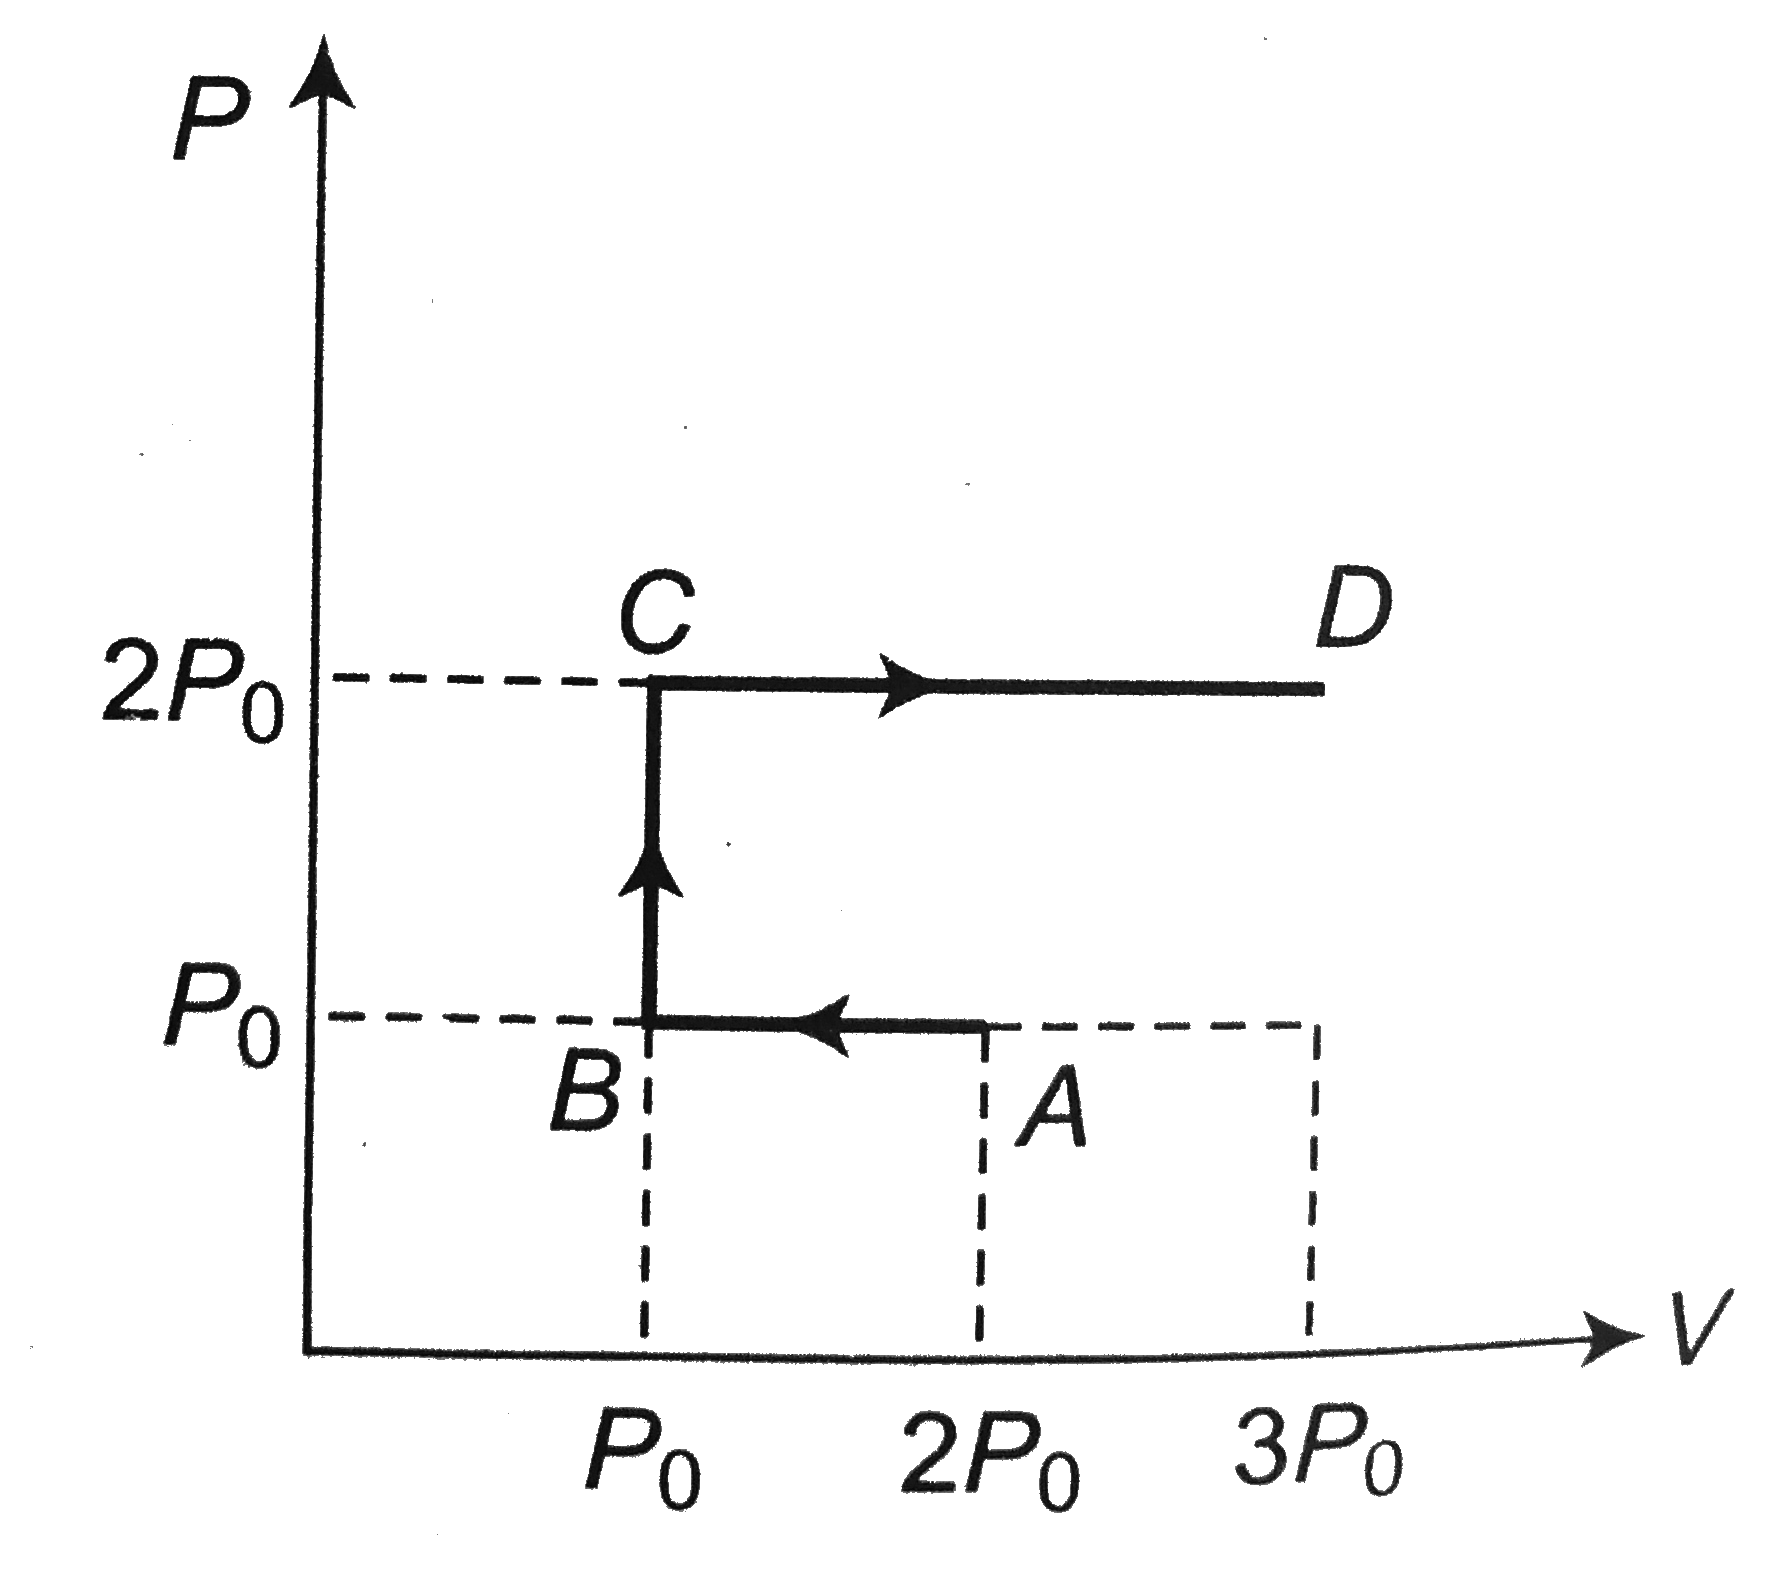
View SolutionP−V diagram of an ideal gas is as shown in figure. Work done by the gas in process ABCD is

View Solution
