The velocity -time graph for two bodies A and B shown. Then the acceleration of A and B are in the ratio

cos25∘ to cos50∘
sin25∘ to sin50∘
tan25∘ to tan50∘
tan25∘ to tan40∘
The correct Answer is:C
Acceleration and slope of velocity time graph
∴a1a2=tanθ1tanθ2=tan25∘tan50∘
Topper's Solved these Questions
Similar Questions
Knowledge Check
The velocity - time graph for two bodies A and B are shown in figure. Then, the acceleration of A and B are in the ratio
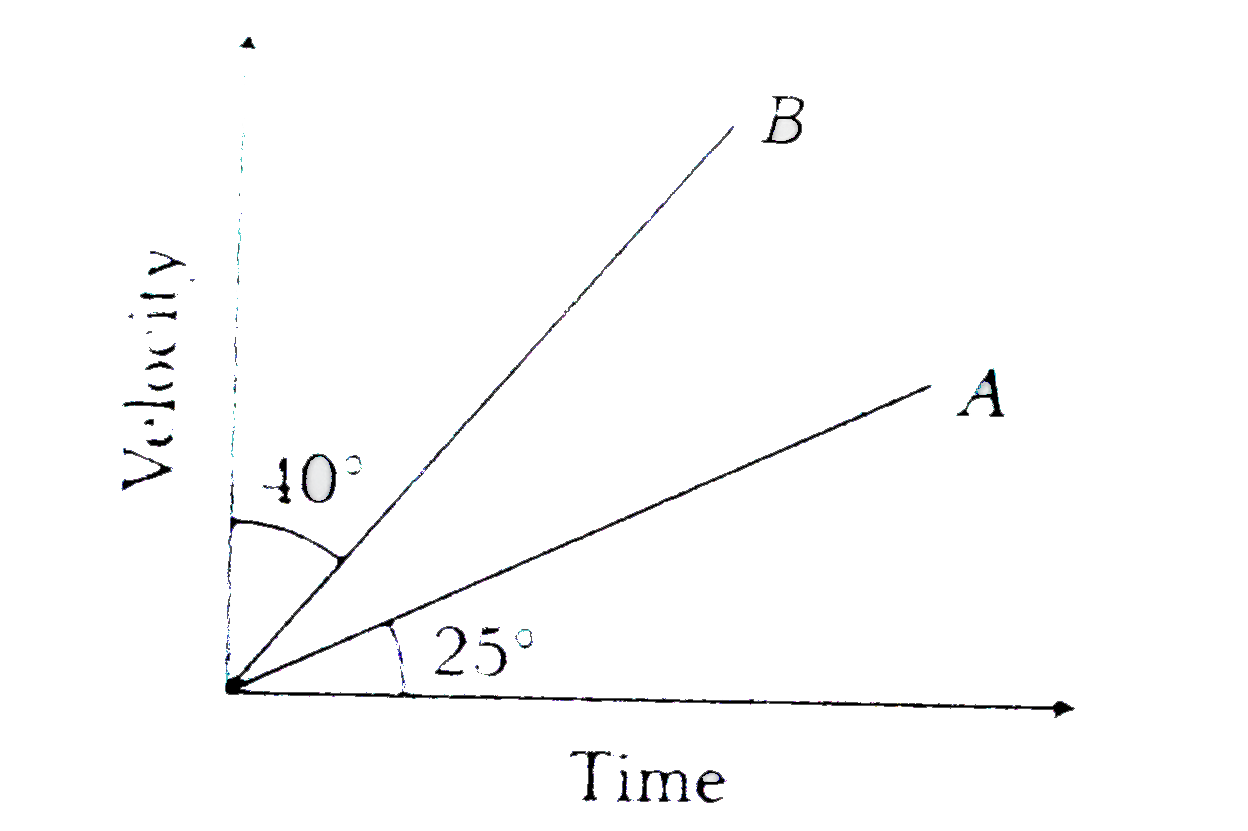 Asin25∘ to sin50∘Btan25∘ to tan40∘Ccos25∘ to cos50∘Dtan25∘ to tan50∘
The velocity - time graph of two bodies A and B is shown in figure. Choose correct statement.
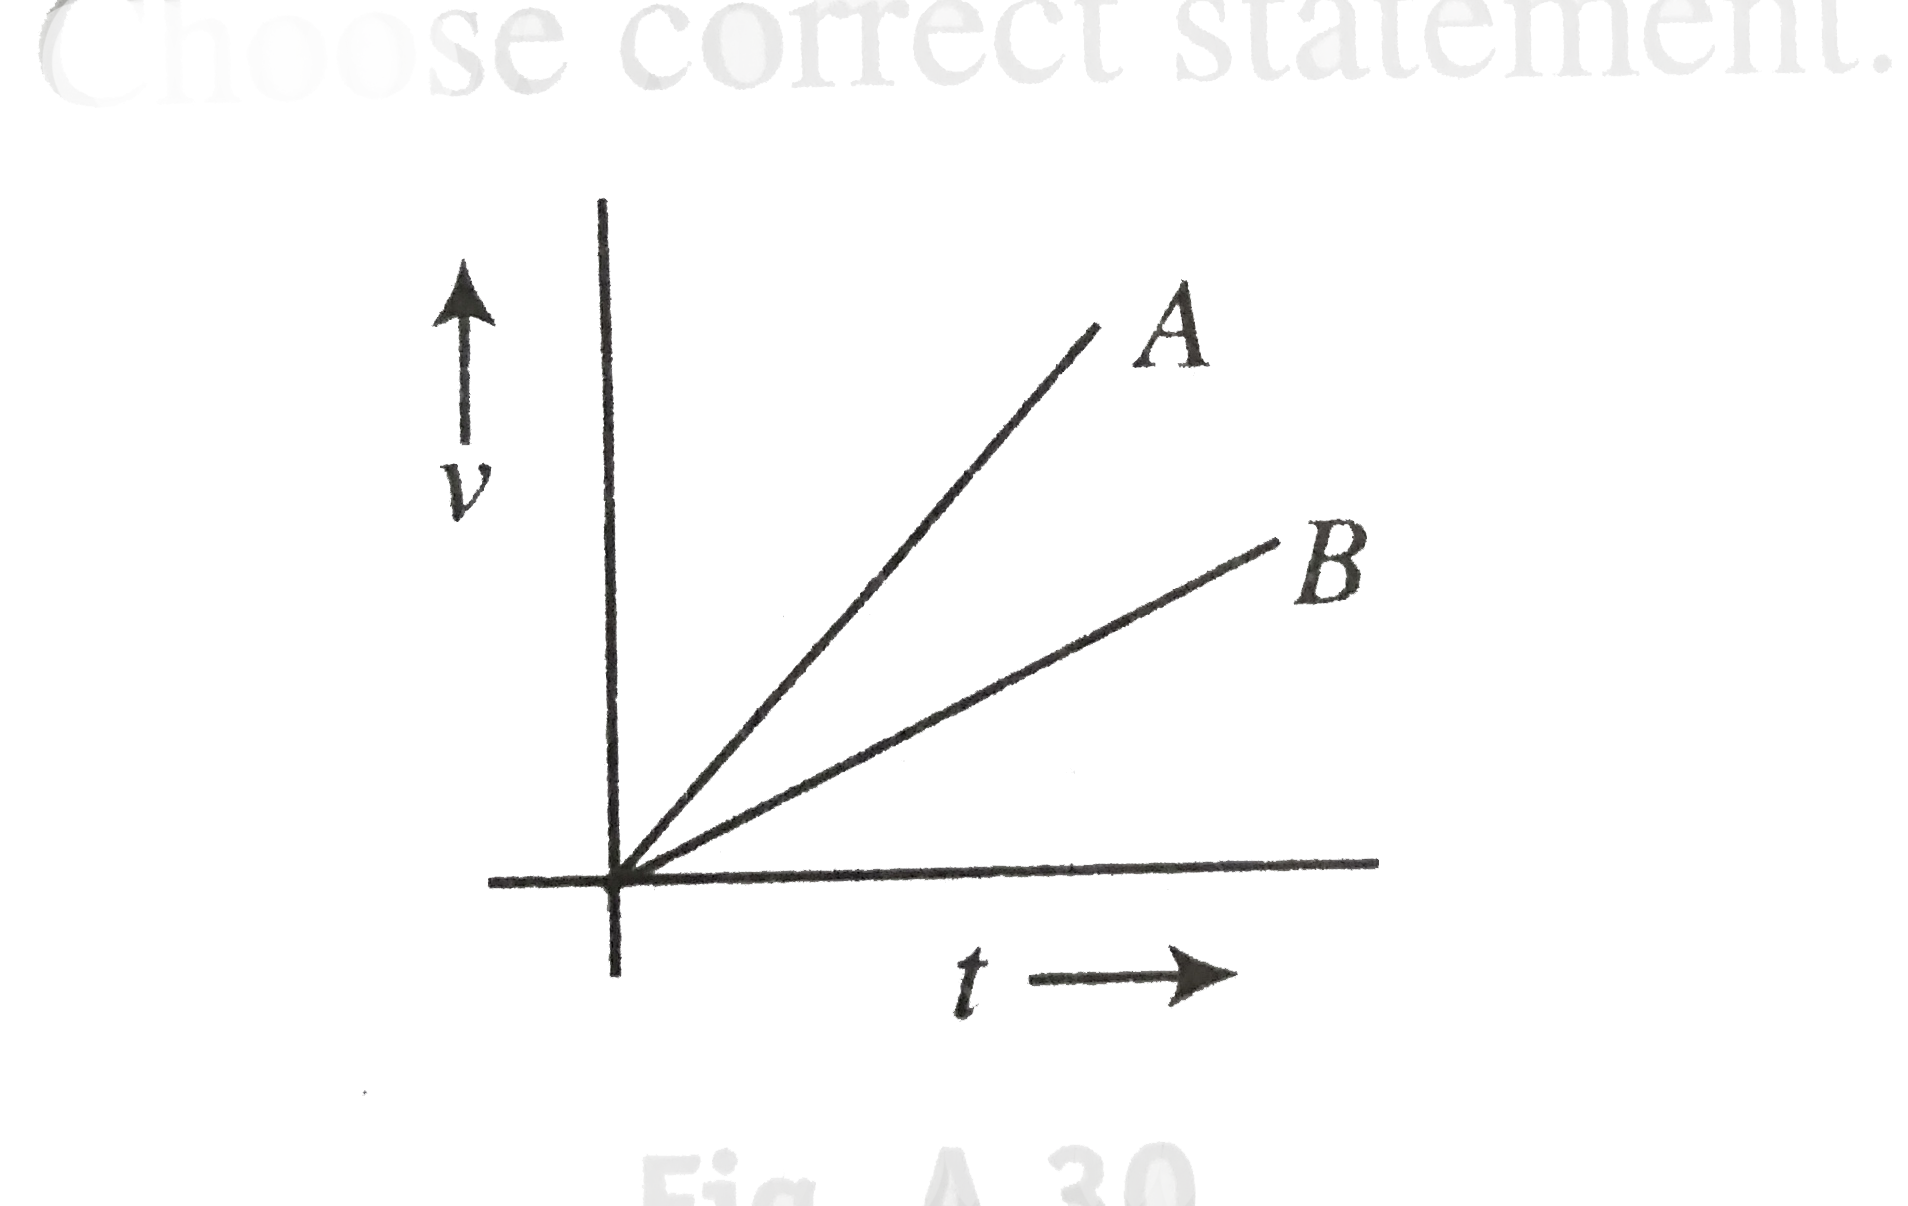 Aacceleration of Bgt acceleration of ABacceleration of A gt acceleration of BCboth are starting from same pointDA covers greater distance than B in the same time.
Graphs are very useful to represent a physical situation. Various quantities can be easily represented on graphs and other quantites can be determined from the graph. For example the slope of velocity-time graph represents instantaneous acceleration. For a motion with constant acceleration slope of velocity-time graph is constant. If acceleration is changing with time, slope with change and thus velocity-time graph will be a non-linear curve. Further the area of velocity-time graph gives displacement.
The velocity-time graph for two objects P and Q are shown. The ratio of their respective acceleration is
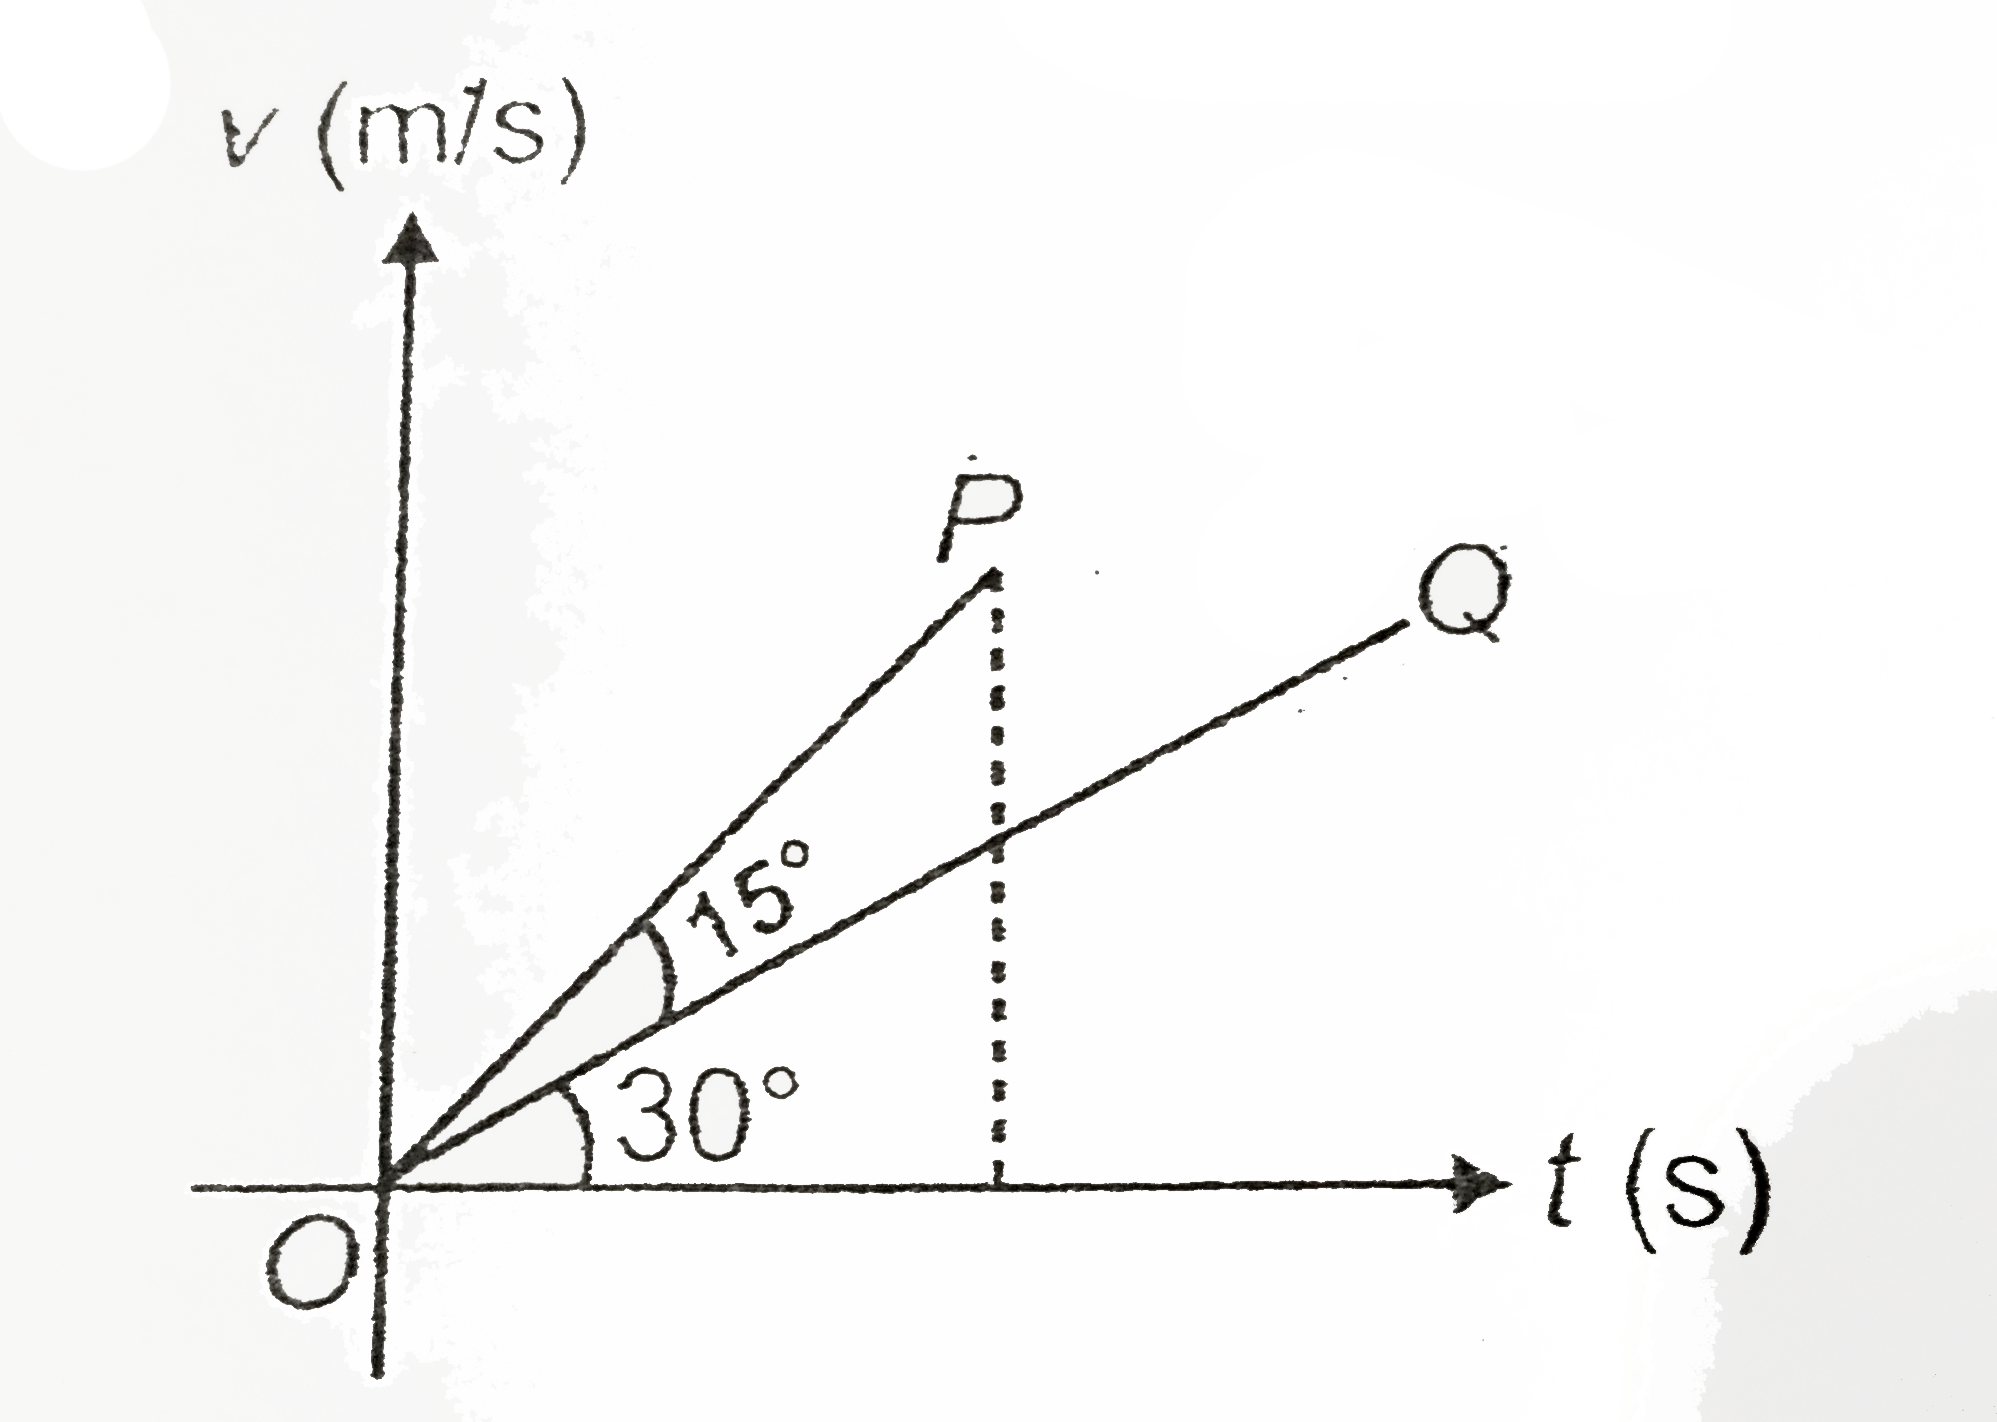
View SolutionGraphs are very useful to represent a physical situation. Various quantities can be easily represented on graphs and other quantites can be determined from the graph. For example the slope of velocity-time graph represents instantaneous acceleration. For a motion with constant acceleration slope of velocity-time graph is constant. If acceleration is changing with time, slope with change and thus velocity-time graph will be a non-linear curve. Further the area of velocity-time graph gives displacement.
The velocity-time graph for two objects P and Q are shown. The ratio of their respective acceleration is

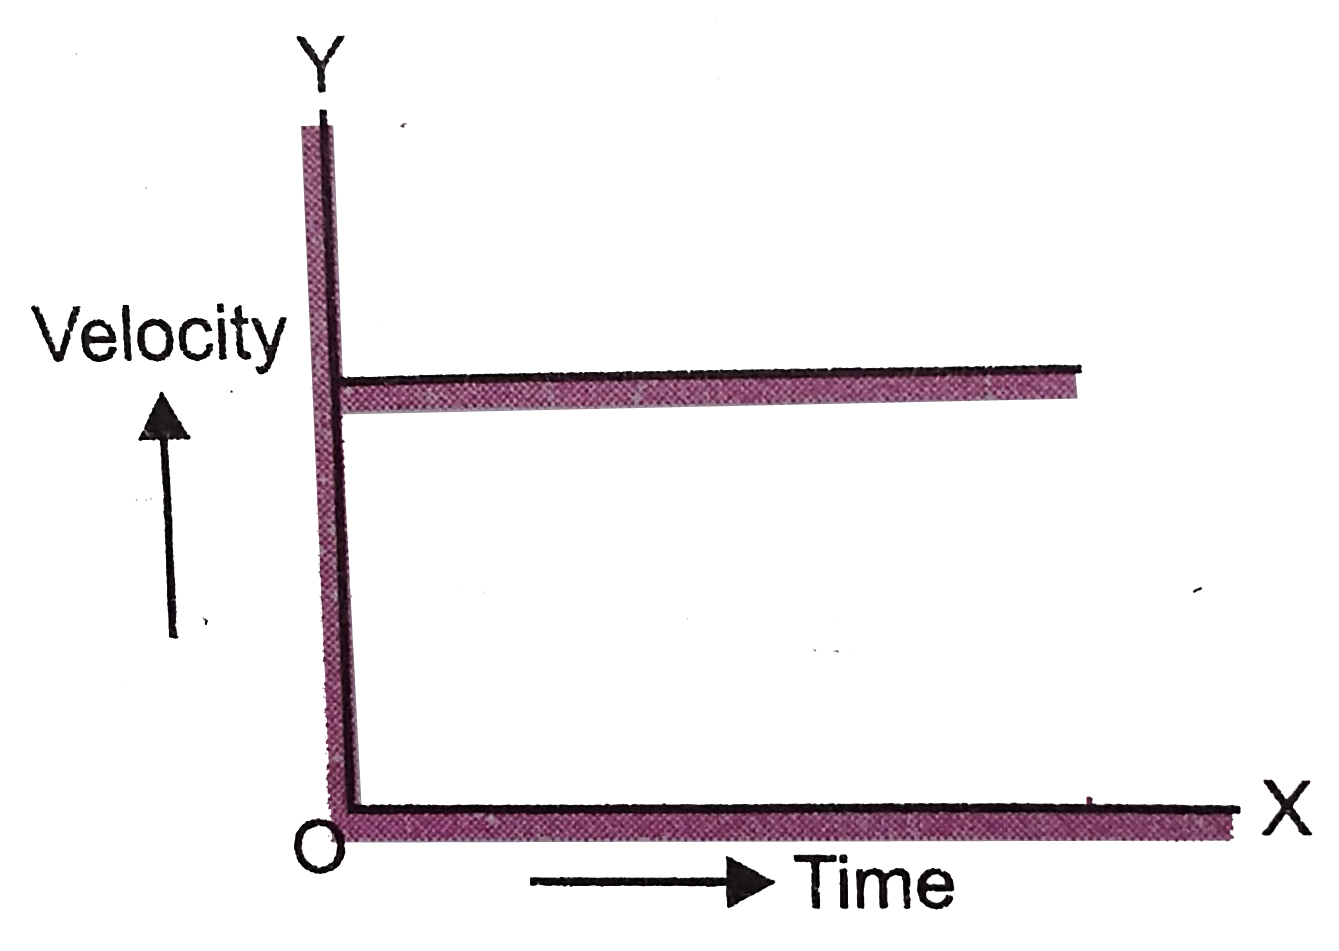
View SolutionThe velocity-time graph of an object is shown below. The acceleration of the object is
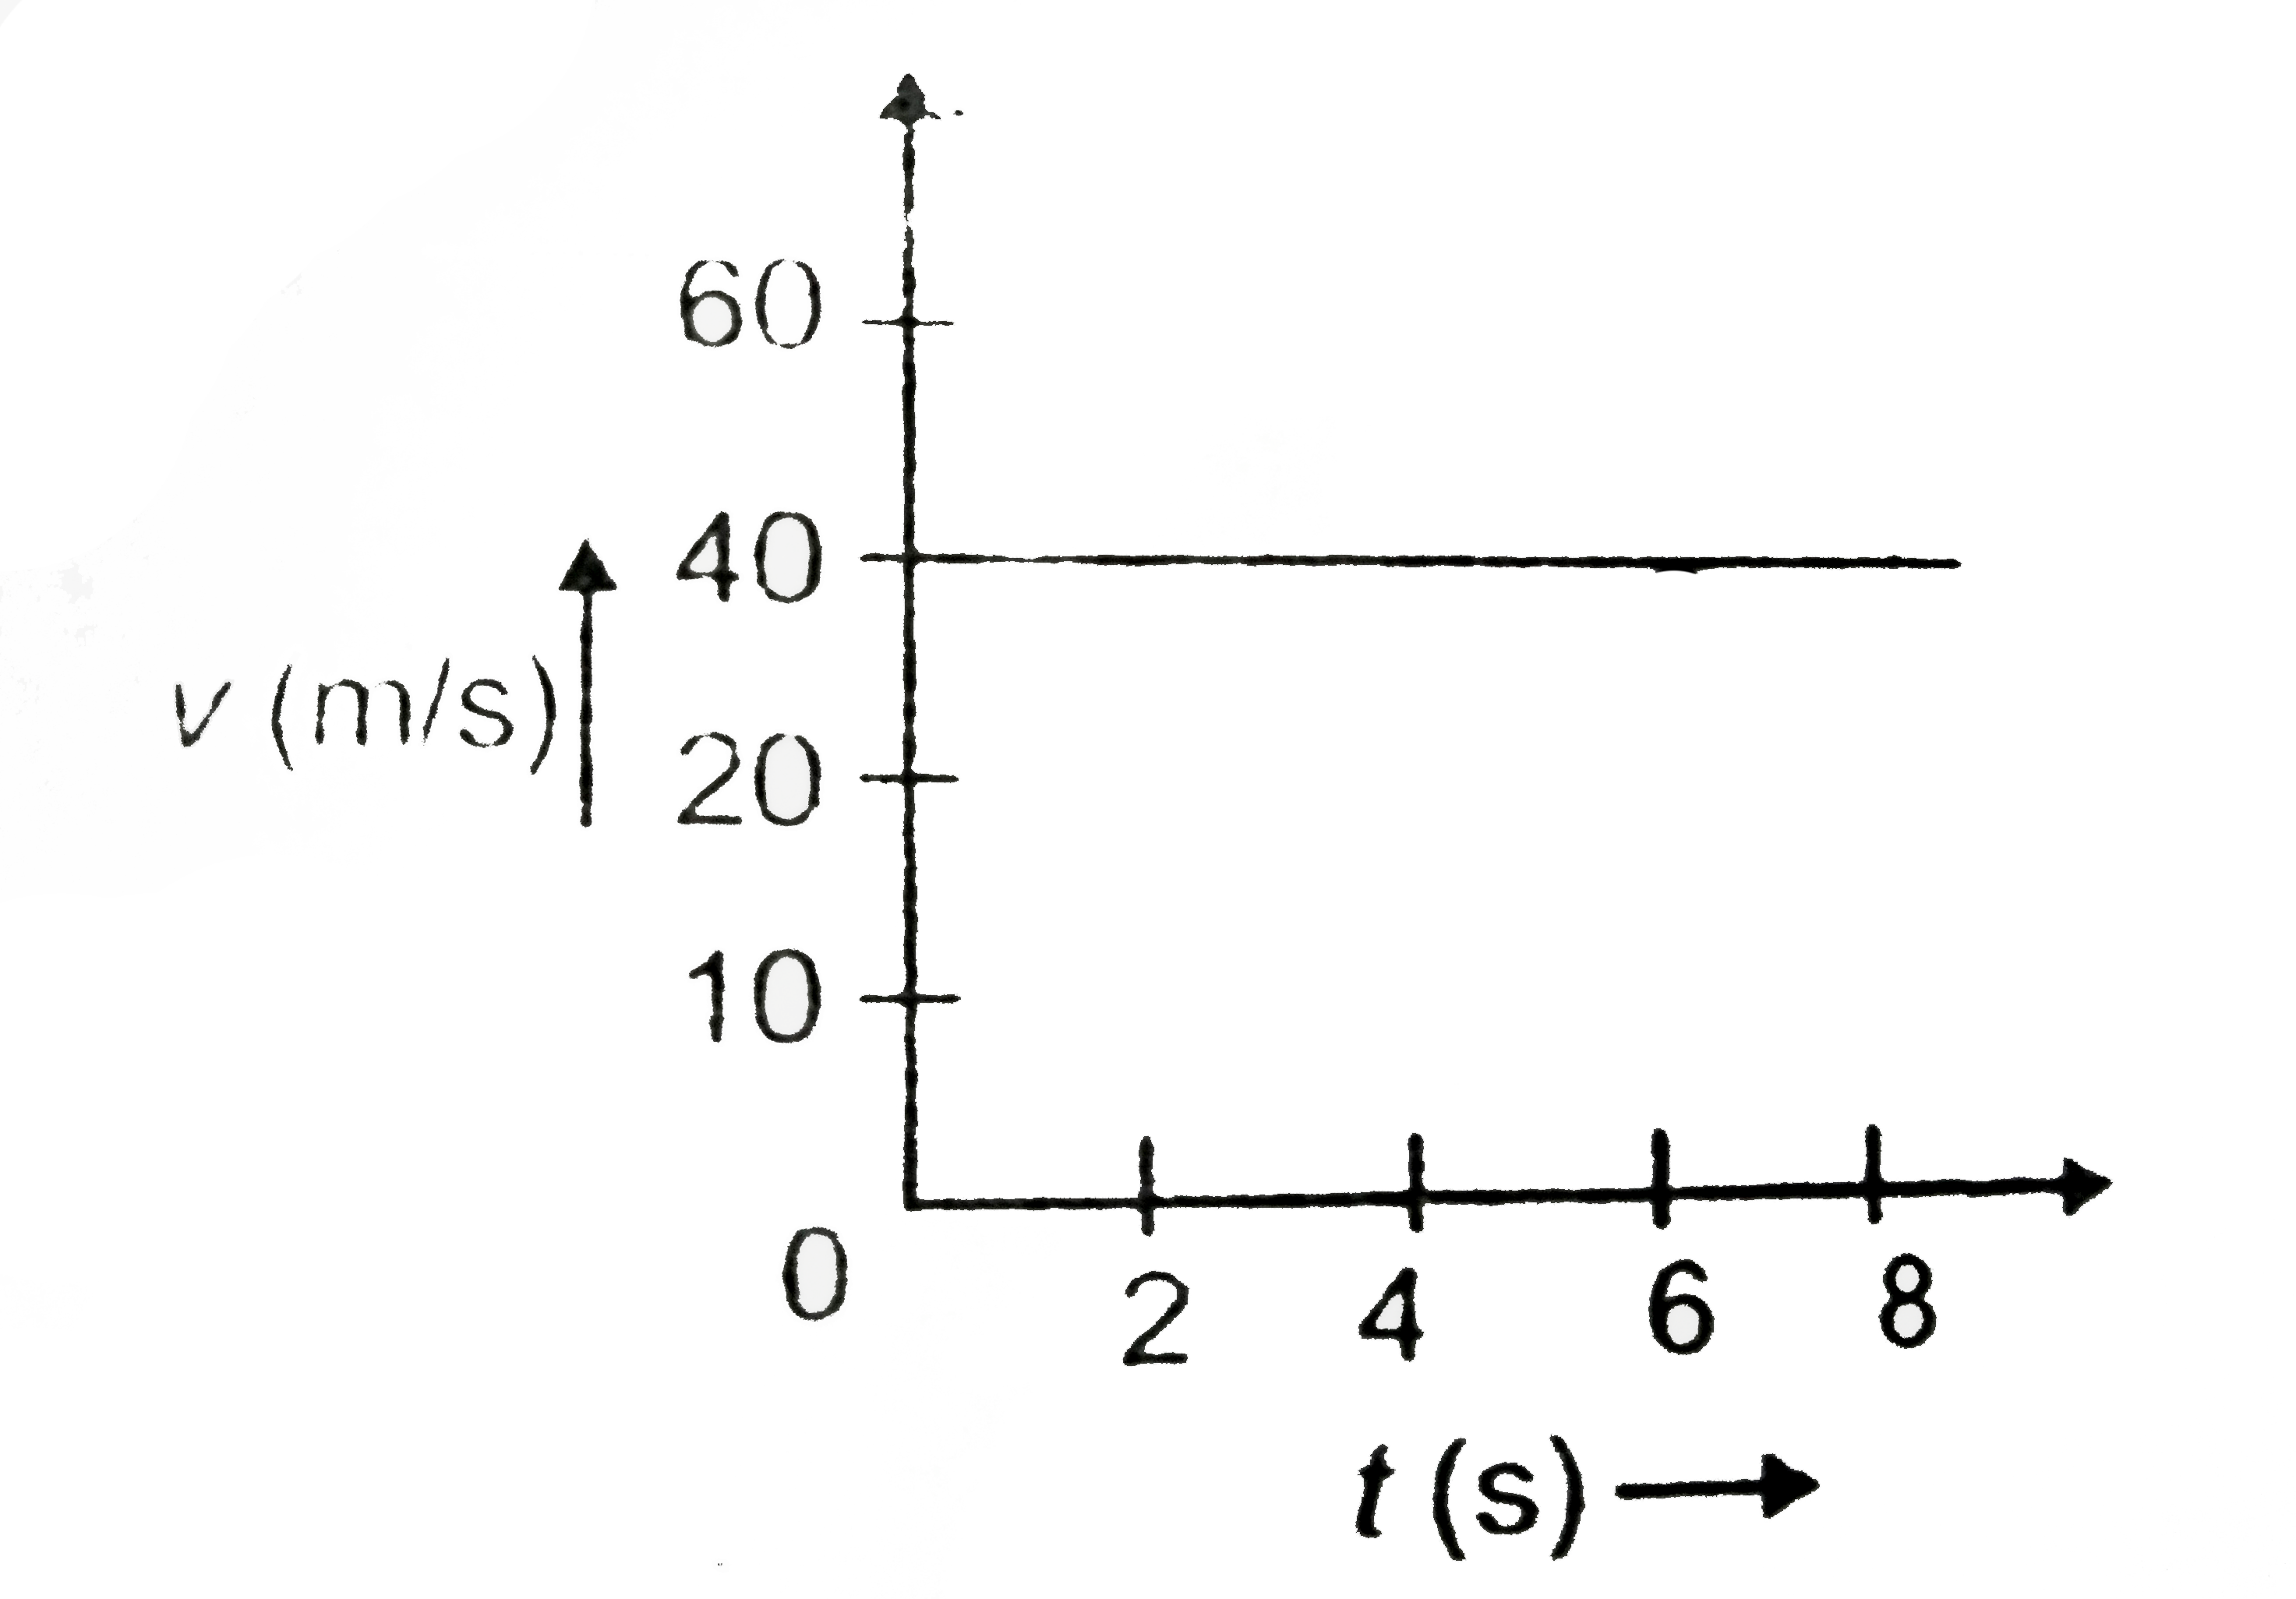
View SolutionThe velocity-time graph of an object is shown below. The acceleration of the object is

View SolutionThe velocity - time graph of two bodies A and B is shown in figure. Choose correct statement.

View SolutionThe velocity-time graph of a body is given in. The maximum acceleration in ms−1 is .
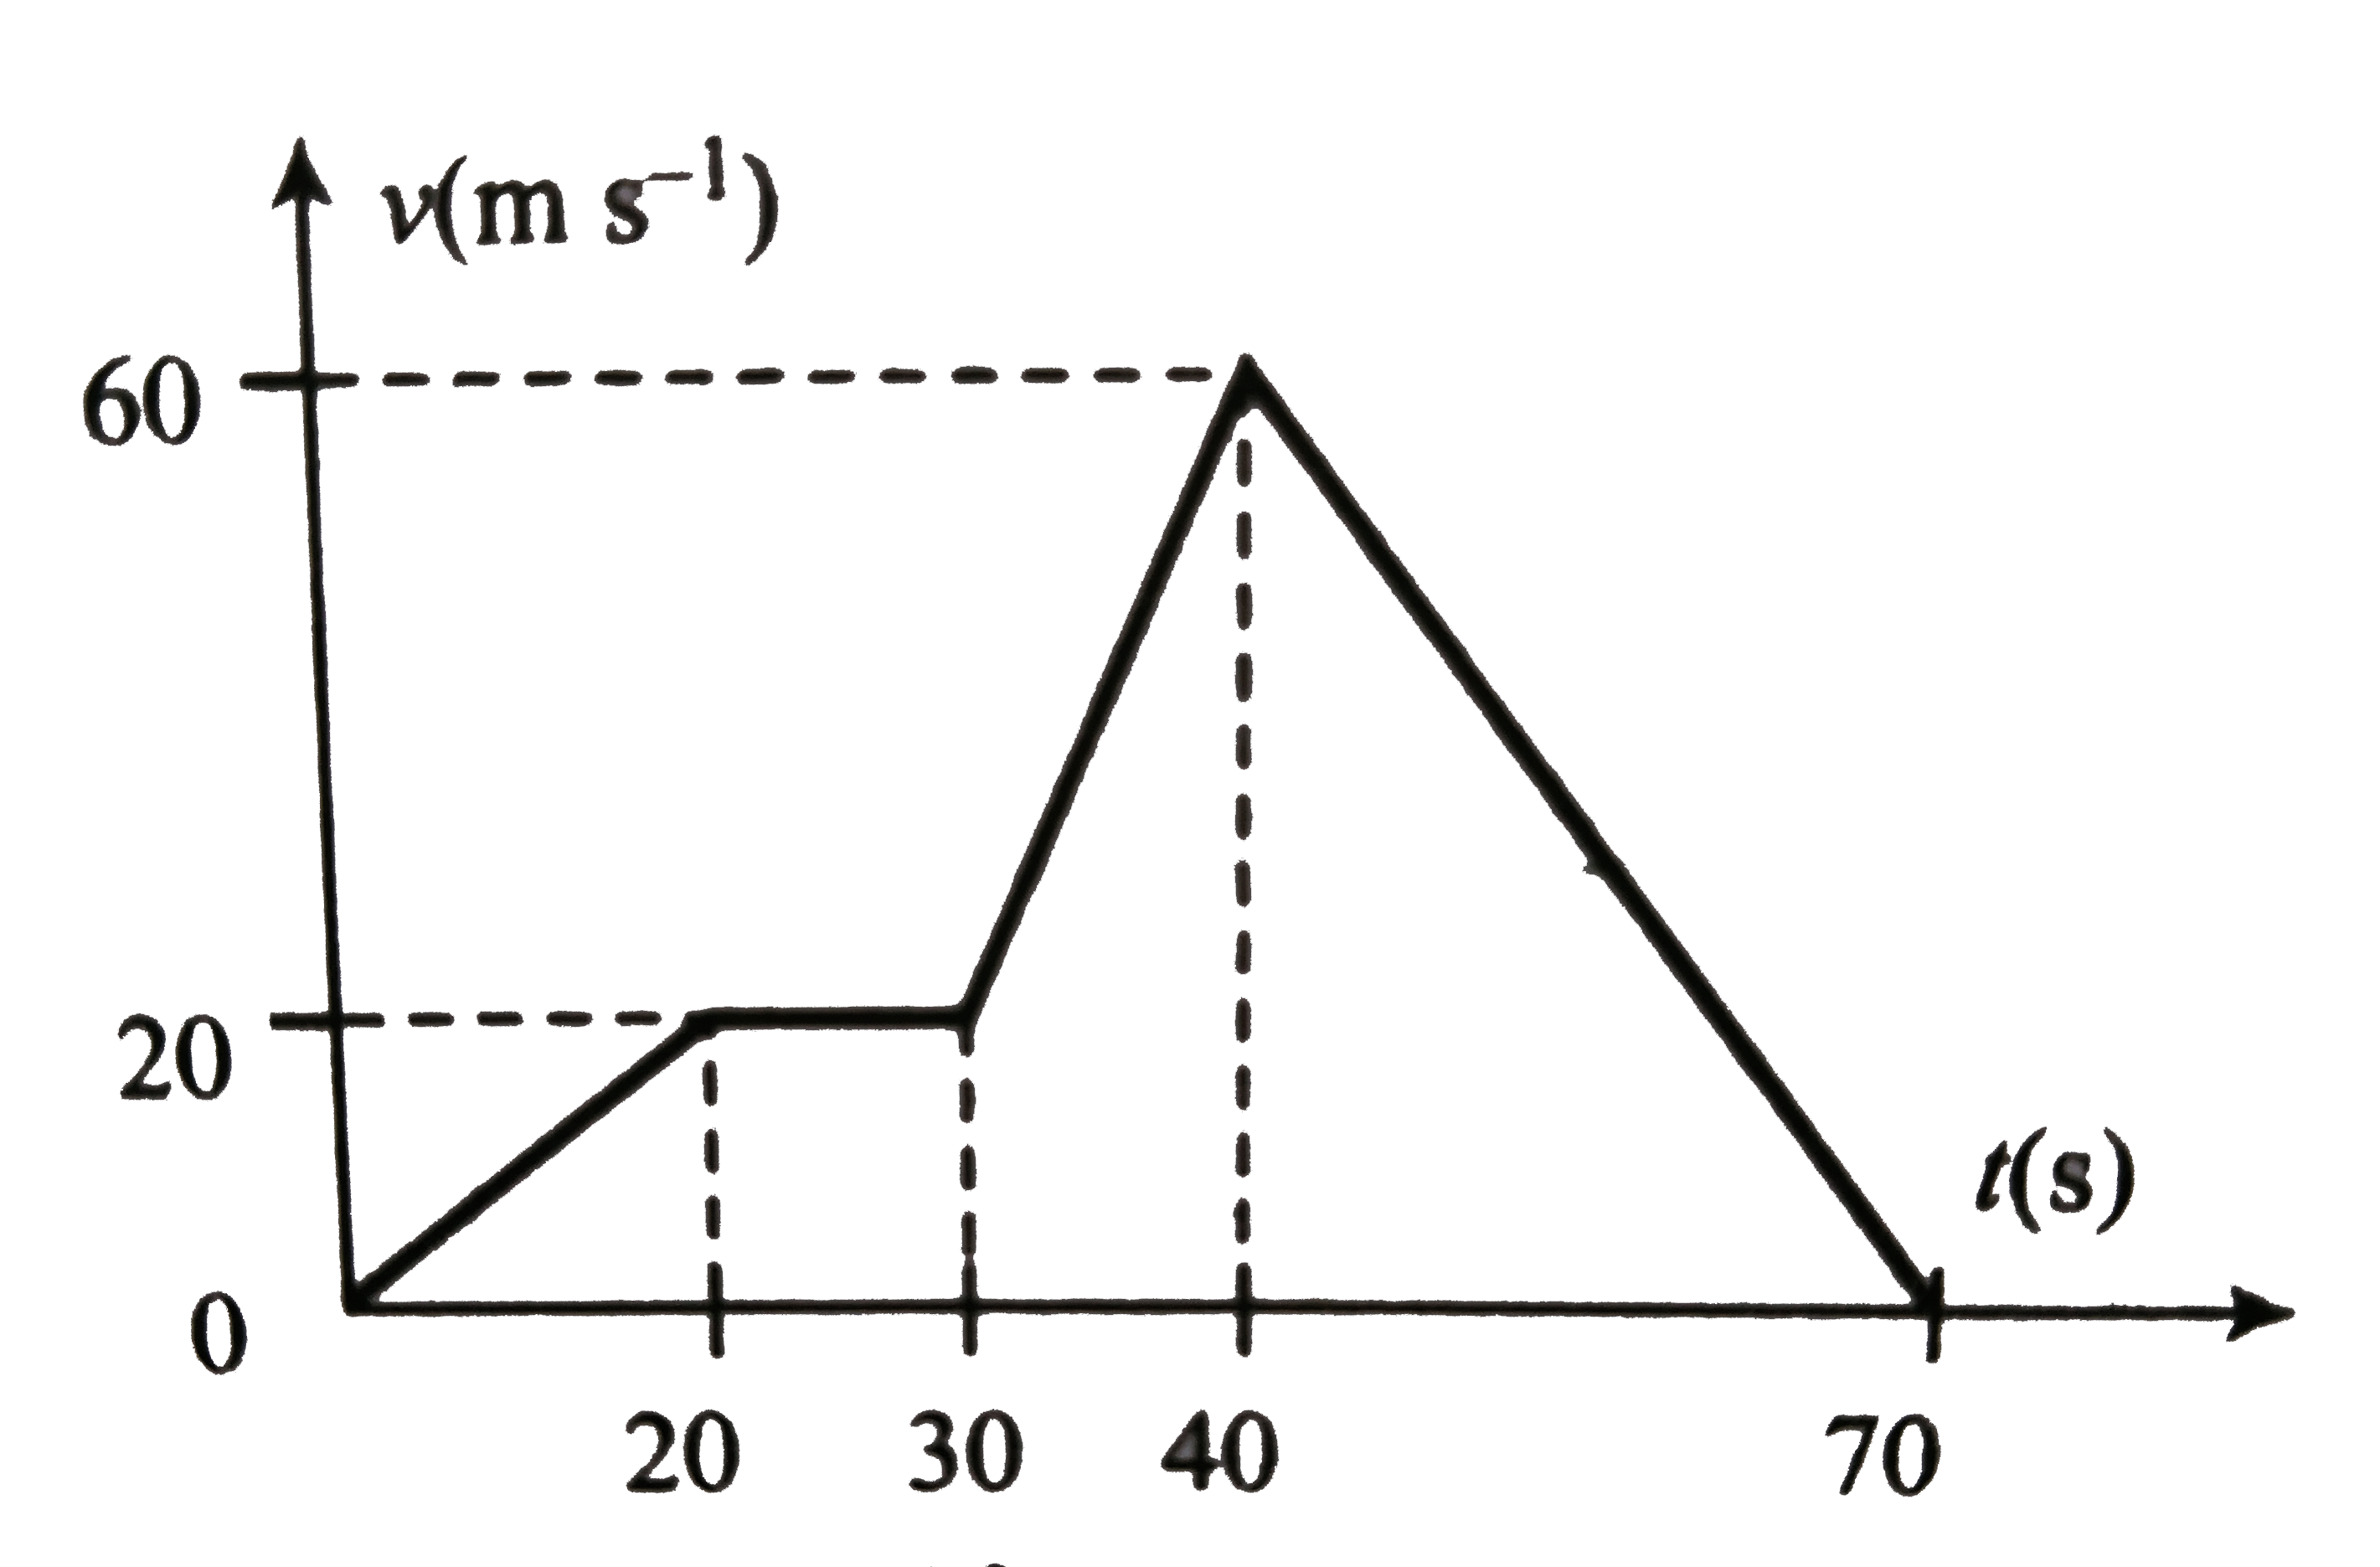 .
.
View Solution

