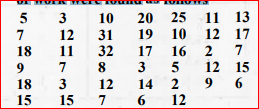
Distance (in km) of 40 engineers from their place of residence to their place of work were found as follows
 Construct n grouped frequency distribution table with class size 5 for the data given above taking the first interval as 0— 5 (5 not included). What main features do you observe from this tabular representation ?Solution in Punjabi
Step by step video & image solution for Distance (in km) of 40 engineers from their place of residence to their place of work were found as follows Construct n grouped frequency distribution table with class size 5 for the data given above taking the first interval as 0— 5 (5 not included). What main features do you observe from this tabular representation ? by Maths experts to help you in doubts & scoring excellent marks in Class 11 exams.
Updated on:21/07/2023Similar Questions
40 इंजीनियरों की उनके आवास से कार्य-स्थल की (किलोमीटर में ) दूरियाँ ये है :
5310202511137123119101217181132171627978351215183121429615157612
0 - 5 को (जिसमे 5 सम्मिलित नहीं है) पहला अंतराल लेकर ऊपर दिए हुए आंकड़ों से वर्ग-माप 5 वाली एक वर्गीकृत बारम्बारता बंटन सारणी बनाइए । इस सारणीबद्ध निरूपण में आपको कौन-से मुख्य लक्षण देखने को मिलते है?
View SolutionThe distance (in km) of 40 engineers from their residence to their place of work were found as follows :
5310202511137123119101217181132171627978351215183121429615157612
Construct a grouped frequency distribution table with class size for the data given above taking the first interval as 0-5 (5 not included). What main features do you observe from this tabular representation ?
View SolutionThe distance (in km) of 40 engineers from their residence to their place of work were found as follows :

Construct a grouped frequency distribution table with class size 5 for the data given above taking the first interval as 0-5 (5 not included). What main features do you observe from this tabular representation ?
View SolutionThe distance (in km) of 40 engineers from their residence to their place of work were found as follows.

Construct a grouped frequency distribution table with calss- size 5 for the data given above taking the first interval as 0-5 (5 not included).
View Solution40 इंजीनियरों की उनके आवास से कार्य-स्थल की (किलोमीटर में) दूरियां ये हैं :
 0-5 को (जिसमें 5 सम्मिलित नहीं है) पहला अंतराल लेकर ऊपर दिए हुए आंकड़ों से वर्ग-माप 5 वाली एक वर्गीकृत बारंबारता बंटन सारणी बनाइए। इस सारणी बद्ध निरूपण में आपको कौन-से मुख्य लक्षण देखने को मिलते हैं?
View SolutionFrom the following figure, the correct observation is :-
ltimg src="https://d10lpgp6xz60nq.cloudfront.net/physics_images/ALN_PHY_R03_E08_015_Q01.png" width="80%"gt
View SolutionShifting of the curve to right takes place in the case of ltimg src="https://d10lpgp6xz60nq.cloudfront.net/physics_images/ALN_BIO_NTUG_E01_065_Q01.png" width="80%"gt
View Solution
