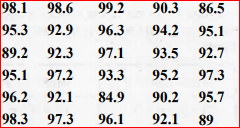
The relative humidity (in %) of a certain city for a month of 30 days was as follows :
 : Which month or season do you think this data is about ?
Solution in Punjabi
Step by step video & image solution for The relative humidity (in %) of a certain city for a month of 30 days was as follows : : Which month or season do you think this data is about ? by Maths experts to help you in doubts & scoring excellent marks in Class 11 exams.
Updated on:21/07/2023Similar Questions
The inequation that best describes the graph given below is _________
View SolutionThe inequation that best describes the following graph is _________
View SolutionWhich inequations represent the shaded region in the given figure
View SolutionMatch the followings (column I with column II)
ltimg src="https://d10lpgp6xz60nq.cloudfront.net/physics_images/NCERT_BIO_XI_C03_E01_011_Q01.png" width="80%"gt
View SolutionThe relative humidity (in %) of a certain city for a month of 30 days was as follows :
98.198.699.290.386.595.392.996.394.295.189.292.397.193.592.795.197.293.395.297.396.292.184.990.295.798.397.396.192.189
(ii) Which month or season do you think this data is about ?
View SolutionThe relative humidity (in %) of a certain city for a month of 30 days was as follows :
98.198.699.290.386.595.392.996.394.295.189.292.397.193.592.795.197.293.395.297.396.292.184.990.295.798.397.396.192.189
(iii) What is the range of this data ?
View SolutionThe relative humidity (in %) of a certain city for a month of 30 days was as follows:

(i) Construct a grouped frequency distribution table with classes 84-86, 86-88, etc. (ii) Which month or season do you think this data is about ? (iii) What is the range of this data ?
View Solution
