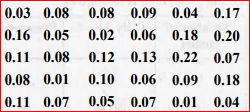
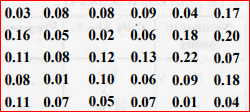
A study was conducted to find out the concentration of sulphur dioxide in the air in parts per million (ppm) of a certain city. The data obtained for 30 days is as follows :
 Make a grouped frequency distribution table for this data with class intervals as 0.00 - 0.04, 0.04 -0.08 and so on.Solution in Punjabi
Step by step video & image solution for A study was conducted to find out the concentration of sulphur dioxide in the air in parts per million (ppm) of a certain city. The data obtained for 30 days is as follows : Make a grouped frequency distribution table for this data with class intervals as 0.00 - 0.04, 0.04 -0.08 and so on. by Maths experts to help you in doubts & scoring excellent marks in Class 11 exams.
Updated on:21/07/2023Similar Questions
A study was conducted to find out the concentration of sulphur dioxide in the air in parts per million (ppm) of a certain city. The data obtained for 30 days is as follows :
0.030.080.080.090.040.170.160.050.020.060.180.200.110.080.120.130.220.070.080.010.100.060.090.180.110.070.050.070.010.04
(ii) For how many days, was the concentration of sulphur dioxide more than 0.11 parts per million ?
View SolutionA study was conducted to find out the concentration of sulphur dioxide in the air in parts per million (ppm) of a certain city. The data obtained for 30 days is as follows :

You were asked to prepare a frequency distribution table, regarding the concentration of sulphur dioxide in the air in parts per million (ppm) of a certain city for 30 days . Using this table, find the probability of the concentration of sulphur dioxide in the interval 0.12-0.16 on any of these days.
View SolutionA study was conducted to find out the concentration of sulphur dioxide in the air in parts per million (ppm) of a certain city. The data obtained for 30 days is as follows: 0.03 0.08 0.08 0.09 0.04 0.170.16 0.05 0.02 0.06 0.18 0.200.11 0.08 0.12 0.13 0.22 0.070.08 0.01 0.10 0.06 0.09 0.180.11 0.07 0.05 0.07 0.01 0.04 (i) Make a grouped frequency distribution table for this data with class intervals as 0.00 - 0.04, 0.04 - 0.08, and so on.(ii) For how many days, was the concentration of sulphur dioxide more than 0.11 parts per million?
View SolutionA study was conducted to find out the concentration of sulphur dioxide in the air in parts per million (ppm) of a certain city. The data obtained for 30 days is as follows:

(i) Make a grouped frequency distribution table for this data with class intervals as 0.00 -0.04, 0.04 -0.08, and so on. (ii) For how many days, was the concentration of sulphur dioxide more than 0.11 parts per million ?
View SolutionA study was conduced to find out the concentration of sulphur dioxide in the air in parts per million (ppm) of a certain city. The data obtained for 30 days is as follow:
0.03 0.08 0.08 0.09 0.04 0.170.16 0.05 0.02 0.06 0.18 0.200.11 0.08 0.12 0.13 0.22 0.070.08 0.01 0.10 0.06 0.09 0.180.11 0.07 0.05 0.07 0.01 0.04
You were asked to prepare a frequency distribution table, regarding the concentration of sulphur dioxide in the air in parts per million of a certain city for 30 days. Using this table, find the probability of the concentration of sulphur dioxide in the interval 0.12-0.16 on any of these days.
View SolutionA study was conducted to find out the concentration of sulphur dioxide in the air in parts per million (ppm) of a certain city. The data obtained for 30 days is a follows :

(i) Make a grouped frequency distribution table for this data with class-intervals as 0.00−0.04,0.04−0.08 and so on.
(ii) For how many day's was the concentration of sulphar dioxide more than 0.11 parts per million (ppm)?
View SolutionA study was conducted to find out the concentration of sulphur dioxide in the air in parts per million (ppm) of a certain city. The data obtained for 30 days is as follows :
 For how many days, was the concentra-tion ofsulphur dioxide more than 0.11 parts per million.
View Solution
