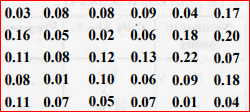
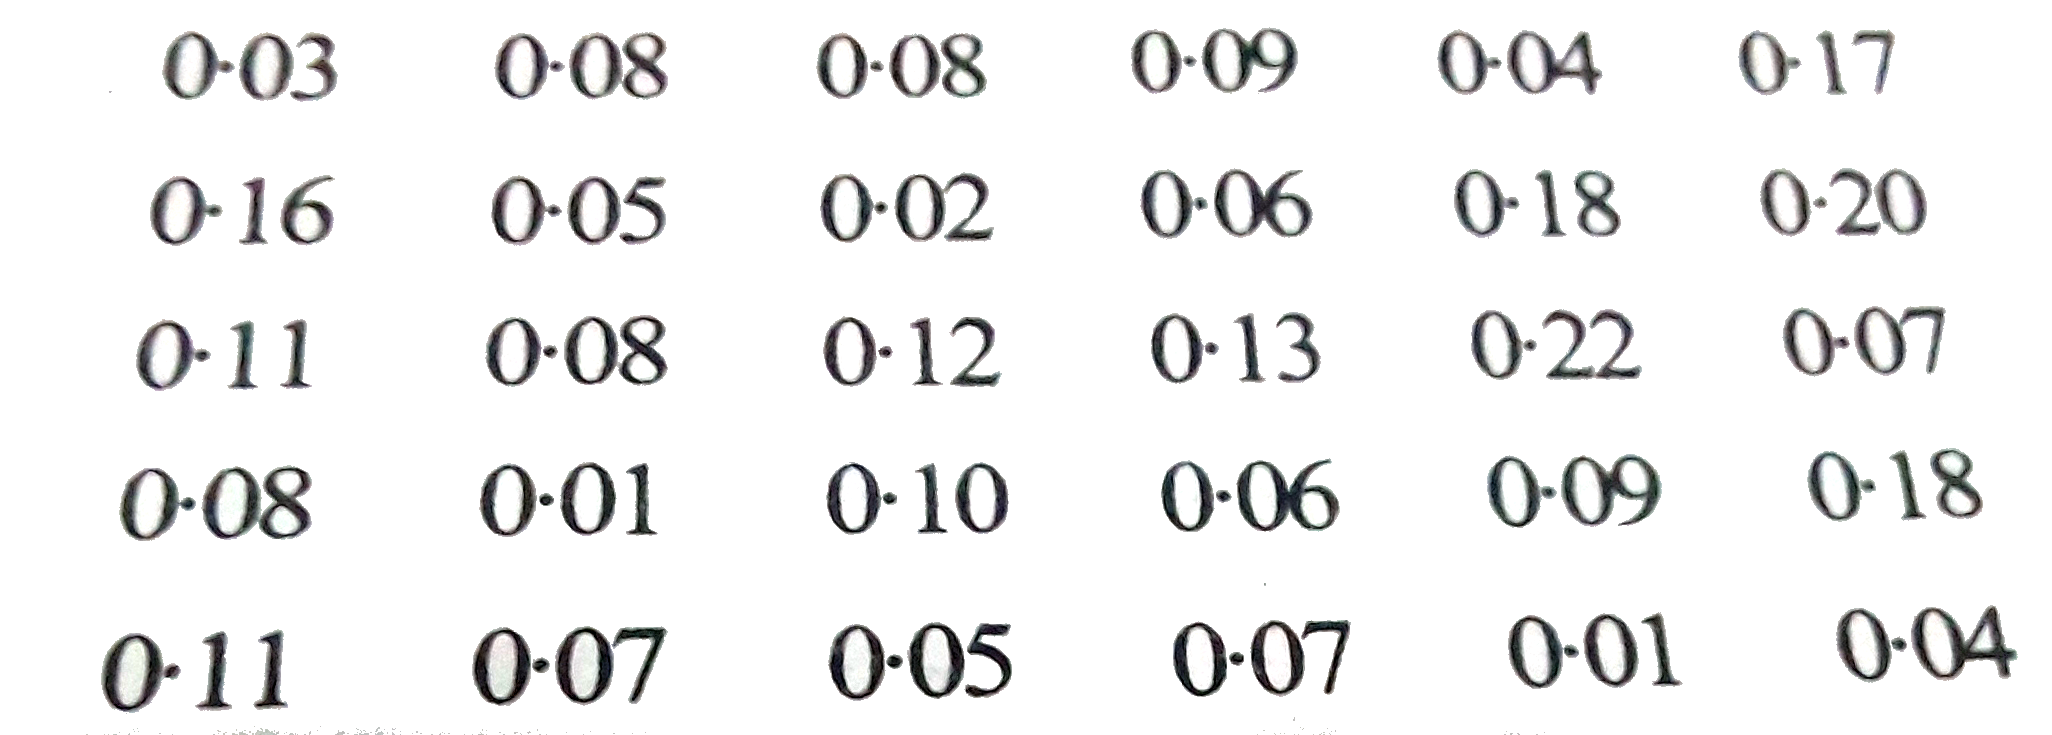
A study was conducted to find out the concentration of sulphur dioxide in the air in parts per million (ppm) of a certain city. The data obtained for 30 days is as follows :
 For how many days, was the concentra-tion ofsulphur dioxide more than 0.11 parts per million.Solution in Punjabi
The correct Answer is:than 0.11 ppm for 8 days
Step by step video, text & image solution for A study was conducted to find out the concentration of sulphur dioxide in the air in parts per million (ppm) of a certain city. The data obtained for 30 days is as follows : For how many days, was the concentra-tion ofsulphur dioxide more than 0.11 parts per million. by Maths experts to help you in doubts & scoring excellent marks in Class 9 exams.
Updated on:21/07/2023Topper's Solved these Questions
- STATISTICS BOOK - SWAN PUBLICATIONCHAPTER - STATISTICS EXERCISE - EXERCISE 14.3
17 Videos
- STATISTICS BOOK - SWAN PUBLICATIONCHAPTER - STATISTICS EXERCISE - EXERCISE 14.4
7 Videos
- STATISTICS BOOK - SWAN PUBLICATIONCHAPTER - STATISTICS EXERCISE - Objective Type Questions (Fill in Blanks:)
1 Videos
- QUADRILATERALSBOOK - SWAN PUBLICATIONCHAPTER - QUADRILATERALSEXERCISE - Objective Type Questions ( Fill in the Blanks)
10 Videos
- SURFACE AREAS AND VOLUMES BOOK - SWAN PUBLICATIONCHAPTER - SURFACE AREAS AND VOLUMES EXERCISE - Objective Type Questions (Fill in the Blanks )
7 Videos
Similar Questions
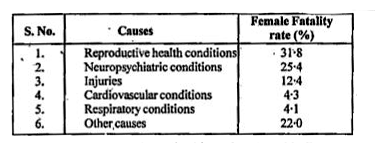
A survey conducted by an organisation for the cause of illness and death among the women between the ages 15-44 (in years) worldwide, found the following figures (in %):

Represent the information given above graphically.
View SolutionThe following number of goals were scored by a team in a series of 10 matches : 2, 3, 4, 5, 0, 1, 3, 3, 4, 3 Find mean, median and mode of these scores :
View SolutionThe mid value of the class intervals is known as the ...........
View SolutionSum of the angles of a quadrilateral is ................ .
View SolutionTotal surface area of a cone = ..............
View SolutionA study was conducted to find out the concentration of sulphur dioxide in the air in parts per million (ppm) of a certain city. The data obtained for 30 days is as follows:
0.03 0.08 0.08 0.09 0.04 0.170.16 0.05 0.02 0.06 0.18 0.200.11 0.08 0.12 0.13 0.22 0.070.08 0.01 0.10 0.06 0.09 0.180.11 0.07 0.05 0.07 0.01 0.04
(i) Make a grouped frequency distribution table for this data with class intervals as 0.00 - 0.04, 0.04 - 0.08, and so on.
(ii) For how many days, was the concentration of sulphur dioxide more than 0.11 parts per million?
View SolutionA study was conduced to find out the concentration of sulphur dioxide in the air in parts per million (ppm) of a certain city. The data obtained for 30 days is as follow:
0.03 0.08 0.08 0.09 0.04 0.170.16 0.05 0.02 0.06 0.18 0.200.11 0.08 0.12 0.13 0.22 0.070.08 0.01 0.10 0.06 0.09 0.180.11 0.07 0.05 0.07 0.01 0.04
You were asked to prepare a frequency distribution table, regarding the concentration of sulphur dioxide in the air in parts per million of a certain city for 30 days. Using this table, find the probability of the concentration of sulphur dioxide in the interval 0.12-0.16 on any of these days.
View SolutionA study was conducted to find out the concentration of sulphur dioxide in the air in parts per million (ppm) of a certain city. The data obtained for 30 days is a follows :

(i) Make a grouped frequency distribution table for this data with class-intervals as 0.00−0.04,0.04−0.08 and so on.
(ii) For how many day's was the concentration of sulphar dioxide more than 0.11 parts per million (ppm)?
View SolutionMatch the following Column A to Column B

View SolutionThe inequation that best describes the following graph is _________
View Solutionएक नगर में वायु में सल्फर डाई- ऑक्साइड का सांद्रण भाग प्रति मिलियन [parts per million (ppm) ] में ज्ञात करने के लिए एक अध्ययन किया गया । 30 दिनों के प्राप्त किए गए आंकड़ों ये है :
0.030.080.080.090.040.170.160.050.020.060.180.200.110.080.120.130.220.070.080.010.100.060.090.180.110.070.050.070.010.04
(i) 0.00−0.04,0.04−0.08 आदि का वर्ग अंतराल लेकर इन आंकड़ों की एक वर्गीकृत बारम्बारता बंटन सारणी बनाइए ।
(ii) सल्फर डाई- ऑक्साइड की सांद्रता कितने दिन 0.11 भाग प्रति मिलियन से अधिक रही ?
View Solutionएक नागर में वायु में सल्फर डाई-ऑक्सीसडे का सांद्रण भाग प्रति मिलियन [parts per mililion (ppm)] में ज्ञात करने के लिए एक अध्यन किया गया 30 दिनों के प्राप्त किये गये आकड़ो ये है:

(i) 0.00-0.04, 0.04-0.08 आदि का वर्ग अंतराल लेकर इन आकड़ो की एक वर्गीकृत बारंबारता बटन सारणी बनाइये
(ii) सल्फर डाई-ऑक्ससीडे की सांद्रता कितने दिन 0.11 भाग प्रति मिलियन से अधिक रही
View Solutionएक नगर में वायु में सल्फर डाइऑक्साइड का सांद्रण भाग प्रति मिलियन में ज्ञात करने के लिए 30 दिनों के प्राप्त किए गए आँकड़े निम्नलिखित हैं -
0.170.200.070.180.040.010.040.180.220.090.090.060.130.060.070.080.020.120.100.050.080.050.080.010.070.030.160.110.080.11
इन आँकड़ों का 0.04 माप के एक वर्गीकृत बारंबारता बंटन सारणी बनाएँ | बताएँ कि -
सल्फर डाइऑक्साइड कि सांद्रता कितने दिन 0.08 भाग प्रति मिलियन से कम रही |
View SolutionA study was conducted to find out the concentration of sulphur dioxide in the air in parts per million (ppm) of a certain city. The data obtained for 30 days is as follows :
0.030.080.080.090.040.170.160.050.020.060.180.200.110.080.120.130.220.070.080.010.100.060.090.180.110.070.050.070.010.04
(i) Makes a grouped frequency distribution table for this data with class intervals as 0.00-0.04,0.04-0.08, and so on.
View SolutionA study was conducted to find out the concentration of sulphur dioxide in the air in parts per million (ppm) of a certain city. The data obtained for 30 days is as follows :

You were asked to prepare a frequency distribution table, regarding the concentration of sulphur dioxide in the air in parts per million (ppm) of a certain city for 30 days . Using this table, find the probability of the concentration of sulphur dioxide in the interval 0.12-0.16 on any of these days.
View SolutionA study was conducted to find out the concentration of sulphur dioxide in the air in parts per million (ppm) of a certain city. The data obtained for 30 days is as follows: 0.03 0.08 0.08 0.09 0.04 0.170.16 0.05 0.02 0.06 0.18 0.200.11 0.08 0.12 0.13 0.22 0.070.08 0.01 0.10 0.06 0.09 0.180.11 0.07 0.05 0.07 0.01 0.04 (i) Make a grouped frequency distribution table for this data with class intervals as 0.00 - 0.04, 0.04 - 0.08, and so on.(ii) For how many days, was the concentration of sulphur dioxide more than 0.11 parts per million?
View Solution
