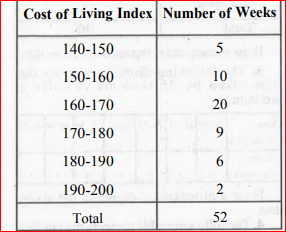
In a city, the following weekly observations were made in a study on cost of living index :
 Draw a histogram and frequency polygon for the above data on the same graph.Solution in Punjabi
Step by step video & image solution for In a city, the following weekly observations were made in a study on cost of living index : Draw a histogram and frequency polygon for the above data on the same graph. by Maths experts to help you in doubts & scoring excellent marks in Class 11 exams.
Similar Questions
The inequation that best describes the graph given below is _________
02:17View SolutionThe inequation that best describes the following graph is _________
02:10View SolutionFrom the following figure, the correct observation is :- ltimg src="https://d10lpgp6xz60nq.cloudfront.net/physics_images/ALN_PHY_R03_E08_015_Q01.png" width="80%"gt
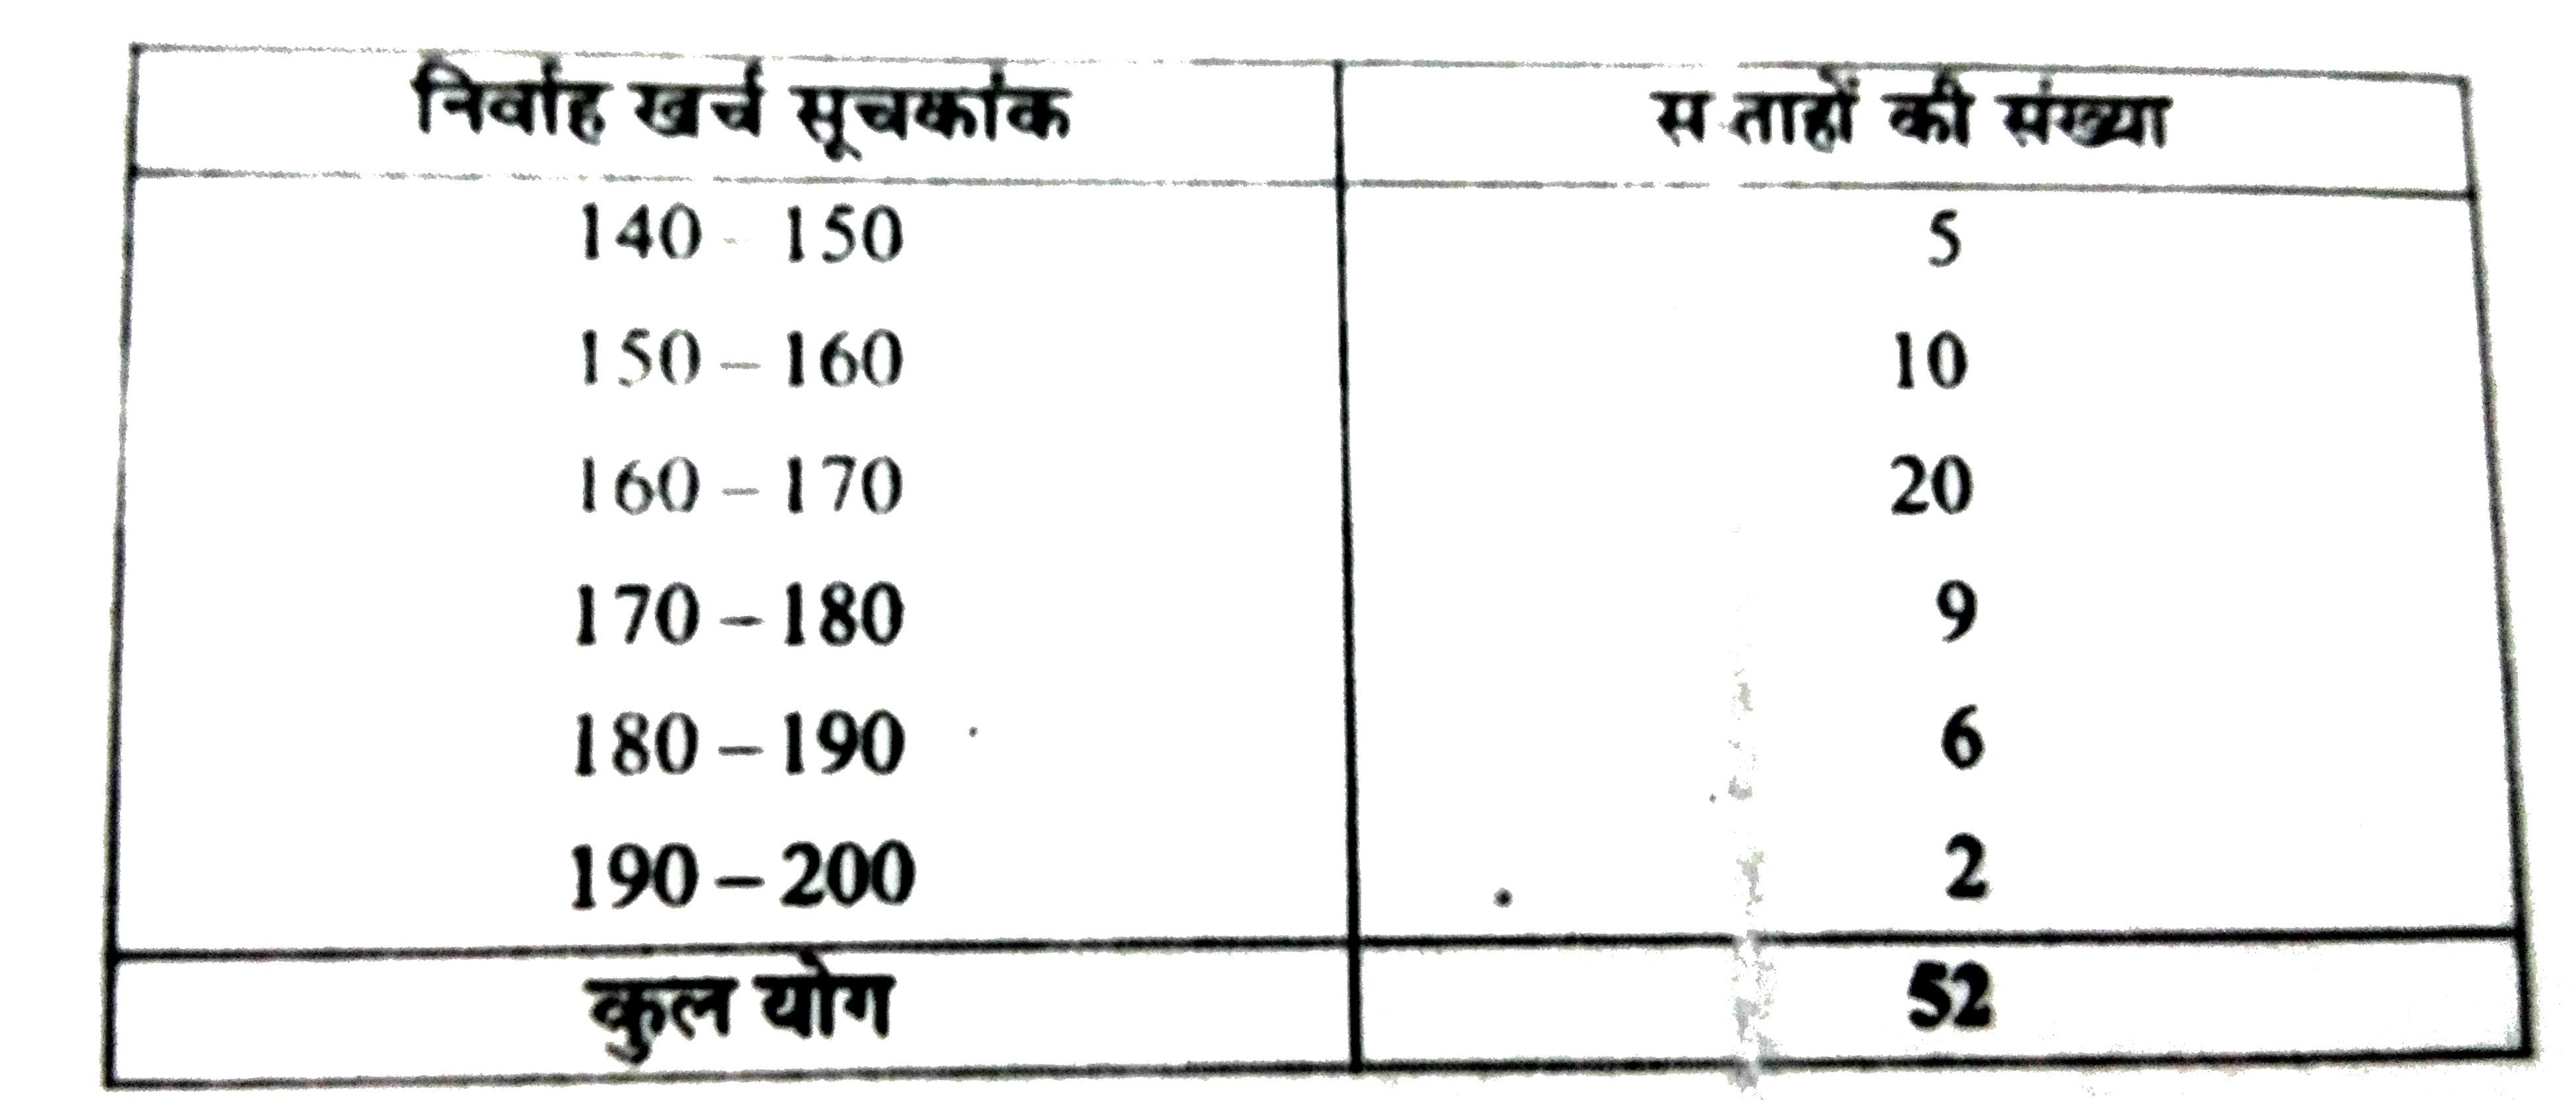
02:41View Solutionएक नगर में निर्वाह खर्च सूचकांक (cost of living index) का अध्ययन करने के लिए निम्नलिखित साप्ताहिक प्रेक्षण किए गए :

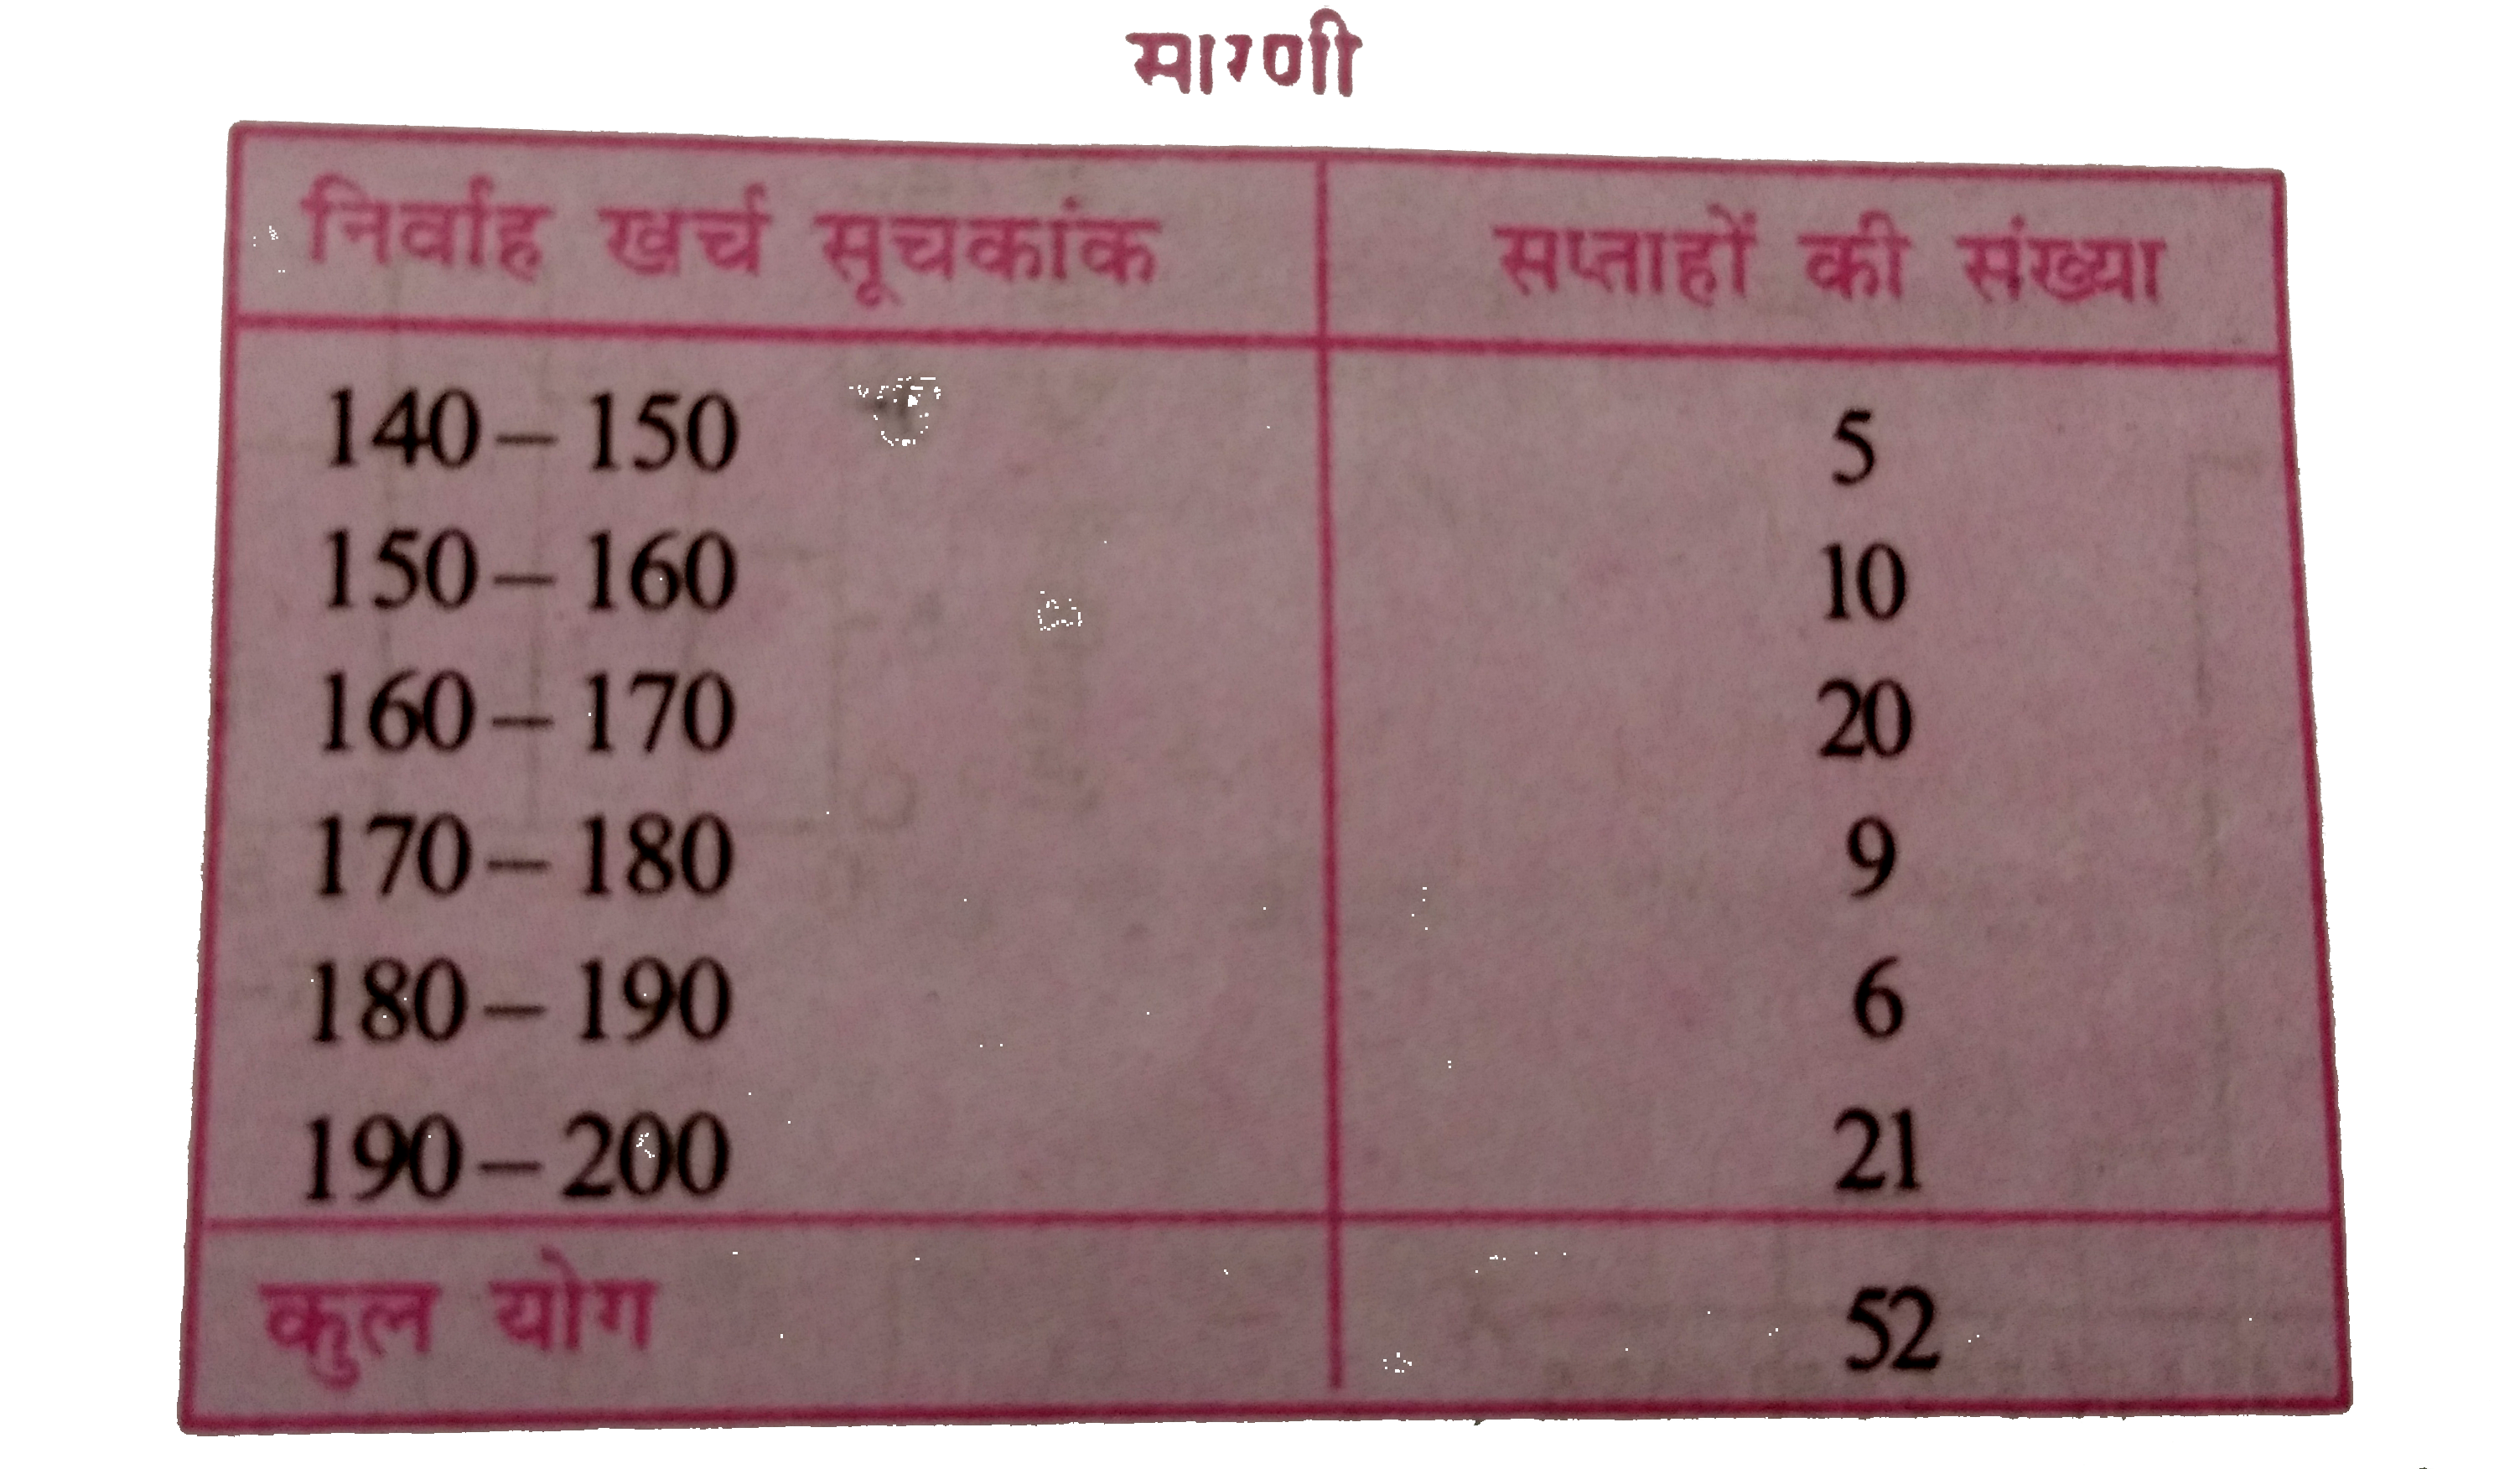
ऊपर दिए गए आँकड़ों का एक बारम्बारता बहुभुज (आयतचित्र बनाए बिना ) खींचिए ।06:55View Solutionएक नगर में निर्वाह खर्च सूचकांक का अध्ययन करने के लिए निम्नलिखित साप्ताहिक प्रेक्षण किए गए :

ऊपर दिए गए आँकड़ो का एक बारंबारता बहुभुज (आयतचित्र बनाए बिना) खीचिए ।05:57View SolutionIn a city of weekly observations made in a study on the cost of loving index are given in the following tadraw a frequency polygon (without constructing histogram )
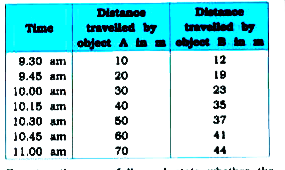
05:27View SolutionThe data regarding the motion of two different objects A and B are given in the following table :

Examine them carefully and state whether the motion of the objects is uniform or non-uniform.02:48View Solution

