Which of the following graphs shows the correct description of effect of pH on enzyme activity?
A

B

C

D

Text Solution
The correct Answer is:C
|
Topper's Solved these Questions
Similar Questions
Knowledge Check
Which of the following is not correct description?
ASO2−sp2 hybridised sulphur - angular shape - one lone pair over sulpur - one (dπ−pπ) and one (pπ−pπ) bondBSO2−3−sp3 hybridised sulphur - pyramidal shape - one (dπ−pπ) bondCSO2−4−sp3 hybridised sulphur - tetrahedral shape - tow (dπ−pπ) bondsDSO3−sp3 hybridised sulphur-planar triangle shape - two (pπ=pπ) and one (dπ−pπ) bondsWhich of the following graph is correct for the enzyme catalysis ?
A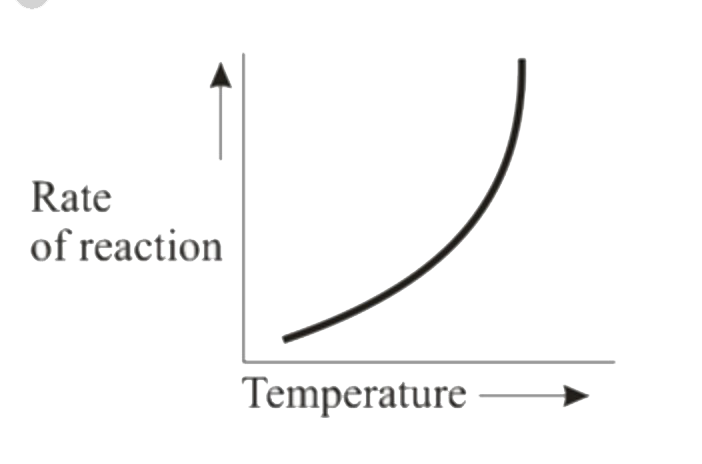 B
B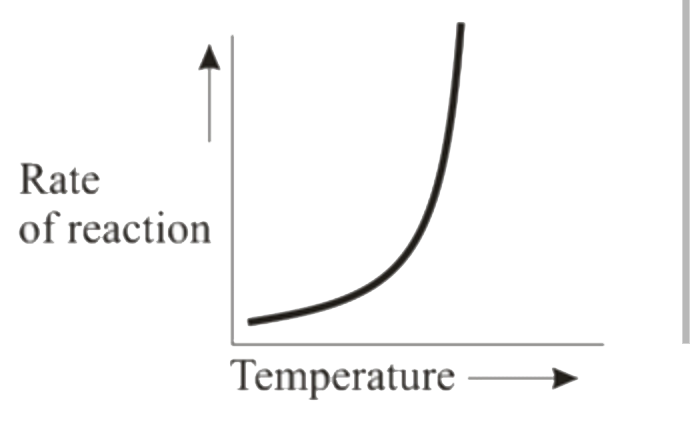 C
C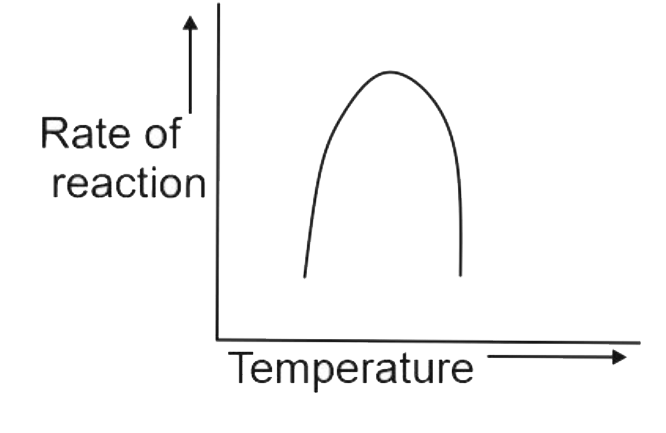 D
D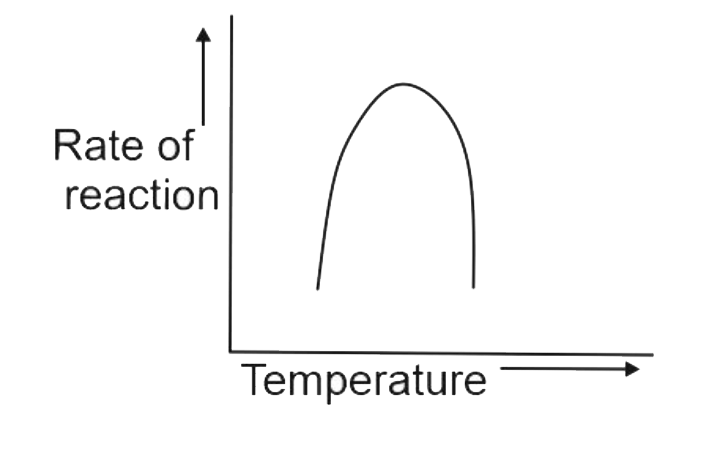
Which of the following is correct plot for effect of catalyst on activation energy.
A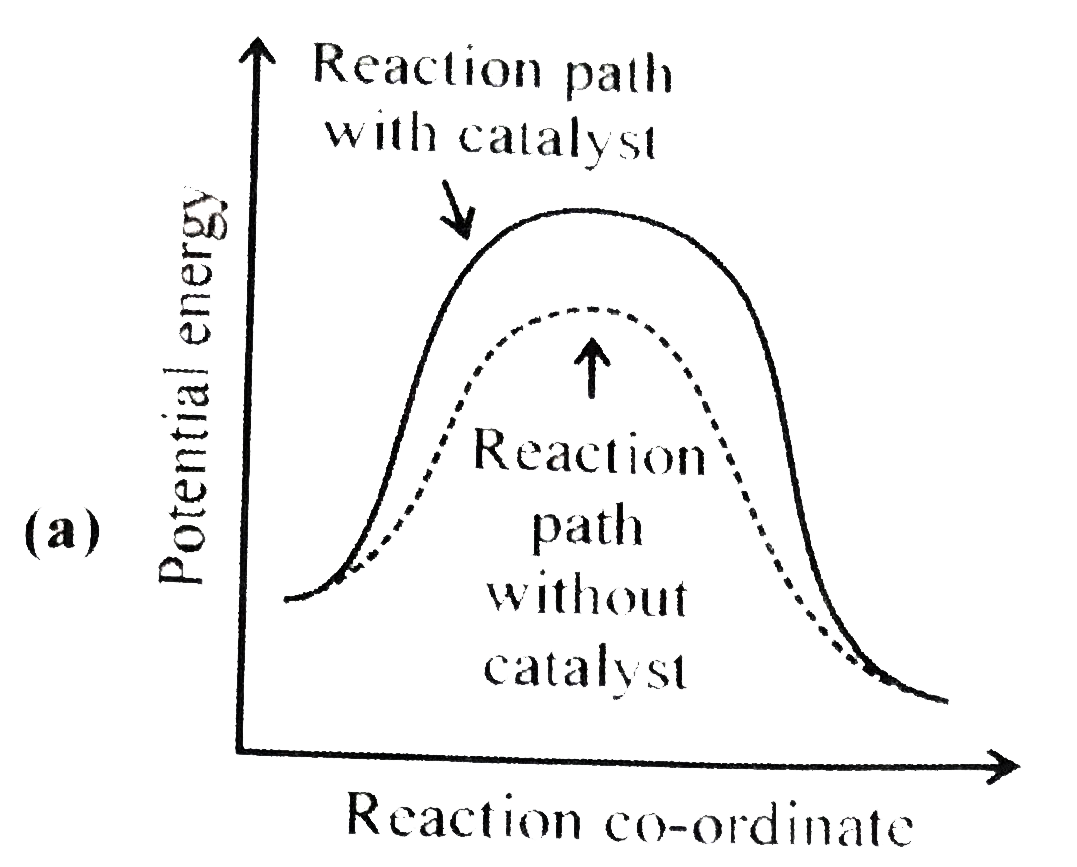 B
B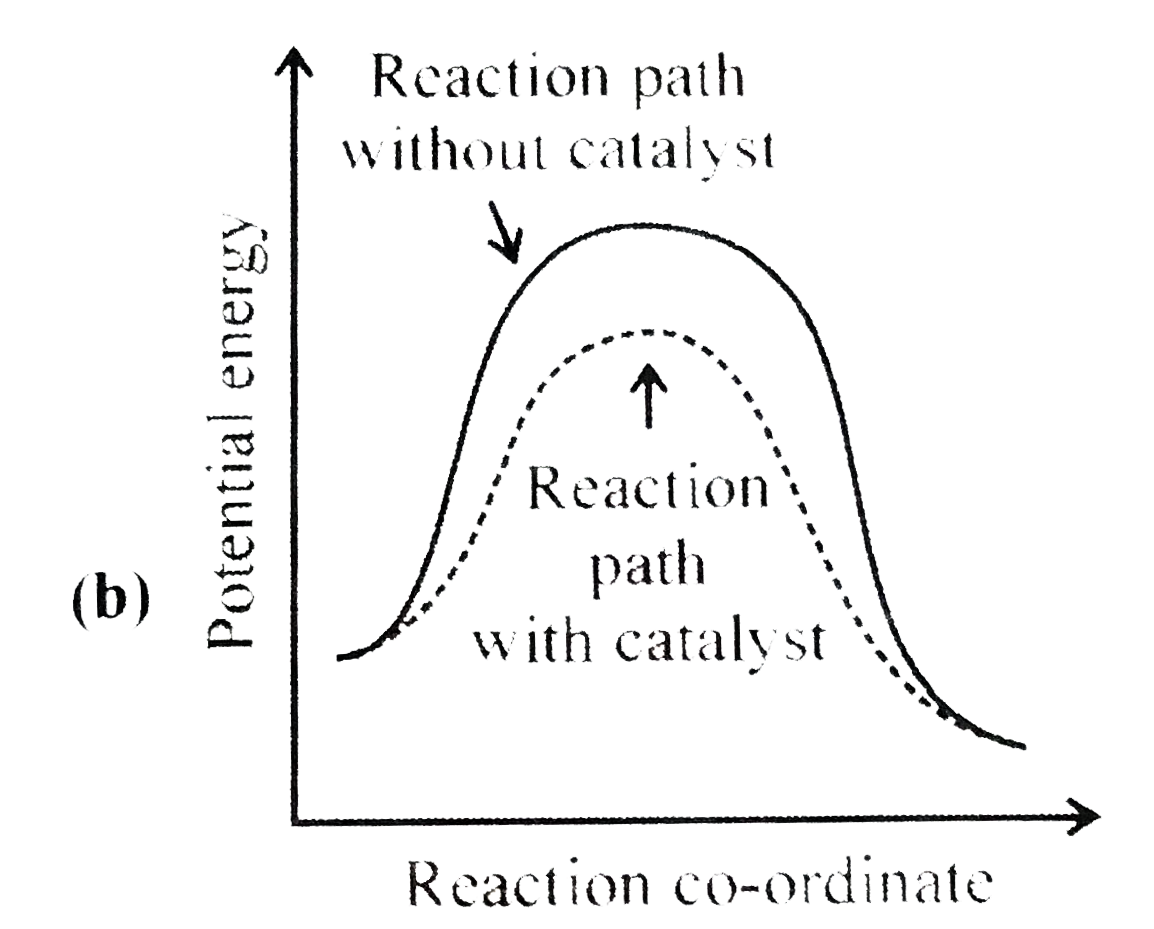 C
C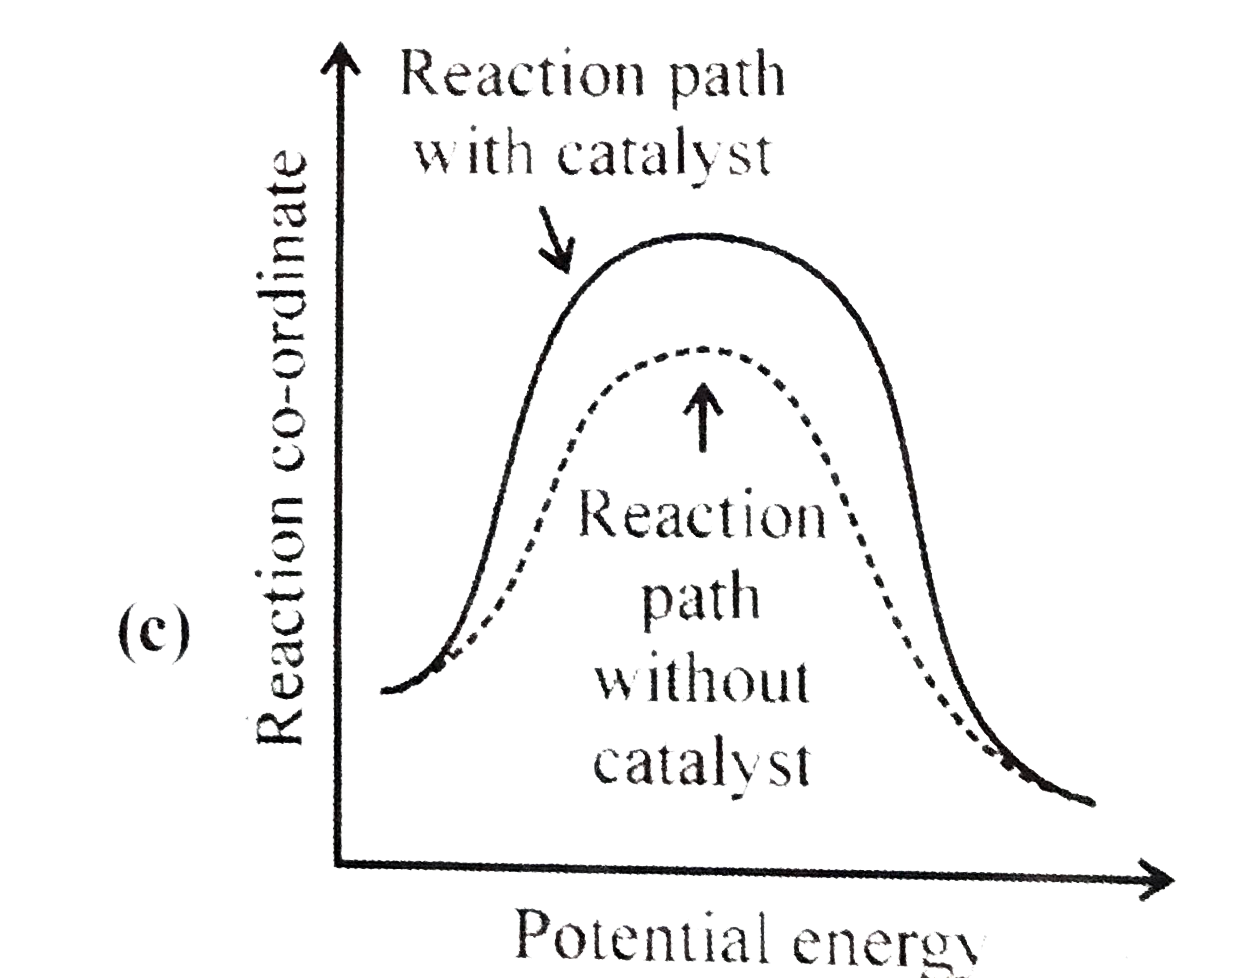 D
D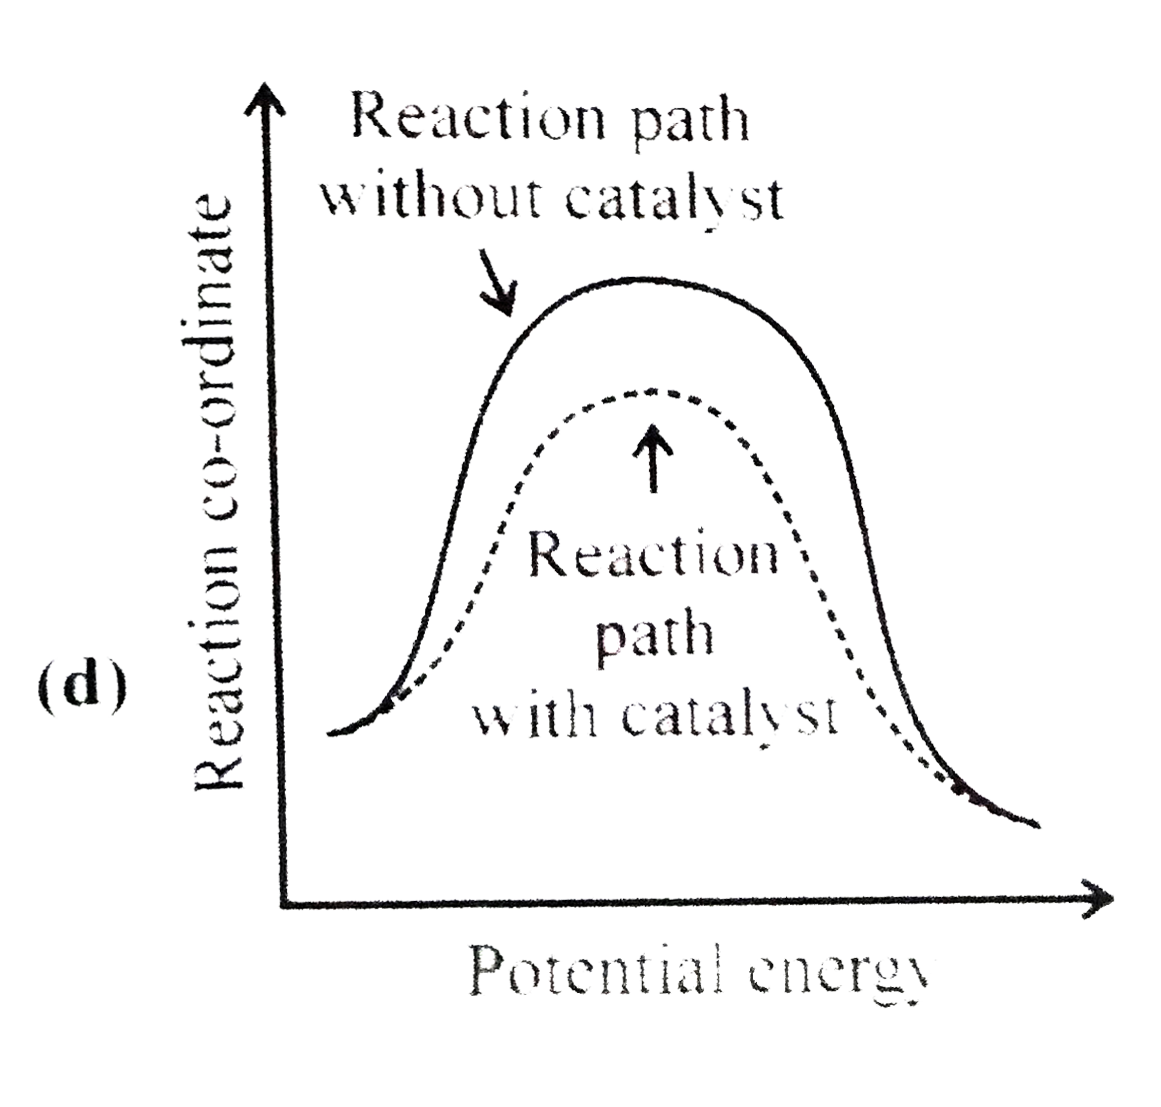
How does pH affects the rate of enzyme activity?
View SolutionFollowing graphs show the effect of change in concentration of substrate on enzyme activity:
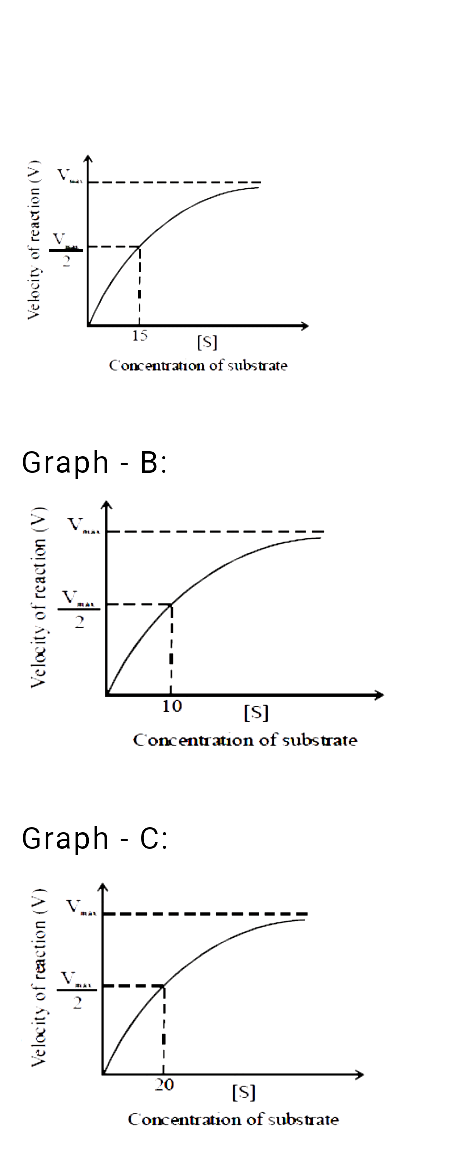
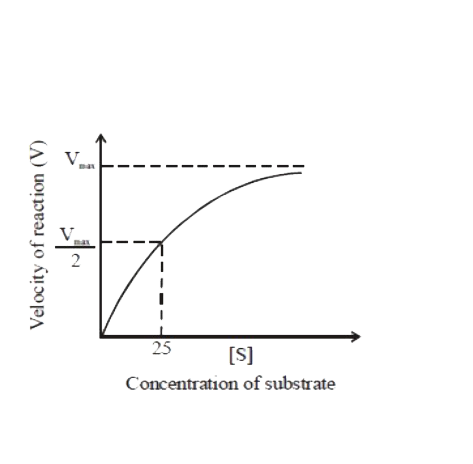
In which of the above curve,the enzyme shows maximum substrate affinity
View SolutionFollowing graphs show the effect of change in concentration of substrate on enzyme activity:


In which of the above curve,the enzyme shows maximum substrate affinity
View SolutionWhich is not correct about enzyme activity?
View SolutionWhich is not correct about enzyme activity?
View Solution
