Following graphs show the effect of change in concentration of substrate on enzyme activity:
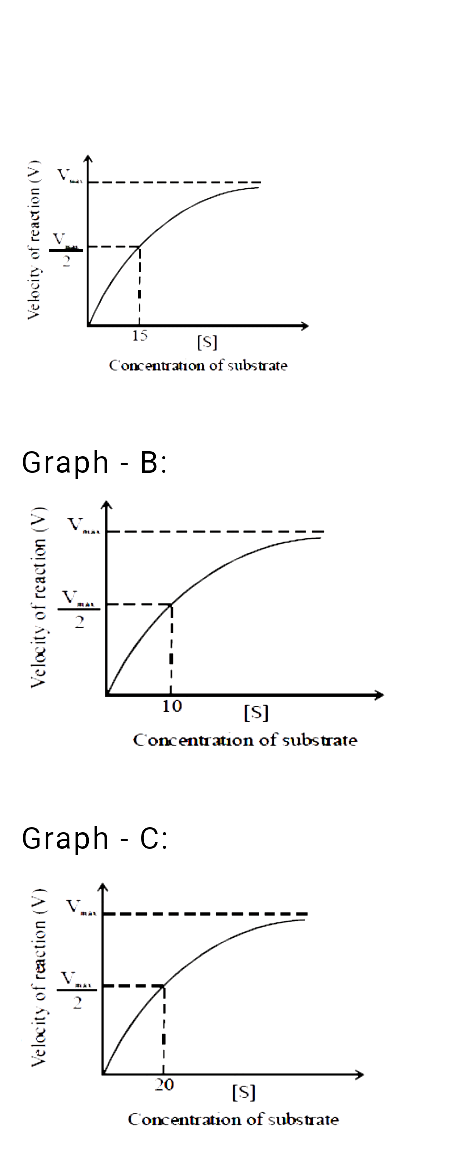
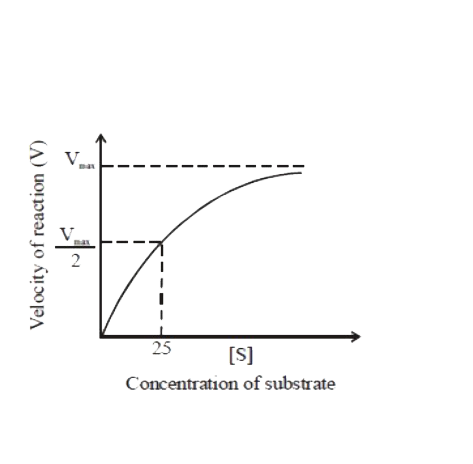
In which of the above curve,the enzyme shows maximum substrate affinity
Graph -A
Graph - B
Graph - C
Graph - D
The correct Answer is:B
Step by step video & image solution for Following graphs show the effect of change in concentration of substrate on enzyme activity: In which of the above curve,the enzyme shows maximum substrate affinity by Biology experts to help you in doubts & scoring excellent marks in Class 12 exams.
Updated on:21/07/2023Similar Questions
Knowledge Check
Which of the following is not true concerning enzyme activity?
AEnzymes are considered organic catalystsBMost enzymes work with a wide variety of substratesCEnzymes are not altered in the course of their actionDEnzymes form temporary compounds with their substratesWhich of the following graphs shows the relationship between the rate of an enzymatic activity and substrate concentration (S) ?
A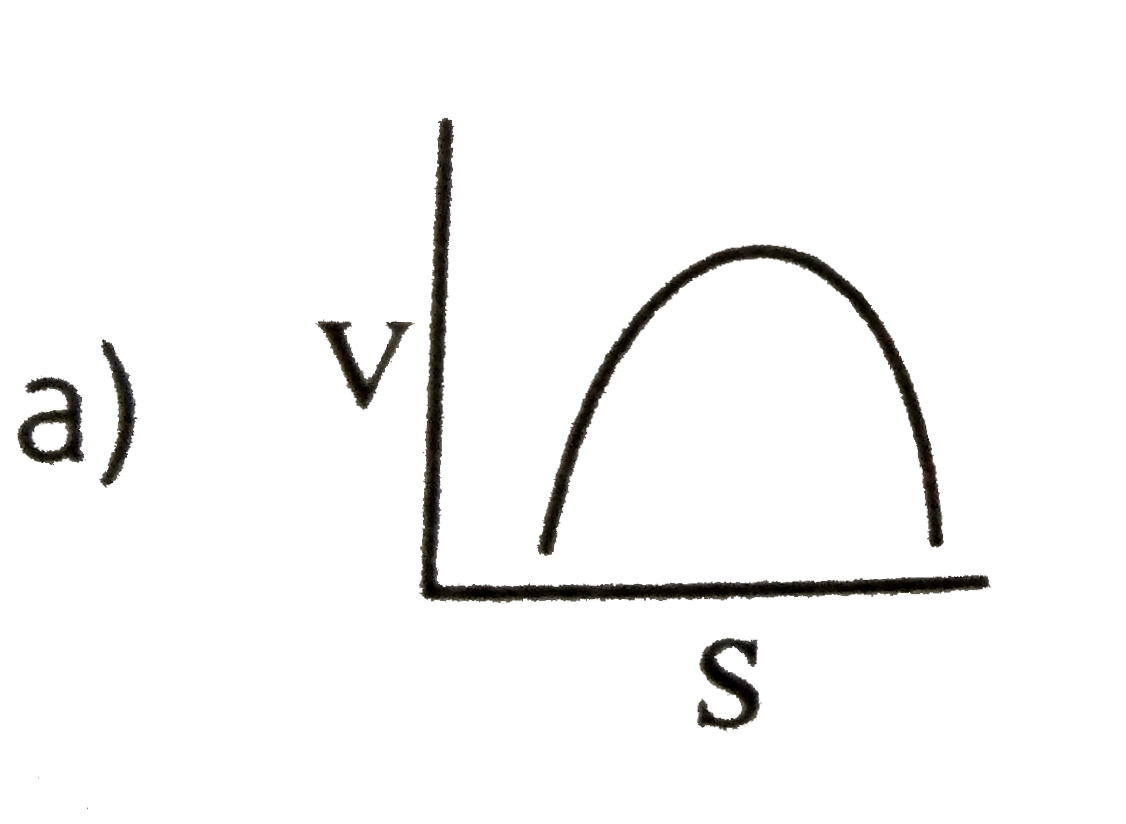 B
B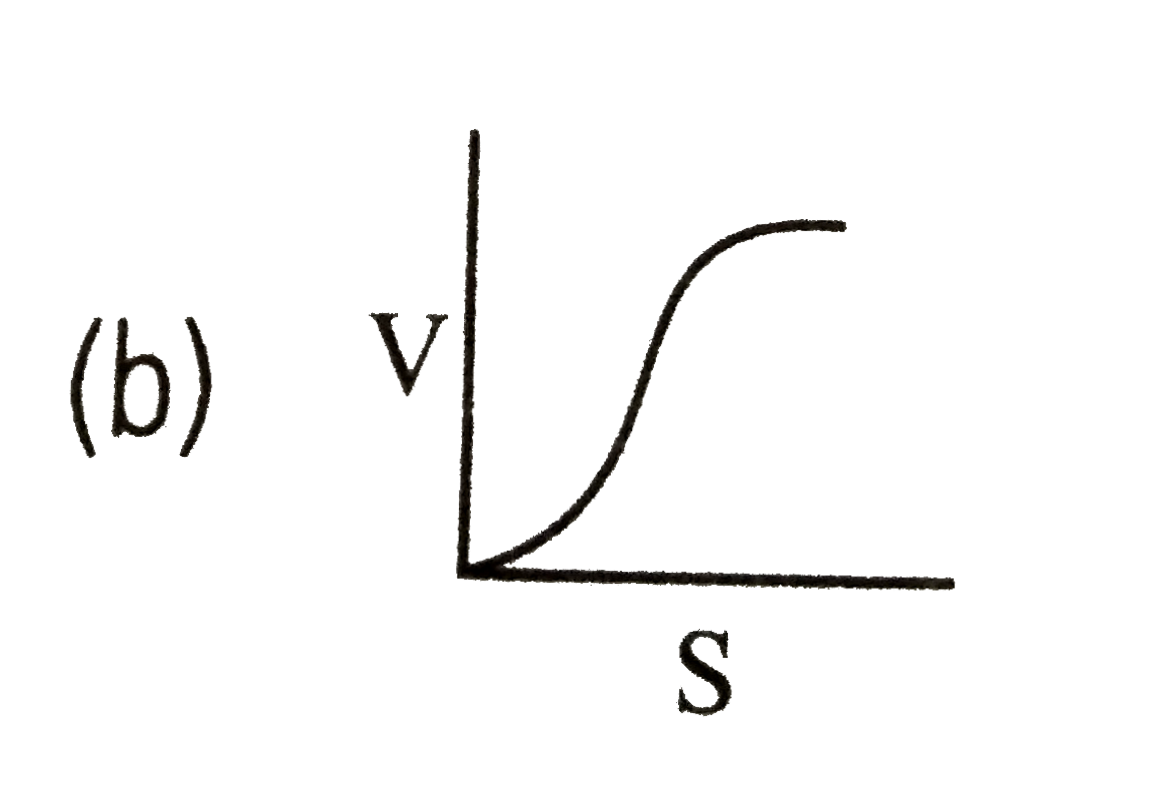 C
C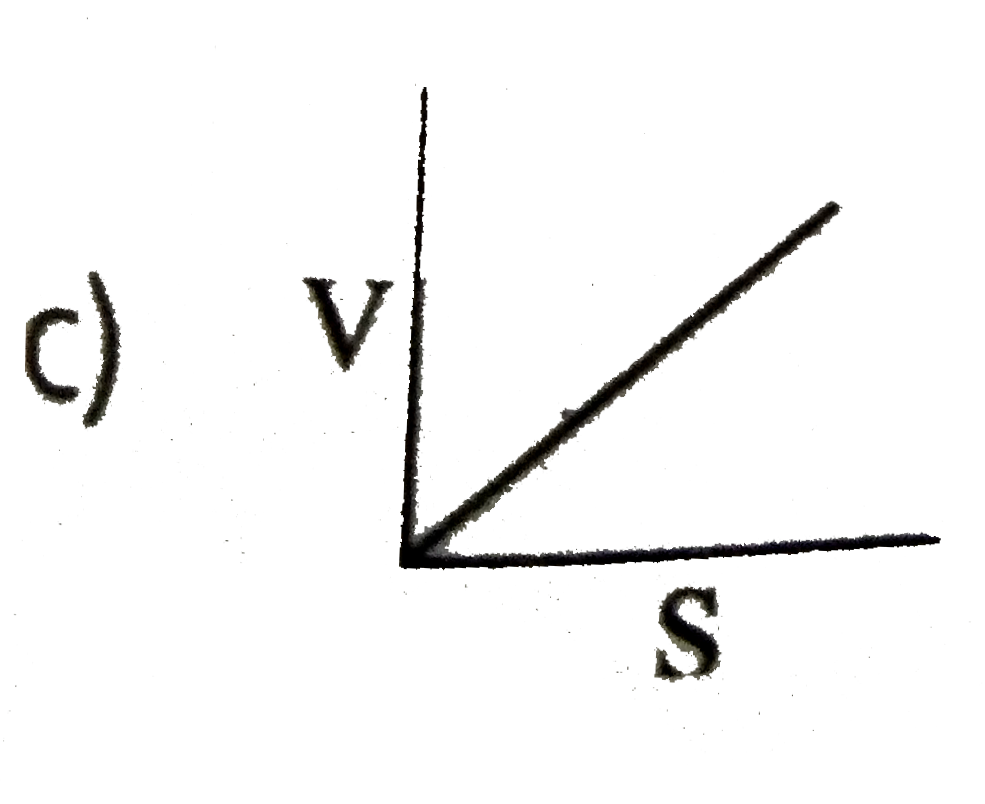 D
D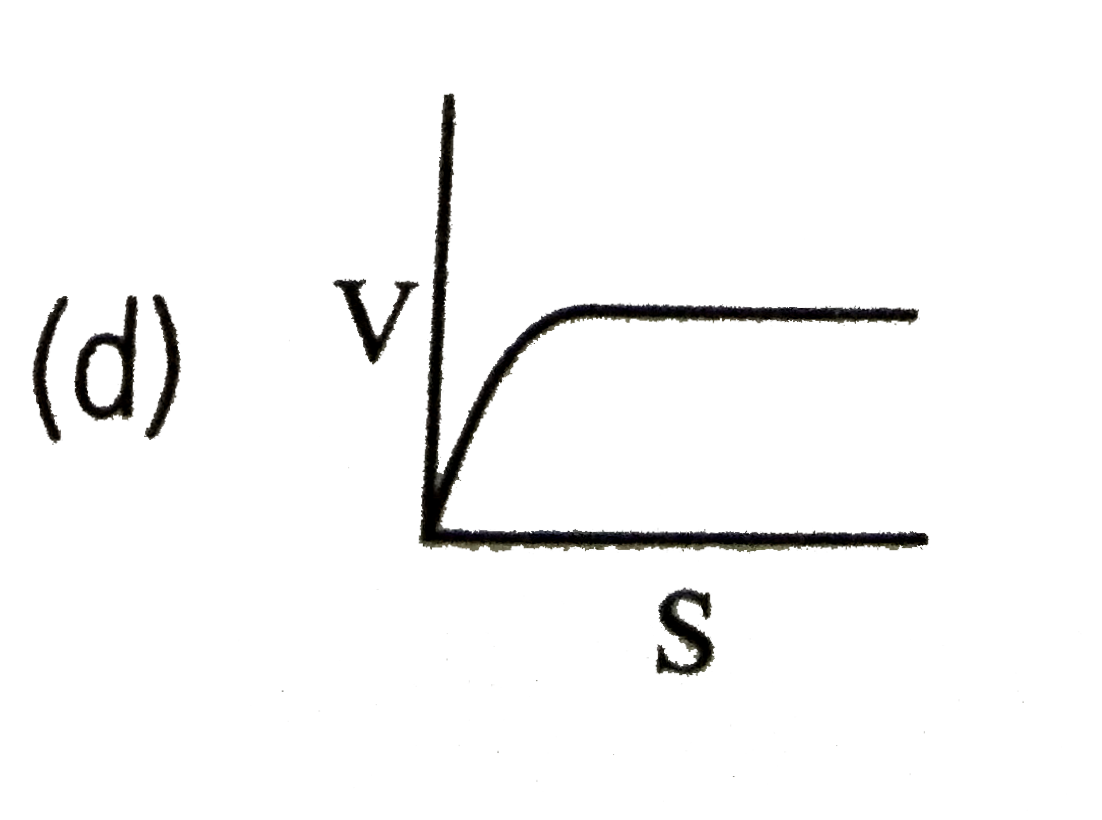
Which graphs shows the correct description of effect of pH on the enzymatic activity
View SolutionIf you study the effect of substrate concentration on an enzymatic reaction, what kind of curve would you obtain?
View SolutionWhich of these best describes how the substrate fits with the enzyme ?
View SolutionAn active site of an enzyme is a____into which of the substrate fits.
View SolutionWhat type of forces are involved in binding of substrate to the active site of enzyme ?
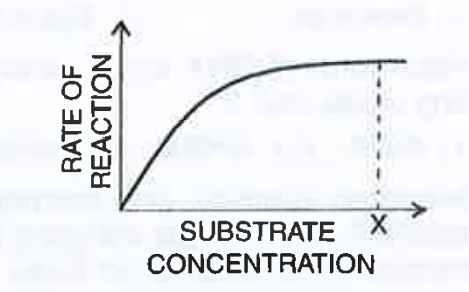
View SolutionThe given graph is showing the relationship between the rate of enzyme reaction and concentration of substrate. At concentration of substrate greater than X, the
View Solution
