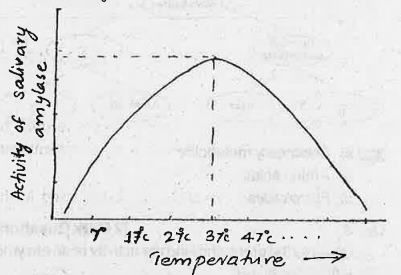
Analyse the graph showing the activity of salivary amylase Why the activity declines below the optimum value?  Solution in Malayalam
Step by step video & image solution for Analyse the graph showing the activity of salivary amylase Why the activity declines below the optimum value? by Biology experts to help you in doubts & scoring excellent marks in Class 11 exams.
Topper's Solved these Questions
Similar Questions
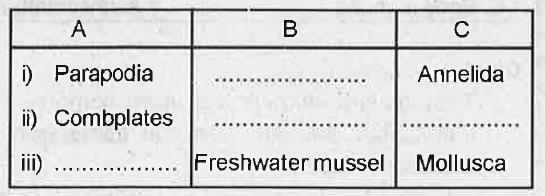
Fill in the blanks.
 02:28View Solution
Name the double walled membrane of human heart. (Cuticle, Pleura, Pericardium, Sarcolemma)
02:39View SolutionThe salivary amylase shows maximum digestive action at pH "______"
02:40View SolutionWhat is the optimum pH for the action of enzyme salivary amylase?
03:16View Solutionलार का टायलिन किस माध्यम में सक्रिय होता है?
01:14View SolutionThe activity of salivary amylase is increased in the presence of ____ ions.
02:34View SolutionThe substrate of salivary amylase is
01:49View SolutionOptimum pH for the action of salivary amylase is
View SolutionThe salivary amylase shows maximum digestive action at pH "______"
01:43View SolutionSalivary amylase act at a pH of
02:08View SolutionAnalyse the graph showing the activity of salivary amylase Which is the optimum temperature for salivary amylase obtained from the graph.
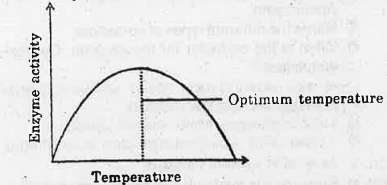
02:27View SolutionAnalyze the graph showing the activity of an enzyme, influenced by temperature.
 What is meant by optimum temperature?02:11View Solution
Analyze the graph showing the activity of an enzyme, influenced by temperature. Why does the enzyme activity decline at too high temperatures?
02:45View SolutionSalivary amylase is also known as
01:03View SolutionWhy does the action of salivary amylase stop in stomach?
02:18View Solution

